REVIEW 3 major objections 6 minor 71 references
A vision foundation model for single-cell biology via spatial gene cartography
T0 review · 3 major / 6 minor · reviewed 2026-08-02 · deepseek-v4-flash
Pith's one-line read A cell rendered as an image, with genes placed by their co-expression, transfers to held-out tissues better than token-sequence representations.
desk verdict A serious, unusually honest single-cell foundation model paper whose central representation claim is plausible, but the headline 'most accurate' ranking needs the withheld code and a reference-bank/pretraining overlap check before it can be trusted. read the letter →
The pith
A machine-rendered reading of the paper's core claim, the machinery that carries it, and where it could break.
The reading
What carries the argument
The scImage: a 104×104 single-channel image with exactly one gene per pixel, built by Gromov–Wasserstein optimal transport that aligns a gene–gene co-expression distance matrix to a pixel–pixel Euclidean distance matrix. This fixed pan-tissue layout, computed once, makes co-expressed genes spatial neighbors, so a cell's continuous expression values become image intensities and gene programs become local texture. A ViT-base encoder is pretrained by masked image modeling on 72 million cells, and the frozen encoder's mean-pooled patch tokens serve as the zero-shot cell embedding.
What would settle it
Check whether the studies that supply the labeled reference bank are present in the pretraining split, then retrain scVision excluding those studies and re-run the six-atlas balanced-accuracy evaluation. If the accuracy margin over token models collapses to parity, the spatial-layout claim is falsified.
Extended reading notes
Core claim
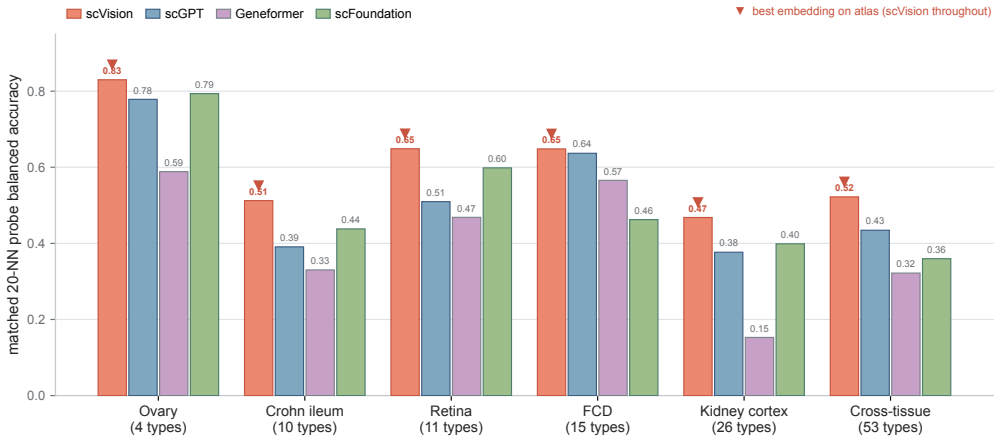
scVision establishes that a transcriptome can be represented as a fixed-layout image in which gene programs appear as local texture, and that this representation, when learned by a masked autoencoder on 72 million human cells, transfers across studies better than gene-token sequence representations. The central claim is that the learned spatial arrangement of genes—not the vision transformer alone—carries the larger share of the signal: randomly permuting the gene-to-pixel layout drops balanced accuracy from 0.52 to 0.29, while removing the encoder drops it only to 0.46. On six held-out atlases, the frozen scVision embedding yields the highest balanced accuracy and present-class macro-F1 amo
Load-bearing premise
The zero-shot evaluation assumes the reference bank used for scoring is truly independent of the 72-million-cell pretraining set; if the reference studies overlap with pretraining, the claimed transfer advantage could partly reflect memorization rather than generalization.
Editorial extensions
If this is right
- Frozen scVision embeddings annotate held-out cell types more accurately than token-sequence foundation models on every tested atlas, with one labeled cell per type often beating other models given fifty labels.
- Attention read from the last transformer block recovers cell-type-specific gene programs without pathway supervision, including a shared four-gene myeloid program found in microglia, macrophages, and dendritic cells across organs.
- On multi-study integration, scVision matches the strongest token-based model on the combined score while preserving more biological structure, and does so without ever seeing a batch label.
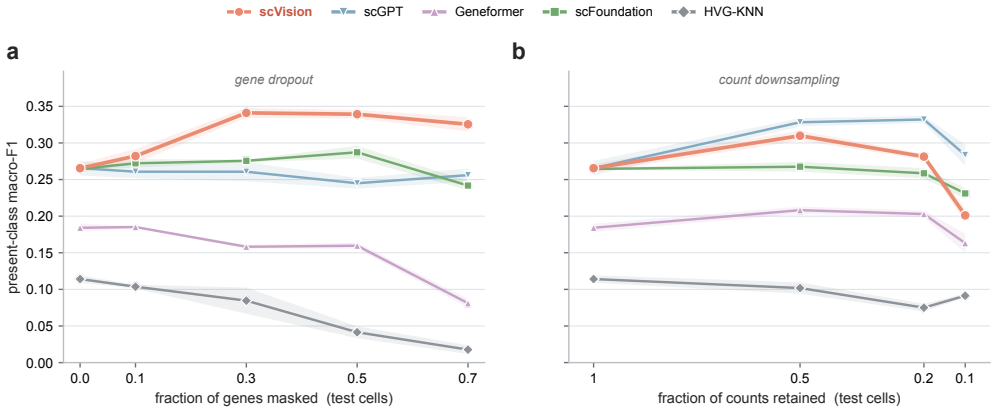
- The spatial formulation makes the representation robust to gene dropout—it remains above its clean-atlas score even with 70% of genes masked—while degrading gracefully with sequencing depth.
- Spatial masking of a gene neighborhood provides a way to perturb a co-regulated module in silico, an operation with no direct counterpart in token-based models.
Reading between the lines
- If the spatial layout is the main carrier of signal, then improving the layout itself—for example, learning tissue-specific maps or refining the optimal-transport cost—could yield further accuracy gains without changing the encoder.
- The label-efficiency result suggests that representation quality, not classifier choice, is the bottleneck in zero-shot cell annotation, which could simplify future annotation pipelines in practice.
- The image formulation naturally extends to spatial transcriptomics and paired modalities such as surface protein or chromatin accessibility, where the same layout logic might apply.
- A direct test of the framework's generality would be to pretrain on multiple species and evaluate whether the learned layout transfers across species boundaries, since the current model is human-only.
Editorial analysis
A structured set of objections, weighed in public.
Referee Report
Summary. The paper introduces scVision, a vision foundation model for single-cell transcriptomics. Each cell is rendered as a 104×104 image by placing 10,816 highly variable genes on an optimal-transport layout so that co-expressed genes are spatially adjacent; a ViT-B is pretrained with masked image modeling on 72 million human cells from CZ CELLxGENE Census data. The frozen encoder is then evaluated without fine-tuning on six held-out atlases using a shared 20-nearest-neighbour probe, and the authors claim it is the most accurate cell-type annotator, the most label-efficient, and that the spatial layout—not the encoder—carries most of the signal. The paper also reports attention-based gene-program discovery, cross-tissue program recurrence, multi-study integration comparable to scGPT/scVI on scIB total score, and higher deployment throughput than token-based foundation models.
Significance. If the central claims hold, scVision would be a meaningful conceptual advance: it replaces gene-token sequences with a continuous spatial image, preserves expression magnitude, and connects single-cell representation learning to mature computer-vision methods. The evaluation is above average in care: frozen encoders, a shared 20-NN probe for foundation models, present-class metrics that are appropriate for rare cell types, permutation nulls, robustness stress tests, and an honest supplement that reports losses on cystic fibrosis and obstructive nephropathy. The throughput and memory advantages are also concrete strengths. However, the headline 'most accurate zero-shot annotator' claim depends on an unexamined overlap between the pretraining corpus and the labelled reference bank, and the paper's own supplementary tables contradict a broad reading of 'most accurate on every atlas.' These issues are directly load-bearing and need to be resolved before the principal claim can be accepted.
major comments (3)
- [Methods: 'Training data and quality control'; Data availability] The zero-shot claim requires that the studies used to build the 87-type reference bank were excluded from the 72M-cell pretraining split. The manuscript states that about 25 studies form the external test pool and that remaining studies are split by donor, but it never defines the reference bank's composition, nor states whether the reference-bank studies—or the six evaluation atlases—are disjoint from the pretraining studies. Since both the reference bank and the pretraining data are drawn from CZ CELLxGENE Census, the same studies, and even the same labelled support cells, could appear on both sides. If so, scVision's embedding could have been shaped by exactly those cells during masked-image pretraining, giving it a transfer advantage over baselines that never saw those studies. This would not invalidate the layout-ablation result, but it would undermine the central 'zero-shot most ac
- [Table S1; Table S4; Discussion, final paragraph] The main text and Discussion state that scVision is 'the most accurate annotator on every held-out atlas,' and the Abstract says it is 'the most accurate cell-type annotator' relative to existing foundation models and classical baselines. The supplement itself contradicts a broad reading: Table S1, obstructive-nephropathy row under the 20-NN probe, gives scVision 0.482 balanced accuracy versus 0.503 for logistic regression (Δ = −0.021), and Table S4 reports that scFoundation wins cystic fibrosis. The claim may be intended to cover only the six named main-text atlases and only the matched-probe comparison, but as written it is overbroad. Please qualify the central claim explicitly to the six atlases and metrics where it holds, and either remove or prominently contextualize the supplementary losses. This is not a cosmetic issue: readers will otherwise draw a conclusion the paper's own data
- [Fig. 5e; Fig. 7e; Results: 'The advantage is in the spatial representation'] The mechanistic claim that 'the learned spatial arrangement of genes carries the larger share of the signal' is based on ablating the layout only at inference time: the encoder was pretrained on the OT layout, and a permuted layout is therefore an out-of-distribution input. This conflates 'biologically meaningful layout' with 'the layout the model was pretrained on.' A random but fixed layout, used consistently during pretraining under the same masked-image objective, could plausibly yield comparable zero-shot transfer for a sufficiently flexible ViT; the current controls do not rule this out. To support the biological-meaningfulness mechanism, please add a control in which a shuffled or otherwise non-biological but fixed layout is used during pretraining (same data, same objective) and evaluated on the same six atlases, or explicitly soften the claim to 'the learned spatial arrangement'
minor comments (6)
- [Methods: 'Zero-shot evaluation and baselines'] The 87-type reference bank is never described: no table of cell types, per-type cell counts, label hierarchy, or selection criterion. Since the entire annotation evaluation is scored against this bank, a data card is needed for reproducibility and for understanding apparent failures such as the coarse leukocyte label in Fig. 3g.
- [Results: Fig. 2; Fig. 3; 'ROC-AUC dismissed'] The paper repeatedly dismisses ROC-AUC as class-dominated. This is reasonable in principle, but no quantitative support is given (e.g., per-class AUC vs. abundance). A short supplement table showing that AUC ordering reverses or flattens under class imbalance would make the metric choice more persuasive.
- [Table S1 vs. main text] In Table S1 the Δ column is defined as scVision minus the best of six baselines, but in the obstructive-nephropathy row the value −0.021 is listed while the table summary says 'scVision best (Δ>0): 4/5.' This is internally consistent, but the main text should cite these exceptions when summarizing 'best on every atlas' and should make clear whether 'best' means among foundation models or among all baselines.
- [Code availability] The statement 'The code for scVision ... is reserved for now and will be released publicly, with a persistent identifier, upon publication' prevents independent verification of the central claims, including the overlap analysis requested above. At minimum, release the scImage layout, pretrained weights, and evaluation scripts alongside the revised manuscript.
- [Methods: 'Gene-program inference and cross-tissue recurrence'] The cross-tissue recurrence null is described as a 'label-permuted null' with 1000 permutations. For such high-dimensional Jaccard statistics, please also report the number of cell-type pairs that have exactly n=1 contributing atlas pair separately (Table S6 already marks n=1 entries as 'listed for completeness only'), and state whether the pooled z=41.3 is computed over all pairs or only cross-tissue pairs.
- [Abstract and Introduction] The phrase 'one of the largest pretrained models for single-cell analysis' is ambiguous: scVision has 85M parameters and was trained on 72M cells, while several token-based models report larger corpora. Please state the comparison explicitly (parameters, cells, studies) or soften the claim.
Circularity Check
No significant circularity; the derivation is self-contained and the central claims are measurements, not identities.
full rationale
The paper's derivation chain is: co-expression matrix -> Gromov-Wasserstein optimal-transport layout -> scImage rendering -> masked-image-model pretraining on 72M cells -> frozen-encoder probes. Each stage is specified with explicit equations (Eqs. 1-3 for the layout; Eq. 7 for the MAE loss; Eqs. 8-9 for the frozen embedding and 20-NN probe). The layout is fit to co-expression in a 100k-cell training subsample, which is a legitimate pretraining input, not the target result. The zero-shot annotation numbers are measurements on held-out studies under a fixed, shared probe; no parameter is fitted to the held-out labels (k=20 is set a priori). The layout ablation (OT layout vs shuffled layout vs no-encoder) is a controlled experiment, and the observed drops are empirical results, not identities enforced by the construction. The gene-program recovery reads attention through the layout, and since the layout deliberately places co-expressed genes nearby, recovering co-expressed modules is an expected consequence of the design; the paper validates these programs against external pathway databases and permutation nulls rather than presenting them as derived predictions. The only self-citation is ref. 46 (Islam & Xing, same group's cartography), used as background for OT image embeddings; the methods give the full OT equations and do not rest on that citation, so it is not load-bearing. The pretraining/reference-bank overlap concern is a potential data-leakage/correctness question, not a circularity step: the paper's equations never equate the held-out prediction to the fitted layout or to the reference-bank labels. The supplement's honest reporting of losses (e.g., cystic fibrosis to scFoundation, obstructive-nephropathy 20-NN block) further supports that the headline rankings are measured rather than forced.
Assumptions & free parameters
free parameters (7)
- HVG gene set size G = 10,816 =
10,816 Seurat-style highly variable genes
- OT gene layout T* (soft projection matrix P) =
104×104 layout, 10,816 genes
- Per-gene z-score mean/std (μg, σg) =
stored per gene
- 20-NN probe size k =
20
- Architecture hyperparameters (patch P=8, mask 0.75, ViT-B d=768/L=12/H=12, decoder 512/8/16) =
≈86M encoder params
- Attention readout budgets (top-100 genes, 200 cells/type, mean-subtracted specificity) =
100 genes, 200 cells
- scIB total weights =
0.6 bio / 0.4 batch
assumptions (5)
- domain assumption Pearson co-expression across training cells encodes biologically meaningful gene relationships
- domain assumption The 10,816 most variable genes and one pan-tissue layout suffice to represent cellular identity across all tissues
- domain assumption Present-class balanced accuracy / macro-F1 are the right decisive metrics; ROC-AUC is 'dominated by abundant classes'
- domain assumption A 20-NN cosine probe on frozen embeddings against an 87-type reference bank measures representation quality fairly
- standard math Gromov-Wasserstein OT and ViT-MAE machinery are valid as used
invented entities (2)
-
scImage (OT-rendered gene-expression image)
-
Frozen pan-tissue gene layout matrix P
Cite this review
Pith. "Pith review of A vision foundation model for single-cell biology via spatial gene cartography." pith.science (2026). https://pith.science/paper/2BIB3RN6
@misc{pith2026260714163,
  author       = {Pith},
  title        = {Pith review of: A vision foundation model for single-cell biology via spatial gene cartography},
  year         = {2026},
  howpublished = {\url{https://pith.science/paper/2BIB3RN6}},
  note         = {Machine review of arXiv:2607.14163}
}
read the original abstract
Most single-cell foundation models are adapted from language models, representing each cell as a sequence of gene tokens. This discards the relationships among genes and often the magnitude of their expression. We present scVision, a vision foundation model that instead renders each cell as a continuous image. Using optimal transport, it places genes at fixed positions on a single shared, pan-tissue layout so that co-expressed genes become spatial neighbours, turning a transcriptome into an image in which gene programs appear as local texture. We pretrain a vision transformer by masked image modelling on 72 million human cells and use the frozen encoder with no fine-tuning. In zero-shot evaluations on six independent, held-out studies, scVision is the most accurate cell-type annotator and recovers gene programs without supervision, ahead of existing foundation models and classical baselines; on multi-study integration it matches the strongest token-based model while conserving the most biological structure, without ever seeing a batch label. Permuting the gene layout with the network fixed sharply lowers accuracy, more than removing the vision transformer itself, showing that biologically meaningful position, not the network, carries the signal. By preserving expression magnitude and gene relationships, scVision reframes single-cell representation learning as a vision problem, connecting it to the mature methods of computer vision.
Figures


Figures from the paper (8 more)




Reference graph
Works this paper leans on
-
[1]
Tanay, A. & Regev, A. Scaling single-cell genomics from phenomenology to mechanism.Nature541, 331–338, DOI: 10.1038/nature21350 (2017)
-
[2]
Macosko, E. Z., Basu, A., Satija, R.et al.Highly parallel genome-wide expression profiling of individual cells using nanoliter droplets.Cell161, 1202–1214, DOI: 10.1016/j.cell.2015.05.002 (2015)
-
[3]
Klein, A. M., Mazutis, L., Akartuna, I.et al.Droplet barcoding for single-cell transcriptomics applied to embryonic stem cells.Cell161, 1187–1201, DOI: 10.1016/j.cell.2015.04.044 (2015)
-
[4]
Cao, J., Spielmann, M., Qiu, X.et al.The single-cell transcriptional landscape of mammalian organogenesis.Nature566, 496–502, DOI: 10.1038/s41586-019-0969-x (2019)
-
[5]
The Tabula Muris Consortium. Single-cell transcriptomics of 20 mouse organs creates a Tabula Muris.Nature562, 367–372, DOI: 10.1038/s41586-018-0590-4 (2018)
-
[6]
The Tabula Sapiens Consortium. The Tabula Sapiens: A multiple-organ, single-cell transcriptomic atlas of humans.Science 376, eabl4896, DOI: 10.1126/science.abl4896 (2022)
-
[7]
Tirosh, I., Izar, B., Prakadan, S. M.et al.Dissecting the multicellular ecosystem of metastatic melanoma by single-cell RNA-seq.Science352, 189–196, DOI: 10.1126/science.aad0501 (2016)
-
[8]
C.et al.An integrated cell atlas of the lung in health and disease.Nat
Sikkema, L., Ramírez-Suástegui, C., Strobl, D. C.et al.An integrated cell atlas of the lung in health and disease.Nat. Medicine29, 1563–1577, DOI: 10.1038/s41591-023-02327-2 (2023)
Show all 71 references
-
[9]
Eraslan, G., Drokhlyansky, E., Anand, S.et al.Single-nucleus cross-tissue molecular reference maps toward understanding disease gene function.Science376, eabl4290, DOI: 10.1126/science.abl4290 (2022)
2022 doi
-
[10]
Litviˇnuková, M., Talavera-López, C., Maatz, H.et al.Cells of the adult human heart.Nature588, 466–472, DOI: 10.1038/s41586-020-2797-4 (2020)
2020 doi
-
[11]
Elmentaite, R., Kumasaka, N., Roberts, K.et al.Cells of the human intestinal tract mapped across space and time.Nature 597, 250–255, DOI: 10.1038/s41586-021-03852-1 (2021). 28/54
2021 doi
-
[12]
A., Steuernagel, L., Dowsett, G
Tadross, J. A., Steuernagel, L., Dowsett, G. K. C.et al.A comprehensive spatio-cellular map of the human hypothalamus. Nature639, 708–716, DOI: 10.1038/s41586-024-08504-8 (2025)
2025 doi
-
[13]
A.et al.Single-cell multi-omics analysis of the immune response in COVID-19
Stephenson, E., Reynolds, G., Botting, R. A.et al.Single-cell multi-omics analysis of the immune response in COVID-19. Nat. Medicine27, 904–916, DOI: 10.1038/s41591-021-01329-2 (2021)
2021 doi
-
[14]
A blood atlas of COVID-19 defines hallmarks of disease severity and specificity.Cell185, 916–938, DOI: 10.1016/j.cell.2022.01.012 (2022)
COvid-19 Multi-omics Blood ATlas (COMBAT) Consortium. A blood atlas of COVID-19 defines hallmarks of disease severity and specificity.Cell185, 916–938, DOI: 10.1016/j.cell.2022.01.012 (2022)
2022 doi
-
[15]
Nature608, 174–180, DOI: 10.1038/s41586-022-04817-8 (2022)
Chaffin, M., Papangeli, I., Simonson, B.et al.Single-nucleus profiling of human dilated and hypertrophic cardiomyopathy. Nature608, 174–180, DOI: 10.1038/s41586-022-04817-8 (2022)
2022 doi
-
[16]
L., Maatz, H.et al.Pathogenic variants damage cell composition and single cell transcription in cardiomyopathies.Science377, eabo1984, DOI: 10.1126/science.abo1984 (2022)
Reichart, D., Lindberg, E. L., Maatz, H.et al.Pathogenic variants damage cell composition and single cell transcription in cardiomyopathies.Science377, eabo1984, DOI: 10.1126/science.abo1984 (2022). 17.Yazar, S., Alquicira-Hernandez, J., Wing, K.et al.Single-cell eQTL mapping ...
2022 doi
-
[18]
Yang, F., Wang, W., Wang, F.et al.scBERT as a large-scale pretrained deep language model for cell type annotation of single-cell RNA-seq data.Nat. Mach. Intell.4, 852–866, DOI: 10.1038/s42256-022-00534-z (2022)
2022 doi
-
[19]
V ., Xiao, L., Chopra, A.et al.Transfer learning enables predictions in network biology.Nature618, 616–624, DOI: 10.1038/s41586-023-06139-9 (2023)
Theodoris, C. V ., Xiao, L., Chopra, A.et al.Transfer learning enables predictions in network biology.Nature618, 616–624, DOI: 10.1038/s41586-023-06139-9 (2023)
2023 doi
-
[20]
Methods21, 1470–1480, DOI: 10.1038/s41592-024-02201-0 (2024)
Cui, H., Wang, C., Maan, H.et al.scGPT: toward building a foundation model for single-cell multi-omics using generative AI.Nat. Methods21, 1470–1480, DOI: 10.1038/s41592-024-02201-0 (2024)
2024 doi
-
[21]
Methods21, 1481–1491, DOI: 10.1038/s41592-024-02305-7 (2024)
Hao, M., Gong, J., Zeng, X.et al.Large-scale foundation model on single-cell transcriptomics.Nat. Methods21, 1481–1491, DOI: 10.1038/s41592-024-02305-7 (2024)
2024 doi
-
[22]
Rosen, Y .et al.Universal cell embedding provides a foundation model for cell biology.NatureDOI: 10.1038/ s41586-026-10689-z (2026)
2026
-
[23]
& Sontag, D
Boiarsky, R., Singh, N., Buendia, A., Getz, G. & Sontag, D. A deep dive into single-cell RNA sequencing foundation models.bioRxivDOI: 10.1101/2023.10.19.563100 (2023). Preprint
2023 doi
-
[24]
Z., Crawford, L., Amini, A
Kedzierska, K. Z., Crawford, L., Amini, A. P. & Lu, A. X. Zero-shot evaluation reveals limitations of single-cell foundation models.Genome Biol.26, 101, DOI: 10.1186/s13059-025-03574-x (2025)
2025 doi
-
[25]
& Zhao, H
Liu, T., Li, K., Wang, Y ., Li, H. & Zhao, H. Evaluating the utilities of foundation models in single-cell data analysis.Adv. Sci.13, e14490, DOI: 10.1002/advs.202514490 (2026)
2026 doi
-
[26]
27.LeCun, Y ., Bengio, Y
Schiebinger, G., Shu, J., Tabaka, M.et al.Optimal-transport analysis of single-cell gene expression identifies developmental trajectories in reprogramming.Cell176, 928–943, DOI: 10.1016/j.cell.2019.01.006 (2019). 27.LeCun, Y ., Bengio, Y . & Hinton, G. Deep learning.Nature521,...
2019 doi
-
[28]
Methods16, 1289–1296, DOI: 10.1038/s41592-019-0619-0 (2019)
Korsunsky, I., Millard, N., Fan, J.et al.Fast, sensitive and accurate integration of single-cell data with Harmony.Nat. Methods16, 1289–1296, DOI: 10.1038/s41592-019-0619-0 (2019)
2019 doi
-
[29]
B., Jordan, M
Lopez, R., Regier, J., Cole, M. B., Jordan, M. I. & Yosef, N. Deep generative modeling for single-cell transcriptomics.Nat. Methods15, 1053–1058, DOI: 10.1038/s41592-018-0229-2 (2018)
2018 doi
-
[30]
D., Büttner, M., Chaichoompu, K.et al.Benchmarking atlas-level data integration in single-cell genomics
Luecken, M. D., Büttner, M., Chaichoompu, K.et al.Benchmarking atlas-level data integration in single-cell genomics. Nat. Methods19, 41–50, DOI: 10.1038/s41592-021-01336-8 (2022)
2022 doi
-
[31]
M., Saunders, R
Replogle, J. M., Saunders, R. A., Pogson, A. N.et al.Mapping information-rich genotype-phenotype landscapes with genome-scale Perturb-seq.Cell185, 2559–2575, DOI: 10.1016/j.cell.2022.05.013 (2022)
2022 doi
-
[32]
M., Horlbeck, M
Norman, T. M., Horlbeck, M. A., Replogle, J. M.et al.Exploring genetic interaction manifolds constructed from rich single-cell phenotypes.Science365, 786–793, DOI: 10.1126/science.aax4438 (2019)
2019 doi
-
[33]
Adamson, B., Norman, T. M., Jost, M.et al.A multiplexed single-cell CRISPR screening platform enables systematic dissection of the unfolded protein response.Cell167, 1867–1882, DOI: 10.1016/j.cell.2016.11.048 (2016)
2016 doi
-
[34]
Abdulla, S., Aevermann, B., Assis, P.et al.CZ CELLxGENE Discover: a single-cell data platform for scalable exploration, analysis and modeling of aggregated data.Nucleic Acids Res.53, D886–D900, DOI: 10.1093/nar/gkae1142 (2025)
2025 doi
-
[35]
Kumar, T., Nee, K., Wei, R.et al.A spatially resolved single-cell genomic atlas of the adult human breast.Nature620, 181–191, DOI: 10.1038/s41586-023-06252-9 (2023). 29/54
2023 doi
-
[36]
D., Pensa, S., Steif, A.et al.A single-cell atlas enables mapping of homeostatic cellular shifts in the adult human breast.Nat
Reed, A. D., Pensa, S., Steif, A.et al.A single-cell atlas enables mapping of homeostatic cellular shifts in the adult human breast.Nat. Genet.56, 652–662, DOI: 10.1038/s41588-024-01688-9 (2024)
2024 doi
-
[37]
Krishna, C., DiNatale, R. G., Kuo, F.et al.Single-cell sequencing links multiregional immune landscapes and tissue-resident T cells in ccRCC to tumor topology and therapy efficacy.Cancer Cell39, 662–677, DOI: 10.1016/j.ccell.2021.03.007 (2021)
2021 doi
-
[38]
A., Thomson, Z., Phelps, I
Aldinger, K. A., Thomson, Z., Phelps, I. G.et al.Spatial and cell type transcriptional landscape of human cerebellar development.Nat. Neurosci.24, 1163–1175, DOI: 10.1038/s41593-021-00872-y (2021)
2021 doi
-
[39]
D., Shen, Y .-c., Ma, Q.et al.Cellular heterogeneity of human fallopian tubes in normal and hydrosalpinx disease states identified using scRNA-seq.Dev
Ulrich, N. D., Shen, Y .-c., Ma, Q.et al.Cellular heterogeneity of human fallopian tubes in normal and hydrosalpinx disease states identified using scRNA-seq.Dev. Cell57, 914–929, DOI: 10.1016/j.devcel.2022.02.017 (2022)
2022 doi
-
[40]
A., Angerer, P
Wolf, F. A., Angerer, P. & Theis, F. J. SCANPY: large-scale single-cell gene expression data analysis.Genome Biol.19, 15, DOI: 10.1186/s13059-017-1382-0 (2018)
2018 doi
-
[41]
J.et al.anndata: Access and store annotated data matrices.J
Virshup, I., Rybakov, S., Theis, F. J.et al.anndata: Access and store annotated data matrices.J. Open Source Softw.9, 4371, DOI: 10.21105/joss.04371 (2024)
2024 doi
-
[42]
Gromov-wasserstein distances and the metric approach to object matching.Foundations Comput
Mémoli, F. Gromov-wasserstein distances and the metric approach to object matching.Foundations Comput. Math.11, 417–487, DOI: 10.1007/s10208-011-9093-5 (2011)
2011 doi
-
[43]
& Cuturi, M
Peyré, G. & Cuturi, M. Computational optimal transport: With applications to data science.Foundations Trends Mach. Learn.11, 355–607, DOI: 10.1561/2200000073 (2019)
2019 doi
-
[44]
Sinkhorn distances: Lightspeed computation of optimal transport
Cuturi, M. Sinkhorn distances: Lightspeed computation of optimal transport. InAdvances in Neural Information Processing Systems (NeurIPS)(2013)
2013
-
[45]
Klein, D., Palla, G., Lange, M.et al.Mapping cells through time and space with moscot.Nature638, 1065–1075, DOI: 10.1038/s41586-024-08453-2 (2025)
2025 doi
-
[46]
Islam, M. T. & Xing, L. Cartography of genomic interactions enables deep analysis of single-cell expression data.Nat. Commun.14, 679, DOI: 10.1038/s41467-023-36383-6 (2023)
2023 doi
-
[47]
InProceedings of the IEEE/CVF Conference on Computer Vision and Pattern Recognition (CVPR), 16000–16009 (2022)
He, K.et al.Masked autoencoders are scalable vision learners. InProceedings of the IEEE/CVF Conference on Computer Vision and Pattern Recognition (CVPR), 16000–16009 (2022)
2022
-
[48]
InInternational Conference on Learning Representations (ICLR)(2021)
Dosovitskiy, A.et al.An image is worth 16x16 words: Transformers for image recognition at scale. InInternational Conference on Learning Representations (ICLR)(2021)
2021
-
[49]
& Hinton, G
Chen, T., Kornblith, S., Norouzi, M. & Hinton, G. A simple framework for contrastive learning of visual representations. InProceedings of the 37th International Conference on Machine Learning (ICML)(2020)
2020
-
[50]
InProceedings of the IEEE/CVF International Conference on Computer Vision (ICCV), 9650–9660 (2021)
Caron, M., Touvron, H., Misra, I.et al.Emerging properties in self-supervised vision transformers. InProceedings of the IEEE/CVF International Conference on Computer Vision (ICCV), 9650–9660 (2021)
2021
-
[51]
Oquab, M., Darcet, T., Moutakanni, T.et al.DINOv2: Learning robust visual features without supervision.Transactions on Mach. Learn. Res.(2024)
2024
-
[52]
InProceedings of the IEEE/CVF International Conference on Computer Vision (ICCV)(2021)
Liu, Z., Lin, Y ., Cao, Y .et al.Swin Transformer: Hierarchical vision transformer using shifted windows. InProceedings of the IEEE/CVF International Conference on Computer Vision (ICCV)(2021). 53.Vaswani, A.et al.Attention is all you need. InAdvances in Neural Information Pro...
2021
-
[54]
P., Liu, L.et al.Reference-based analysis of lung single-cell sequencing reveals a transitional profibrotic macrophage.Nat
Aran, D., Looney, A. P., Liu, L.et al.Reference-based analysis of lung single-cell sequencing reveals a transitional profibrotic macrophage.Nat. Immunol.20, 163–172, DOI: 10.1038/s41590-018-0276-y (2019)
2019 doi
-
[55]
B.et al.Cross-tissue immune cell analysis reveals tissue-specific features in humans.Science376, eabl5197, DOI: 10.1126/science.abl5197 (2022)
Domínguez Conde, C., Xu, C., Jarvis, L. B.et al.Cross-tissue immune cell analysis reveals tissue-specific features in humans.Science376, eabl5197, DOI: 10.1126/science.abl5197 (2022)
2022 doi
-
[56]
Y ., Yiu, A
Kiselev, V . Y ., Yiu, A. & Hemberg, M. scmap: projection of single-cell RNA-seq data across data sets.Nat. Methods15, 359–362, DOI: 10.1038/nmeth.4644 (2018)
2018 doi
-
[57]
Stuart, T., Butler, A., Hoffman, P.et al.Comprehensive integration of single-cell data.Cell177, 1888–1902, DOI: 10.1016/j.cell.2019.05.031 (2019)
1902 doi
-
[58]
Biotechnol.36, 411–420, DOI: 10.1038/nbt.4096 (2018)
Butler, A., Hoffman, P., Smibert, P.et al.Integrating single-cell transcriptomic data across different conditions, technologies, and species.Nat. Biotechnol.36, 411–420, DOI: 10.1038/nbt.4096 (2018)
2018 doi
-
[59]
Haghverdi, L., Lun, A. T. L., Morgan, M. D.et al.Batch effects in single-cell RNA-sequencing data are corrected by matching mutual nearest neighbors.Nat. Biotechnol.36, 421–427, DOI: 10.1038/nbt.4091 (2018). 30/54
2018 doi
-
[60]
& Berger, B
Hie, B., Bryson, B. & Berger, B. Efficient integration of heterogeneous single-cell transcriptomes using Scanorama.Nat. Biotechnol.37, 685–691, DOI: 10.1038/s41587-019-0113-3 (2019)
2019 doi
-
[61]
D., Miao, Z.et al.BBKNN: fast batch alignment of single cell transcriptomes.Bioinformatics36, 964–965, DOI: 10.1093/bioinformatics/btz625 (2020)
Pola´nski, K., Young, M. D., Miao, Z.et al.BBKNN: fast batch alignment of single cell transcriptomes.Bioinformatics36, 964–965, DOI: 10.1093/bioinformatics/btz625 (2020)
2020 doi
-
[62]
Xu, C., Lopez, R., Mehlman, E.et al.Probabilistic harmonization and annotation of single-cell transcriptomics data with deep generative models.Mol. Syst. Biol.17, e9620, DOI: 10.15252/msb.20209620 (2021)
2021 doi
-
[63]
D.et al.Mapping single-cell data to reference atlases by transfer learning
Lotfollahi, M., Naghipourfar, M., Luecken, M. D.et al.Mapping single-cell data to reference atlases by transfer learning. Nat. Biotechnol.40, 121–130, DOI: 10.1038/s41587-021-01001-7 (2022)
2022 doi
-
[64]
Tran, H. T. N., Ang, K. S., Chevrier, M.et al.A benchmark of batch-effect correction methods for single-cell RNA sequencing data.Genome Biol.21, 12, DOI: 10.1186/s13059-019-1850-9 (2020)
2020 doi
-
[65]
Biotechnol
Gayoso, A., Lopez, R., Xing, G.et al.A Python library for probabilistic analysis of single-cell omics data.Nat. Biotechnol. 40, 163–166, DOI: 10.1038/s41587-021-01206-w (2022). 66.Breiman, L. Random forests.Mach. Learn.45, 5–32, DOI: 10.1023/A:1010933404324 (2001)
2022 doi
-
[67]
& Guestrin, C
Chen, T. & Guestrin, C. XGBoost: A scalable tree boosting system. InProceedings of the 22nd ACM SIGKDD International Conference on Knowledge Discovery and Data Mining (KDD), 785–794, DOI: 10.1145/2939672.2939785 (2016)
2016
-
[68]
Arik, S. O. & Pfister, T. TabNet: Attentive interpretable tabular learning. InProceedings of the AAAI Conference on Artificial Intelligence, vol. 35, 6679–6687 (2021)
2021
-
[69]
Pedregosa, F., Varoquaux, G., Gramfort, A.et al.Scikit-learn: Machine learning in Python.J. Mach. Learn. Res.12, 2825–2830 (2011)
2011
-
[70]
Liberzon, A.et al.The molecular signatures database hallmark gene set collection.Cell Syst.1, 417–425, DOI: 10.1016/j.cels.2015.12.004 (2015)
2015 doi
-
[71]
K.et al.Gene set enrichment analysis: A knowledge-based approach for interpreting genome-wide expression profiles.Proc
Subramanian, A., Tamayo, P., Mootha, V . K.et al.Gene set enrichment analysis: A knowledge-based approach for interpreting genome-wide expression profiles.Proc. Natl. Acad. Sci.102, 15545–15550, DOI: 10.1073/pnas.0506580102 (2005)
2005 doi
-
[72]
Lotfollahi, M., Wolf, F. A. & Theis, F. J. scGen predicts single-cell perturbation responses.Nat. Methods16, 715–721, DOI: 10.1038/s41592-019-0494-8 (2019)
2019 doi
-
[73]
& Leskovec, J
Roohani, Y ., Huang, K. & Leskovec, J. Predicting transcriptional outcomes of novel multigene perturbations with GEARS. Nat. Biotechnol.42, 927–935, DOI: 10.1038/s41587-023-01905-6 (2024)
2024 doi
-
[74]
Lotfollahi, M., Klimovskaia Susmelj, A., De Donno, C.et al.Predicting cellular responses to complex perturbations in high-throughput screens.Mol. Syst. Biol.19, e11517, DOI: 10.15252/msb.202211517 (2023)
2023 doi
-
[75]
L., Shchukina, I., Amrute, J.et al.Single-cell transcriptomics reveals cell-type-specific diversification in human heart failure.Nat
Koenig, A. L., Shchukina, I., Amrute, J.et al.Single-cell transcriptomics reveals cell-type-specific diversification in human heart failure.Nat. Cardiovasc. Res.1, 263–280, DOI: 10.1038/s44161-022-00028-6 (2022). 31/54 Supplementary Information This supplement reports the full...
2022
Reviewed August 2, 2026 · model on record in the stance chip above.
Discussion (0). Continue with ORCID to comment.