REVIEW 2 major objections 6 minor 12 references
About 20% of LLM next-token distributions match the training corpus's empirical next-token distribution almost exactly, with agreement increasing as models scale.
Reviewed by Pith at T0; open to challenge. T0 means a machine referee read the full paper against a public rubric. the ladder, T0–T4 →
T0 review · deepseek-v4-flash
2026-08-04 01:38 UTC pith:7WAP2BCD
load-bearing objection Careful measurement study with a real but narrower-than-advertised central claim; the 20% figure is an artifact of stratified sampling, but the per-example dynamics and positional invariance are solid and worth an editor's time. the 2 major comments →
Tracing LLM Behavior to the Training Data with Empirical Next-Token Distributions
The pith
A machine-rendered reading of the paper's core claim, the machinery that carries it, and where it could break.
Core claim
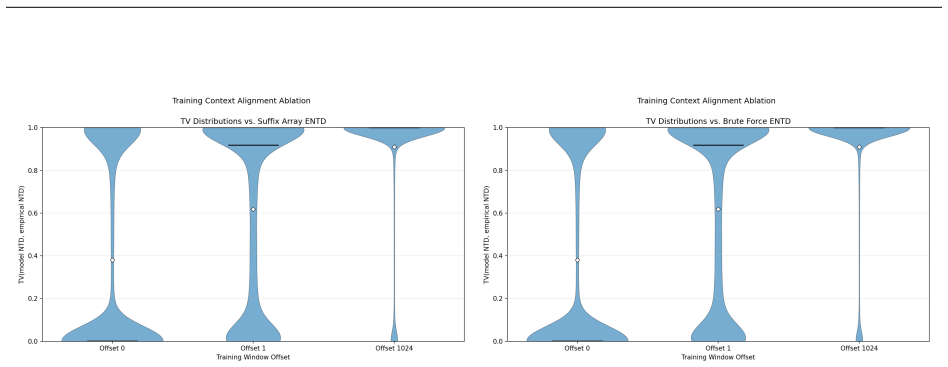
On the paper's own terms, the discovery is that a trained transformer's next-token distribution is, for a significant fraction of training-set contexts, essentially the empirical next-token distribution of the corpus—the distribution that exactly minimizes the next-token cross-entropy loss. Using total-variation distance as the metric, about 20% of a stratified evaluation sample has TV ≤ 0.0056, and the match improves with scale and compute. The paper also establishes three negative/positive results about the deviations: the match holds against the standard ENTD rather than the training-aligned variant (a positional invariance that rules out batch-alignment artifacts); a fitted rank-limited
What carries the argument
The empirical next-token distribution (ENTD), defined as count(x_{1:k+1})/count(x_{1:k}) over the training corpus. Because it is the exact global minimizer of the next-token cross-entropy loss, it is the 'memorized' target the model is trained toward; the paper measures total-variation distance between the model's output distribution and this target, and also uses a training-aligned variant (ENTD-T) and offset versions to isolate positional effects, plus a rank-limited logistic approximation to separate architectural capacity from data structure.
Load-bearing premise
The evaluation sample is stratified to give equal counts to each (context length, corpus frequency) bin, so the headline 20% near-perfect match and the tail statistics describe this balanced sample—not the natural distribution of tokens the model sees—and may not generalize to typical training tokens.
What would settle it
Take the natural (unstratified) distribution of training contexts for the largest model, or a uniformly random sample of tokens from the corpus, and compute the fraction of contexts with TV ≤ 0.0056 between the model's next-token distribution and the ENTD; if that fraction is far below 20%, the central quantitative claim is an artifact of the stratified sample rather than a property of typical inputs.
If this is right
- On training-set contexts, a substantial share of an LLM's next-token behavior is reproducible from simple corpus counts, so data curation decisions directly determine a larger part of model outputs than usually assumed.
- Because the model is positionally invariant, the standard ENTD—not the batch-aligned variant—is the correct reference distribution for studying pretraining convergence and for data-centric interpretability.
- The low-rank approximation result implies transformers systematically oversmooth the empirical distribution; architectures that preserve higher-rank logits could improve faithfulness on ambiguous contexts.
- The high-TV tail is stable at scale and predictable from data statistics (frequency, entropy, length), so troublesome contexts could be identified before training and targeted for data augmentation or architectural changes.
- Agreement increasing with compute means ENTD distance could serve as a cheap, corpus-based proxy for how well a training run has converged to the data distribution.
Where Pith is reading between the lines
- If the ENTD match continues to improve with scale, then in the limit a large enough model might be fully predictable on all frequent contexts from corpus statistics alone; a testable prediction is that the 20% figure rises monotonically on frontier-scale runs.
- The stratified sample makes the 20% figure a property of a length/frequency-balanced set, not of the natural token stream; on typical training tokens the match could be far lower, so the practical coverage of ENTD-based explanations remains an open empirical question.
- The failure on high-entropy frequent contexts is essentially a calibration problem; this suggests post-hoc calibration methods may be unable to fix such contexts, and architectural rank increases are a more direct cure.
- The same ENTD-based discrepancy decomposition could be applied to post-training phases: comparing an instruction-tuned model's deviations from the base ENTD would separate the effects of alignment from those of pretraining data.
Editorial analysis
A structured set of objections, weighed in public.
Referee Report
Summary. This paper studies the relationship between a pretrained LLM's next-token distribution and the empirical next-token distribution (ENTD) of its training corpus. Using the Pythia suite and an infinity-gram (suffix-array) counter, the authors compute ENTDs for a large, frequency-length stratified sample of training contexts and compare them to model output distributions using total variation (TV) distance. They report that 20% of this stratified sample shows near-perfect agreement (TV ≤ 0.0056) with the ENTD, that agreement improves with model scale and training compute, and that a long tail of contexts remains highly discrepant. The paper then investigates candidate sources of discrepancy: positional alignment of training contexts, the softmax bottleneck, optimization randomness, and contextual frequency/entropy. It also traces per-example TV trajectories across training.
Significance. If the findings hold, this paper offers a valuable data-centric complement to mechanistic interpretability by characterizing how model predictions relate to the empirical statistics of the training corpus. The use of public checkpoints, reproducible training data ordering, and brute-force verification of the infinity-gram index are notable strengths that increase confidence in the measurements. The per-example distributional analysis goes beyond aggregate scaling laws and reveals a more nuanced picture of LLM behavior. The paper's main contributions are likely to spur further work on data-centric interpretability. However, the interpretation of the headline result depends critically on the evaluation sampling design, as detailed below.
major comments (2)
- [Abstract, §3.2, Fig. 1] The abstract claims the LLM agrees with the ENTD 'almost perfectly' for a 'significant fraction of inputs', with Fig. 1 giving the 20% figure. This sample is constructed by equal-count stratified sampling over (occurrence-count, length) bins (§3.2). The paper itself notes that a uniformly random training sample would have at most 20/2048 ≈ 1% of contexts outside the point-mass ENTD regime; for the remaining ≥99% of natural contexts, near-perfect agreement is essentially impossible. The 20% figure is therefore a property of the balanced sample, not of the natural token stream. The abstract and introduction should qualify that the claim applies to the stratified sample, and ideally the paper should also report behavior under the natural training distribution (e.g., TV by context length) to quantify the relationship for typical training tokens. Without this, the central claim overstates the
- [§5, Fig. 4] The low-rank logit approximation is computed with a fixed rank of 2560 (the d_model of the 2.8B model) for all models. For smaller Pythia models (e.g., 70M with d_model=512, 410M with 1024, 1B with 2048), this rank exceeds the model's d_model. The softmax bottleneck constrains the logit matrix to rank at most d_model, so the rank-2560 approximation is not a valid upper bound on the bottleneck bias for those models. Consequently, the claim that 'the transformer does not take full advantage' of low-rank structure is not supported for the smaller models. The authors should either compute per-model rank limits or restrict the claim to models with d_model ≥ 2560.
minor comments (6)
- [General] Total variation distance is used throughout but never defined. Define it at first use, e.g., TV(p,q) = ½ Σ_v |p(v) − q(v)|.
- [§5] The low-rank approximation is trained on the same evaluation sample (84K examples) used for the model comparison. The paper acknowledges this asymmetry, but the phrase 'the transformer does not take full advantage of this fact' should be further tempered; the result is best described as an upper bound on the softmax-bottleneck bias, as stated at the beginning of the section.
- [§4] The 'strong positional invariance' conclusion is based on the similarity of TV distributions across offsets. This is distributional evidence; a direct comparison of model probabilities for the same content at different absolute positions would be more conclusive. The two-batch control is a useful sanity check, but the current evidence does not strictly prove that the model is positionally invariant for individual inputs.
- [§3.2] The statement that a uniform sample would contain 'a fraction of at most 20/2048 ≈ 1% of examples outside of this regime' needs a brief explanation of how the 20/2048 bound is derived, as it is not immediately obvious.
- [Fig. 1] The choice of TV ≤ 0.0056 as the threshold for 'near-perfect' agreement is arbitrary. Specify how this threshold was selected.
- [Notation] The paper uses '∞-gram' to refer to the method of Liu et al. (2024), but the reference and official name is 'Infini-gram'. Use consistent notation to avoid confusion.
Circularity Check
No significant circularity: the definitional fact that the ENTD minimizes the pretraining cross-entropy loss is used as motivation, but the paper's per-example, tail, scaling, and invariance analyses are independent empirical measurements.
full rationale
The only definitional tie is Eq. (2), where p_ENTD is defined as an empirical count ratio and then shown to be the global minimizer of the cross-entropy objective (1). This is not a circular derivation: the paper does not fit any parameter to the model and relabel it as a prediction. The central findings—fraction of inputs with TV ≤ 0.0056, the TV CDF, long-tail decomposition, scaling trends, positional invariance, optimization-variance decomposition, and the softmax-bottleneck upper bound—are computed from independent sources: Pythia/PolyPythias checkpoints and corpus counts from infini-gram, with brute-force verification in Appendix B. The stratified sampling in §3.2 is explicitly a scope choice; the manuscript states that a uniform sample would be at most ~20/2048 ≈ 1% outside the point-mass regime. This limits external validity but does not make the comparison circular. The one self-citation (Izzo et al. 2026) appears only in Related Work and is not load-bearing for any result. No fitted input is called a prediction, no uniqueness theorem is imported, and no ansatz is smuggled in via citation. The average agreement with the ENTD is acknowledged to be essentially equivalent to scaling laws, but the paper's contribution is the per-example distribution around that average, which is not determined by the training objective.
Axiom & Free-Parameter Ledger
free parameters (3)
- Stratified sampling design =
Count bins [1e0,1e1)...[1e6,∞); lengths {1,2,4,6,8,12,16,32,64}; reservoir size N=100 per (k, shard-bin); 21 shards
- Tail cutoffs for high/low TV analysis =
Top and bottom 10%
- Low-rank logit approximation factors U,W =
Not reported; rank fixed to d_model (e.g., 2560 for the 2.8B model)
axioms (6)
- standard math The empirical next-token distribution (ENTD) is the exact global minimizer of the next-token cross-entropy loss when pθ is unrestricted.
- domain assumption Suffix-array based infinity-gram counts over the full Pile are exact for arbitrary-length n-grams.
- domain assumption Stratified sampling with equal numbers per (occurrence-count, length) bin is an appropriate representation of model behavior.
- domain assumption Total variation distance between the model NTD and ENTD is a meaningful per-sample measure of agreement.
- domain assumption The Pythia dataloader batches contexts as consecutive non-overlapping chunks, with loss computed on prefixes of each chunk, so ENTD-T is the training-aligned target.
- standard math Transformer output logits have rank at most d_model (the softmax bottleneck).
invented entities (1)
-
Training-aligned empirical next-token distribution (ENTD-T)
no independent evidence
read the original abstract
In this paper, we study the connection between an LLM's output distribution and the data used to train it. Specifically, we study the degree to which an LLM's next-token distribution agrees with the empirical next-token distribution (ENTD) given the context in the training data. The ENTD is an appealing target because it is the unrestricted global minimizer of the next-token cross entropy loss used for pretraining, as well as an easily interpretable function of the pretraining corpus. We find that for a significant fraction of inputs, the LLM's distribution agrees with the ENTD almost perfectly, and the agreement generally increases with model scale and training compute. Nevertheless, there is a long tail of input sequences where the LLM and ENTD differ significantly, and we examine several possible sources of this discrepancy across the transformer architecture, training procedure, and finite-sample noise in the ENTD estimate itself. More broadly, we hope our findings will encourage more work on ``data-centric mechanistic interpretability,'' a complement to standard mechanistic interpretability that opens the black box of how model behaviors arise from the data, rather than how they are encoded in the learned weights.
Figures





Reference graph
Works this paper leans on
-
[5]
The pile: An 800gb dataset of diverse text for language modeling
Leo Gao, Stella Biderman, Sid Black, Laurence Golding, Travis Hoppe, Charles Foster, Jason Phang, Horace He, Anish Thite, Noa Nabeshima, et al. The pile: An 800gb dataset of diverse text for language modeling. arXiv preprint arXiv:2101.00027,
-
[7]
Jing Huang, Daniel Wurgaft, Rachit Bansal, Laura Ruis, Naomi Saphra, David Alvarez-Melis, Andrew Kyle Lampinen, Christopher Potts, and Ekdeep Singh Lubana. Why larger models learn more: Effects of capacity, interference, and rare-task retention.arXiv preprint arXiv:2605.29548,
-
[8]
In-context learning and induction heads.arXiv preprint arXiv:2209.11895,
Catherine Olsson, Nelson Elhage, Neel Nanda, Nicholas Joseph, Nova DasSarma, Tom Henighan, Ben Mann, Amanda Askell, Yuntao Bai, Anna Chen, et al. In-context learning and induction heads.arXiv preprint arXiv:2209.11895,
-
[9]
Backtracking mathematical reasoning of language models to the pretraining data
Yasaman Razeghi, Hamish Ivison, Sameer Singh, and Yanai Elazar. Backtracking mathematical reasoning of language models to the pretraining data. InThe Second Tiny Papers Track at ICLR 2024,
2024
-
[10]
Polypythias: Stability and outliers across fifty language model pre-training runs
Oskar Van der Wal, Pietro Lesci, Max Müller-Eberstein, Naomi Saphra, Hailey Schoelkopf, Willem Zuidema, and Stella R Biderman. Polypythias: Stability and outliers across fifty language model pre-training runs. InInternational Conference on Learning Representations, volume 2025, pp. 86180–86204,
2025
-
[2018]
Jiasheng Ye, Peiju Liu, Tianxiang Sun, Jun Zhan, Yunhua Zhou, and Xipeng Qiu
URL https://openreview.net/forum?id=HkwZSG-CZ. Jiasheng Ye, Peiju Liu, Tianxiang Sun, Jun Zhan, Yunhua Zhou, and Xipeng Qiu. Data mixing laws: Optimizing data mixtures by predicting language modeling performance. InInternational Conference on Learning Representations, volume 2025, pp. 82263–82287,
2025
-
[2020]
Roger Grosse, Juhan Bae, Cem Anil, Nelson Elhage, Alex Tamkin, Amirhossein Tajdini, Benoit Steiner, Dustin Li, Esin Durmus, Ethan Perez, et al. Studying large language model generalization with influence functions.arXiv preprint arXiv:2308.03296,
-
[2022]
Stealing part of a production language model.arXiv preprint arXiv:2403.06634,
Nicholas Carlini, Daniel Paleka, Krishnamurthy Dj Dvijotham, Thomas Steinke, Jonathan Hayase, A Feder Cooper, Katherine Lee, Matthew Jagielski, Milad Nasr, Arthur Conmy, et al. Stealing part of a production language model.arXiv preprint arXiv:2403.06634,
-
[2023]
Language contamination helps explains the cross-lingual capabilities of english pretrained models
Terra Blevins and Luke Zettlemoyer. Language contamination helps explains the cross-lingual capabilities of english pretrained models. InProceedings of the 2022 Conference on Empirical Methods in Natural Language Processing, pp. 3563–3574,
2022
-
[2024]
Pretraining data statistics shape the phases of learning entity comparison in language models
Yik Siu Chan, Jing Huang, Yanai Elazar, and Atticus Geiger. Pretraining data statistics shape the phases of learning entity comparison in language models. InMechanistic Interpretability Workshop at ICML 2026,
2026
-
[2025]
Jason Wei, Dan Garrette, Tal Linzen, and Ellie Pavlick
URL https://openreview.net/forum?id=IQxBDLmVpT. Jason Wei, Dan Garrette, Tal Linzen, and Ellie Pavlick. Frequency effects on syntactic rule learning in transformers. InProceedings of the 2021 Conference on Empirical Methods in Natural Language Processing, pp. 932–948,
2021
-
[2026]
Yanai Elazar, Nora Kassner, Shauli Ravfogel, Amir Feder, Abhilasha Ravichander, Marius Mosbach, Yonatan Belinkov, Hinrich Schütze, and Yoav Goldberg. Measuring causal effects of data statistics on language model’sfactual’predictions.arXiv preprint arXiv:2207.14251,
discussion (0)
Sign in with ORCID, Apple, or X to comment. Anyone can read and Pith papers without signing in.