REVIEW 2 major objections 4 minor 53 references
Residual habitable-zone dust, even at solar-system levels, can cut molecular absorption depths in Earth-twin spectra by up to 50%.
Reviewed by Pith at T0; open to challenge. T0 means a machine referee read the full paper against a public rubric. the ladder, T0–T4 →
T0 review · deepseek-v4-flash
2026-08-02 02:24 UTC pith:O4YKNNUA
load-bearing objection Solid, useful parameter study that turns an old qualitative worry about exozodi into concrete REC thresholds for HWO; the headline numbers are plausible but rest on a simplified smooth-continuum residual model that real subtraction residuals may not satisfy. the 2 major comments →
The exozodi spectral effect: Residual habitable zone dust may bias exoEarth characterization
The pith
A machine-rendered reading of the paper's core claim, the machinery that carries it, and where it could break.
Core claim
Residual exozodi acts as an additive continuum that flattens all molecular absorption bands; the effect worsens with wavelength (because the point-spread function collects more dust light) and with red/gray dust color. Simulating a 10-pc Earth twin in a future space observatory, 1 zodi of dust reduces visible O2 and H2O band depths by up to 50% and nearly erases the 1.6-µm CO2 band. Retrievals return O2 and H2O abundances biased low once the residual dust-to-planet flux ratio exceeds 10^-3. The stated requirement: keep residual exozodi below 10^-3 of the planet's V-band flux for abundance work; a binary detection relaxes this by an order of magnitude.
What carries the argument
The paper's central quantity is the residual exozodi contamination (REC) ratio, (F'_ez/F_p)_V—the ratio of exozodi flux left in the photometric aperture after post-processing to the planet's own V-band flux. It ties together every requirement: a given REC ratio corresponds to a required post-processing factor (PPF_ez) that divides the raw exozodi-to-planet flux ratio. The second key ingredient is the wavelength-dependent exozodi flux itself, which grows with λ because the point-spread function (and thus photometric aperture) scales as λ/D, so the same dust level contaminates longer wavelengths more. These two objects—the scalar PPF_ez and the aperture-integrated, color-dependent exozodi flux
Load-bearing premise
The whole quantitative requirement rests on modeling imperfect exozodi subtraction as a single scalar post-processing factor that leaves a smooth, wavelength-independent-in-shape continuum; if real residuals are spectrally structured or spatially clumped, the bias could be worse than predicted.
What would settle it
Re-run the retrieval pipeline on synthetic spectra where the residual exozodi is injected as a spectrally varying (e.g., correlated with the planet's absorption bands) or spatially clumped component at the same residual-to-planet flux ratio; if the abundance bias is significantly larger than the paper's smooth-continuum prediction, the 10^-3 requirement is not conservative.
If this is right
- Any direct-imaging mission that aims to measure molecular abundances in Earth-twin atmospheres must demonstrate exozodi post-processing to a residual-to-planet flux ratio below 10^-3 in the V band, a requirement independent of the system's dust level.
- Molecules with absorption bands at longer wavelengths (e.g., CO2 near 1.6 µm) will be far more degraded than short-wavelength species, so survey designs should either prioritize shorter-wavelength bands or develop long-wavelength exozodi subtraction.
- Residual exozodi creates a degeneracy with clouds: without subtraction to about one tenth of the planet's flux, cloud fraction and even planet radius retrievals become biased, potentially mischaracterizing a clear atmosphere as cloudy.
- If only a binary detection is wanted (e.g., is H2O present?), the post-processing requirement relaxes by an order of magnitude, and increasing spectral resolution from R=140 to R~1000 can relax it by a further ~30×, trading exposure time against subtraction difficulty.
Where Pith is reading between the lines
- The scalar post-processing factor model treats residuals as a smooth continuum; real subtraction residuals are likely spectrally correlated or spatially clumped near the planet, which could make the bias larger than the paper's requirement suggests—an inference, not a claim of the paper.
- Because the threshold is defined in the V band, applying these numbers to a mission that does not observe V-band, or to targets with very different dust colors, requires re-running the analysis rather than a simple rescaling.
- The paper's method—injecting synthetic exozodi into simulated spectra and retrieving—could be applied to existing debris-disk scattered-light data to empirically validate the continuum-flattening effect before any new mission flies.
- Target selection for a future Earth-characterization survey should weight exozodi density and color as heavily as stellar distance; systems with blue dust and low zodis are disproportionately favorable.
Editorial analysis
A structured set of objections, weighed in public.
Referee Report
Summary. The paper studies how residual exozodiacal dust contaminates direct spectra of habitable-zone Earth analogs observed with a Habitable Worlds Observatory-like instrument. The authors construct exozodi spectral models (gray, red, blue, and solar-system-like), add them as an unsubtracted/partially subtracted continuum to synthetic Earth spectra, and quantify the resulting reduction in molecular band depths. They then run atmospheric retrievals on synthetic HWO data with residual exozodi-to-planet flux ratios (REC ratios) from 0 to 1, and derive post-processing requirements: REC ratios below ~1e-2 preserve band depths to 1%, and below ~1e-3 are needed for unbiased abundance retrievals; binary detection relaxes the requirement by about an order of magnitude, especially at higher spectral resolution.
Significance. If the central conclusions hold, the paper identifies a first-order systematic bias for exoEarth characterization with HWO: even solar-system-level exozodi, if imperfectly subtracted, can significantly flatten molecular absorption features and bias retrieved abundances. The core physical mechanism—adding a smooth continuum to a spectrum reduces apparent absorption depth—is robust and does not depend on retrieval details. The work has concrete strengths: it uses the public pyEDITH exposure time calculator, includes zero-exozodi baseline retrievals, considers multiple dust colors and clear/cloudy atmospheres, and provides quantitative, falsifiable requirements. The main risk is that the quantitative thresholds rest on a specific parameterization of the residual exozodi as a smooth, positively-valued scalar multiple of the unsubtracted exozodi spectrum.
major comments (2)
- [§2.3.2, Eqs. (4)–(5); §3.3.3] The headline requirements (REC < 1e-3 for abundance retrieval, Fig. 6 and §5) are derived entirely from modeling the subtraction residual as C_nf,ez = C_ez/PPF_ez, a deterministic, non-negative scalar fraction of the pre-subtraction exozodi spectrum, combined linearly with the stellar leakage noise floor. Real subtraction residuals from PSF/model mismatch, clumpy dust, or chromatic errors need not be a scalar multiple of the unsubtracted exozodi; they can be spectrally structured, spatially correlated, and sign-varying. If the residual is redder than the assumed model, the V-band REC ratio understates the bias on CO2/H2O at longer wavelengths and the required PPF_ez is underestimated; if the retrieval can marginalize over a continuum or exozodi parameter (as the paper itself leaves to future work in §3.3.3), a smooth residual may be largely absorbed and the 1e-3 requirement may be too st
- [§3.3.1, Fig. 6; §3.3.3] The 1% band-depth preservation tolerance is adopted as a proxy for unbiased abundance measurement, with the validation in §3.3.3 limited to noting that retrieval degradation begins near the same REC ratio where band depths start to change. This is an indirect validation. A 1% band-depth change is neither clearly necessary nor clearly sufficient for unbiased abundances: a retrieval that marginalizes over a continuum offset may tolerate larger band-depth changes, while a correlated residual could bias abundances even when the band depth is preserved to <1%. The paper should directly quantify the mapping between band-depth error and abundance bias, for example by plotting retrieved log(f_O2), log(f_H2O) bias against REC ratio in the same figure as the band-depth curves, or by reporting the REC ratio at which the retrieved abundance departs from the truth by a specified factor.
minor comments (4)
- [§2.1] The definition of one 'zodi' as the V-band face-on brightness of solar-system zodiacal dust is fine, but the conversion from N_ez to observed flux in Fig. 1 and Fig. 6 depends on inclination (stated as 60° for Fig. 1) and aperture size. The text should state explicitly that the N_ez–PPF_ez contours in Fig. 6 assume the same 60° inclination and 0.7λ/D aperture, since these choices affect the quantitative PPF_ez requirements.
- [§3.2, Fig. 5] The CO2 panel in Fig. 5 has a very small y-axis range (0–7.5%) and the text says the CO2 band is 'challenging' to detect. This is fine, but the reader would benefit from a statement of the absolute band depth rather than only the percentage reduction, because a 50% reduction of a 5% band is less observationally significant than a 50% reduction of a 40% band.
- [§3.3.3] The retrieval setup uses the default rfast priors, which include a wide cloud parameter space. The paper reports that at REC=1e-2 the retrieval interprets the residual exozodi as a smaller planet with higher cloud fraction, but it would be useful to state whether the true planet radius and cloud fraction remain within the 1σ posterior at that REC value; this would strengthen the discussion of degeneracies.
- [general] The notation F'ez/Fp is used interchangeably with (F'ez/Fp)_V; please define the latter explicitly before the first use in §3.1 and use it consistently. Also, the two Alei et al. 2026 references in the bibliography appear to have near-identical author lists; please verify that they are distinct works and are cited appropriately.
Circularity Check
No significant circularity: the derivation is a self-contained forward-model exercise; REC thresholds are model outputs, not fitted inputs reused as predictions.
full rationale
This paper's derivation chain is forward modeling with no fitted parameter recycled as a prediction. Exozodi spectral models (gray, red, blue, and solar-system 'zodi') come from external empirical inputs (Leinert et al. 1998; Ren et al. 2023; Debes et al. 2008), and exozodi density is an assumed model parameter (N_ez), not a fitted value. Residual exozodi is parameterized as a scalar post-processing factor (Eq. 4: Cnf,ez = Cez/PPFez), and the band-depth curves (Fig. 5), REC requirements (Fig. 6), and the F'_ez/Fp = 1e-3 retrieval threshold are computed from synthetic spectra plus an independent retrieval code (rfast/emcee); the retrieved posteriors are emergent outputs. Dilution of absorption depth by an additive continuum is arithmetic given the model, but the paper presents it as a quantitative consequence rather than as a statistically fitted 'prediction,' and the headline requirements are thresholds read off those forward-model outputs. Self-citations (Currie et al. 2023; Stark et al. 2019, 2024; Alei et al. 2026 pyEDITH) provide context or describe publicly available tools with the relevant equations reproduced in the text, and no uniqueness theorem is imported from the authors' prior work to force the choice of model. The load-bearing assumptions - a scalar PPF_ez residual and no exozodi parameter in the retrieval - are explicitly flagged limitations (Sec. 2.3.2 discusses model mismatch; Sec. 3.3.3 states 'We leave these approaches open to future studies'), so if real subtraction residuals are spectrally structured the quantitative thresholds could change; that is a model-robustness concern, not circularity. Per the hard rules, no Eq. X = Eq. Y reduction or fitted-input-called-prediction can be exhibited, so the honest finding is no significant circularity.
Axiom & Free-Parameter Ledger
free parameters (4)
- Band-depth preservation tolerance =
1%
- Reference S/N setpoints =
S/N = 10 and 20 at continuum reference bins
- Photometric aperture size =
0.7 lambda/D
- Cloud fraction for cloudy Earth case =
0.5
axioms (4)
- domain assumption The HOSTS median exozodi level of ~3 zodis in nearby Sun-like systems is representative.
- domain assumption rfast radiative transfer spectra and pyEDITH ETC noise model faithfully represent HWO observations of Earth-like planets.
- ad hoc to paper Residual exozodi after post-processing is a deterministic additive continuum, parameterized by PPF_ez and combined linearly with stellar leakage noise floor (Eqs. 4-5).
- ad hoc to paper A 1% band-depth preservation tolerance is an appropriate proxy for unbiased molecular abundance measurement.
read the original abstract
All exoplanetary systems are expected to host exozodiacal dust, or exozodi, originating from planetesimals. For many stars, exozodi will likely be the largest source of astrophysical noise in direct observations of terrestrial exoplanets. Nearby Sun-like systems likely have $\gtrsim3$x more habitable zone (HZ) dust than our solar system, which must be removed from direct images and spectra to reveal exoplanet signals. The albedo of this micron-sized dust varies smoothly over VIS -- NIR wavelengths, but exozodi can be composed of different materials that can impact its color. If left unsubtracted, exozodiacal light will add cloud-like continuum emission to extracted spectra, potentially biasing characterization studies by reducing the apparent absorption depth of spectral features. To quantify these effects, we simulate exoEarth systems with a range of exozodi densities and compositions, and apply an atmospheric retrieval tool to synthetic Habitable Worlds Observatory (HWO) spectra. We find that exozodi at levels similar to the solar system (i.e., 1 zodi) can reduce the apparent depth of visible wavelength molecular absorption features by up to 50\%, an effect that worsens at longer wavelengths. To measure molecular abundances, significant post-processing may be required to remove exozodi to a fractional residual that tightens with dust density. However, targeting a binary detection result for an absorbing species instead relaxes this requirement by an order of magnitude, especially at higher spectral resolution. Understanding and mitigating the effects of exozodi in extracted exoEarth spectra is critical to characterize HZ exoplanet environments with HWO and ultimately to search for signs of habitability and life.
Figures


Reference graph
Works this paper leans on
-
[1]
National Academies of Sciences. 2021, Pathways to Discovery in Astronomy and Astrophysics for the 2020s (National Academies Press), doi: 10.17226/26141
doi:10.17226/26141 2021
-
[2]
Ahmed, Z., Shaklan, S., Currie, M. H., & D’Amico, S. 2025, JATIS, 11, 042205, doi: 10.1117/1.JATIS.11.4.042205
-
[3]
Mandell, A. M. 2026, RASTI, in prep
2026
-
[4]
M., Currie, M
Alei, E., Mandell, A. M., Currie, M. H., et al. 2026, The Astronomical Journal, 171, 228
2026
-
[5]
Arney, G., Domagal-Goldman, S. D., & Meadows, V. S. 2018, Astrobiology, 18, 311, doi: 10.1089/ast.2017.1666
arXiv 2018
-
[6]
Arney, G. N., Meadows, V. S., Domagal-Goldman, S. D., et al. 2017, ApJ, 836, 49, doi: 10.3847/1538-4357/836/1/49
-
[7]
Arnold, J. A., Weinberger, A. J., Videen, G., & Zubko, E. S. 2019, AJ, 157, 157, doi: 10.3847/1538-3881/ab095e
-
[8]
A., Bryden, G., Stapelfeldt, K
Beichman, C. A., Bryden, G., Stapelfeldt, K. R., et al. 2006, ApJ, 652, 1674, doi: 10.1086/508449
-
[9]
2024, in Space Telescopes and Instrumentation 2024: Optical, Infrared, and Millimeter Wave, Vol
Belikov, R., Stark, C., Siegler, N., et al. 2024, in Space Telescopes and Instrumentation 2024: Optical, Infrared, and Millimeter Wave, Vol. 13092, SPIE, 1999–2021, doi: 10.1117/12.3020614
-
[10]
Juanola-Parramon, R., & Meadows, V. S. 2023, AJ, 166, 197, doi: 10.3847/1538-3881/acfda7
-
[11]
H., Debes, J., Hasegawa, Y., et al
Currie, M. H., Debes, J., Hasegawa, Y., et al. 2025, arXiv preprint arXiv:2503.19932
Pith/arXiv arXiv 2025
-
[12]
2022, AJ, 163, 299, doi: 10.3847/1538-3881/ac6b97
Damiano, M., & Hu, R. 2022, AJ, 163, 299, doi: 10.3847/1538-3881/ac6b97
-
[13]
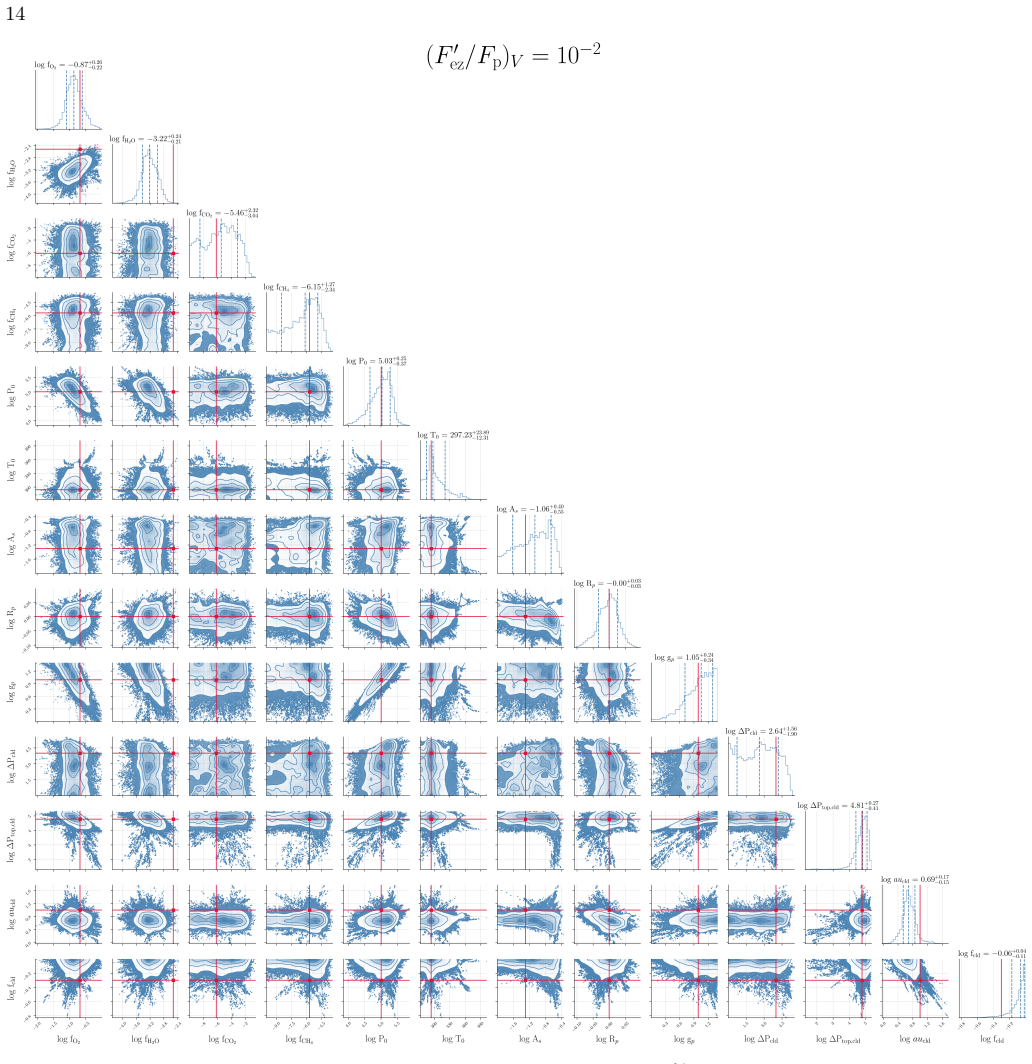
Debes, J. H., Weinberger, A. J., & Song, I. 2008, ApJ, 684, L41, doi: 10.1086/592018 14 Figure 10.Corner plot for retrieving properties of a modern Earth twin with 50% clouds at 10 pc away, with an exozodi to planet flux ratio (F ′ ez/Fp)V = 10−2. The corner plots associated with all five (F ′ ez/Fp)V cases are available in the online journal. Defr` ere, ...
-
[14]
Oschmann, Amsterdam, Netherlands, 84420M, doi: 10.1117/12.926324
-
[15]
Dermott, S. F., Jayaraman, S., Xu, Y. L., Gustafson, B. ˚A. S., & Liou, J. C. 1994, Nature, 369, 719, doi: 10.1038/369719a0
-
[16]
S., Debes, J., Mennesson, B., et al
Douglas, E. S., Debes, J., Mennesson, B., et al. 2022, PASP, 134, 024402, doi: 10.1088/1538-3873/ac3f7b
-
[17]
2020, AJ, 159, 177, doi: 10.3847/1538-3881/ab7817 15
Ertel, S., Defr` ere, D., Hinz, P., et al. 2020, AJ, 159, 177, doi: 10.3847/1538-3881/ab7817 15
-
[18]
2024, in Space Telescopes and Instrumentation 2024: Optical, Infrared, and Millimeter Wave, Vol
Feinberg, L., Ziemer, J., Ansdell, M., et al. 2024, in Space Telescopes and Instrumentation 2024: Optical, Infrared, and Millimeter Wave, Vol. 13092, SPIE, 511–522, doi: 10.1117/12.3018328
-
[19]
Foreman-Mackey, D., Hogg, D. W., Lang, D., & Goodman, J. 2013, PASP, 125, 306, doi: 10.1086/670067
doi:10.1086/670067 2013
-
[20]
Gilbert-Janizek, S., Meadows, V. S., & Lustig-Yaeger, J. 2024, PSJ, 5, 148, doi: 10.3847/PSJ/ad381e
-
[21]
Grun, E., Zook, H. A., Fechtig, H., & Giese, R. H. 1985, Icarus, 62, 244, doi: 10.1016/0019-1035(85)90121-6
-
[22]
Jackson, A., & Zook, H. A. 1989, Nature, 337, 629, doi: 10.1038/337629a0
-
[23]
2022, AJ, 164, 235, doi: 10.3847/1538-3881/ac97eb
Juanola-Parramon, R., & Nemati, B. 2022, AJ, 164, 235, doi: 10.3847/1538-3881/ac97eb
-
[24]
2025, PSJ, 6, 87, doi: 10.3847/PSJ/adbe7f
Kelkar, S., Saxena, P., Kopparapu, R., & Monteiro, J. 2025, PSJ, 6, 87, doi: 10.3847/PSJ/adbe7f
-
[25]
Kennedy, G. M., & Wyatt, M. C. 2013, MNRAS, 433, 2334, doi: 10.1093/mnras/stt900
-
[26]
Kral, Q., Krivov, A. V., Defr` ere, D., et al. 2017, AstRv, 13, 69, doi: 10.1080/21672857.2017.1353202
arXiv 2017
-
[27]
Krissansen-Totton, J., Ulses, A. G., Frissell, M., et al. 2025, arXiv preprint arXiv:2507.14771
Pith/arXiv arXiv 2025
-
[28]
Latouf, N., Mandell, A. M., Villanueva, G. L., et al. 2023, AJ, 166, 129, doi: 10.3847/1538-3881/acebc3
-
[29]
2012, A&A, 539, A17, doi: 10.1051/0004-6361/201117714
Lebreton, J., Augereau, J.-C., Thi, W.-F., et al. 2012, A&A, 539, A17, doi: 10.1051/0004-6361/201117714
-
[30]
Leinert, Ch., Bowyer, S., Haikala, L. K., et al. 1998, A&AS, 127, 1, doi: 10.1051/aas:1998105
-
[31]
2019, JOSS, 4, 1387, doi: 10.21105/joss.01387
Lustig-Yaeger, J., Robinson, T., & Arney, G. 2019, JOSS, 4, 1387, doi: 10.21105/joss.01387
-
[32]
2014, ApJ, 797, 119, doi: 10.1088/0004-637X/797/2/119
Mennesson, B., Millan-Gabet, R., Serabyn, E., et al. 2014, ApJ, 797, 119, doi: 10.1088/0004-637X/797/2/119
-
[33]
2019b, arXiv preprint arXiv:1909.02161
Mennesson, B., Bailey, V., Kasdin, J., et al. 2019b, arXiv preprint arXiv:1909.02161
Pith/arXiv arXiv 1909
-
[34]
2024, JATIS, 10, 035004, doi: 10.1117/1.JATIS.10.3.035004
Mennesson, B., Belikov, R., Por, E., et al. 2024, JATIS, 10, 035004, doi: 10.1117/1.JATIS.10.3.035004
-
[35]
2023, in Techniques and Instrumentation for Detection of Exoplanets XI, Vol
Morgan, R., Savransky, D., Damiano, M., et al. 2023, in Techniques and Instrumentation for Detection of Exoplanets XI, Vol. 12680, SPIE, 518–533, doi: 10.1117/12.2677785
-
[36]
Patel, R. I., Metchev, S. A., & Heinze, A. 2014, ApJS, 212, 10, doi: 10.1088/0067-0049/212/1/10
-
[37]
Reach, W. T., Franz, B. A., Weiland, J. L., et al. 1995, Nature, 374, 521, doi: 10.1038/374521a0
-
[38]
Redmond, S. F., Pueyo, L. A., Por, E. H., et al. 2024, JATIS, 10, 049003, doi: 10.1117/1.JATIS.10.4.049003
-
[39]
B., Rebollido, I., Choquet, ´E., et al
Ren, B. B., Rebollido, I., Choquet, ´E., et al. 2023, A&A, 672, A114, doi: 10.1051/0004-6361/202245458
-
[40]
Roberge, A., Chen, C. H., Millan-Gabet, R., et al. 2012, PASP, 124, 799, doi: 10.1086/667218
doi:10.1086/667218 2012
-
[41]
Robinson, T. D., & Salvador, A. 2023, PSJ, 4, 10, doi: 10.3847/PSJ/acac9a
-
[42]
Robinson, T. D., Stapelfeldt, K. R., & Marley, M. S. 2016, PASP, 128, 025003, doi: 10.1088/1538-3873/128/960/025003
-
[43]
Schwieterman, E. W., & Leung, M. 2024, Rev. Mineral. Geochem., 90, 465, doi: 10.2138/rmg.2024.90.13
-
[44]
Stark, C. C. 2019, JATIS, 5, 024009, doi: 10.1117/1.JATIS.5.2.024009
-
[45]
Stark, C. C., & Kuchner, M. J. 2008, ApJ, 686, 637, doi: 10.1086/591442
-
[46]
Stark, C. C., & Kuchner, M. J. 2009, ApJ, 707, 543, doi: 10.1088/0004-637X/707/1/543
-
[47]
Stark, C. C., Kuchner, M. J., & Lincowski, A. 2015, ApJ, 801, 128, doi: 10.1088/0004-637X/801/2/128
-
[48]
C., Roberge, A., Mandell, A., & Robinson, T
Stark, C. C., Roberge, A., Mandell, A., & Robinson, T. D. 2014a, ApJ, 795, 122, doi: 10.1088/0004-637X/795/2/122
-
[49]
C., Schneider, G., Weinberger, A
Stark, C. C., Schneider, G., Weinberger, A. J., et al. 2014b, ApJ, 789, 58, doi: 10.1088/0004-637X/789/1/58
-
[50]
C., Mennesson, B., Bryson, S., et al
Stark, C. C., Mennesson, B., Bryson, S., et al. 2024, JATIS, 10, 034006, doi: 10.1117/1.JATIS.10.3.034006
-
[51]
Tuchow, N. W., Stark, C. C., & Mamajek, E. 2024, AJ, 167, 139, doi: 10.3847/1538-3881/ad25ec
-
[52]
Wyatt, M. C., Pearce, T. D., Pawellek, N., et al. 2025, PASP, 137, 101001, doi: 10.1088/1538-3873/ae087b
-
[53]
Young, A. V., Robinson, T. D., Krissansen-Totton, J., et al. 2024, Nature Astron., 8, 101, doi: 10.1038/s41550-023-02145-z
discussion (0)
Sign in with ORCID, Apple, or X to comment. Anyone can read and Pith papers without signing in.