REVIEW 4 major objections 7 minor 35 references
This paper argues that temporal fidelity in synthetic sequential tabular data cannot be inferred from static or relational distribution matches, and proposes a taxonomy-guided benchmark that measures timestamp validity, cross-sectional, lon
Reviewed by Pith at T0; open to challenge. T0 means a machine referee read the full paper against a public rubric. the ladder, T0–T4 →
Static-distribution fidelity is a poor proxy for temporal fidelity in synthetic sequential tabular data; measuring timestamp, trajectory, cross-sectional, and relational structure over time changes model rankings.
T0 review reviewed 2026-08-01 challenge →
load-bearing objection A useful taxonomy-guided evaluation protocol for synthetic sequential tabular data, but the headline rank-disagreement result is weakened by an unweighted timestamp aggregate that lets backwards-time generators score near the top. the 4 major comments →
Do Generative Models Keep Time? A Time-Aware Evaluation of Synthetic Sequential Tabular Data
The pith
A machine-rendered reading of the paper's core claim, the machinery that carries it, and where it could break.
The reading
Core claim
On the paper's own terms, the central discovery is that temporal fidelity is a distinct, measurable property that is not implied by static or relational fidelity. The paper defines four fidelity dimensions—timestamp validity, cross-sectional fidelity, longitudinal fidelity, and structural consistency—and shows that they are only moderately correlated with the static-distribution scores used by prior benchmarks (mean Spearman rho 0.36 for timestamp, 0.46 for longitudinal, and 0.53 for structural; cross-sectional remains aligned at 0.82). It further observes architecture-coherent failure modes: autoregressive generators tend to preserve within-trajectory order and timestamp properties but stru
What carries the argument
The load-bearing machinery is a taxonomy-to-metric mapping. Every dataset is classified along four axes—absolute vs relative time, regular vs irregular sampling, dependent vs independent trajectories, and schema structure (single, linear, multi-child, multi-parent)—and the classification decides which of four temporal fidelity dimensions are applicable: timestamp validity (computed on raw generator output before any repair), cross-sectional fidelity (aligned time slices, only for absolute-time dependent datasets), longitudinal fidelity (within-entity dynamics), and structural fidelity (sequence length and time-varying relational cardinality). A deterministic five-stage post-processing pipeli
Load-bearing premise
The protocol's conclusions rest on the manual assignment of each dataset to the four taxonomy categories and on the metric-applicability table: if a dataset labeled 'dependent' is actually closer to independent, or a 'regular' dataset contains meaningful irregular structure, the wrong metrics get applied and the observed rank disagreements could be an artifact of the classification rather than a property of the data.
What would settle it
Re-running the benchmark with deliberately altered taxonomy labels—for example, treating a dataset classified as dependent/regular as independent/irregular, or having independent annotators assign the labels—would settle the matter. If rank disagreement between static and temporal scores persists across alternative assignments, the conclusion is robust; if it collapses or reverses, the conclusion is an artifact of the mapping.
If this is right
- A model that tops static-distribution scores can still rank last on timestamp validity, so leaderboards built on pooled distributions will systematically mis-rank generators for temporal tasks.
- Timestamp failures are not random noise: autoregressive decoding preserves order and spacing but loses control of sequence length and relational cardinality, while joint generation preserves schema structure but breaks timestamp validity; fixing one axis will require targeted architectural changes.
- Privacy conclusions change under temporal restriction: row-level nearest-neighbor metrics can overstate risk from incidental cross-time matches while missing sequential leakage that n-gram exposure detects; trajectory-aware privacy should accompany row-level numbers.
- Utility comparisons depend on how much historical context the downstream task uses; longitudinal fidelity correlates with temporal prediction performance more strongly than static fidelity, so temporal evaluation matters most when predictions are chronological.
- The protocol's sub-metric profiles allow temporal fidelity to be decomposed into distinct failure modes rather than a single score, so a generator can be strong on one axis and weak on another.
Where Pith is reading between the lines
- A diagnostic reading of the per-sub-metric tables suggests the protocol can double as a debugging tool: low grid completeness points to a model ignoring calendar support, low sequence-length similarity points to a model not conditioning on cardinality, and similar one-to-one mappings follow for each sub-metric.
- The same taxonomy could transfer to other timestamped tabular structures—sensor logs, clickstreams, clinical events—where pooled evaluation is common; the four axes are generic, though the specific metric instantiations would need validation on those domains.
- A testable extension is to ask whether the deterministic post-processing pipeline repairs temporal failures before downstream use; if repaired data recovers utility, then some observed model weaknesses are timing artifacts rather than intrinsic losses of predictive content, which would change how the rankings should be interpreted.
- Because the paper shows that cross-sectional fidelity stays aligned with static rankings, the unique value of temporal evaluation lies in timestamp, longitudinal, and structural checks; future benchmarks could focus effort there rather than re-weighting cross-sectional scores.
Editorial analysis
A structured set of objections, weighed in public.
Referee Report
Summary. The paper proposes Seq2Synth, a taxonomy-guided benchmark for evaluating temporal fidelity of synthetic sequential tabular data. Datasets are classified along four axes (time representation, sampling regularity, trajectory dependence, schema structure); this classification selects which of four fidelity dimensions are applicable: timestamp validity, cross-sectional dynamics, longitudinal/trajectory dynamics, and temporal relational structure. The protocol is instantiated on 13 datasets with 8 generative models, and the authors report that static-distribution rankings disagree substantially with temporal-aware rankings (mean Spearman 0.36–0.53 for ts/lg/st vs sd) and that failures are architecture-coherent. The central claim is that temporal fidelity cannot be reliably inferred from static or relational fidelity.
Significance. If the findings hold, the paper addresses an important gap: existing tabular benchmarks largely ignore temporal ordering, population dynamics, and trajectory-level structure. The paper’s strengths include a clearly specified taxonomy-to-metric mapping, detailed metric definitions in the appendix, a broad set of real datasets, and an explicit imputation ablation (Appendix D.2). The main empirical claim—that static-distribution rankings do not predict temporal fidelity—is plausible and would be practically valuable for model selection in sequential data. However, the evidence as presented is weakened by a miscalibrated timestamp aggregate, lack of uncertainty quantification, and sensitivity of the protocol to manual taxonomy choices and free hyperparameters.
major comments (4)
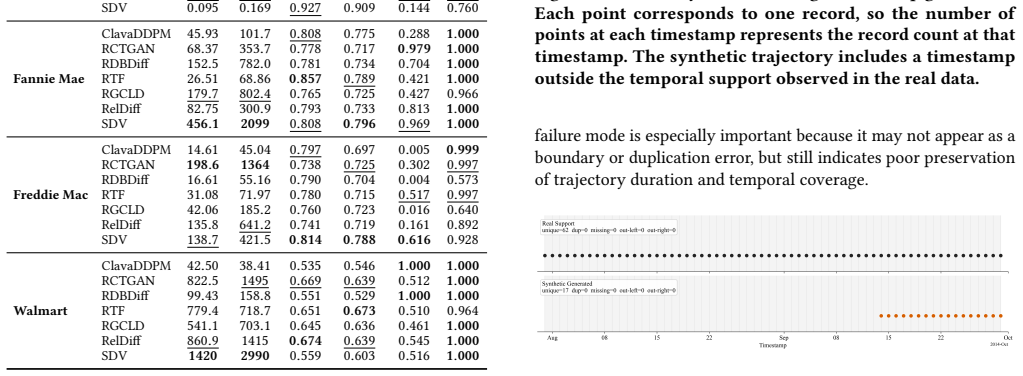
- The timestamp fidelity dimension ts is an unweighted average of six submetrics (TemporalOrderConsistency, TimestampUniqueness, TrajectoryDurationSimilarity, TemporalRangeCompliance, RegularityConsistency, GridCompleteness). On Rossmann, RTF and TabDiT have near-zero TemporalOrderConsistency (0.001 and 0.023) yet achieve the two highest ts scores (0.823 and 0.824) because the other five submetrics are near 1.0. Thus the aggregate rewards models that generate backwards timestamps—the exact failure the paper names in its motivation. The rank-disagreement evidence for sd vs ts in Table 4 may therefore be an artifact of mixing easy-to-match non-temporal timestamp properties with static features, rather than a genuine divergence between static and temporal fidelity. The protocol should treat order as a hard validity gate, or at minimum report ts with and without the order submetric, and the ra
- The paper reports no uncertainty quantification: each fidelity score, Spearman correlation, and inversion rate is a point estimate from a single run per model–dataset, with no confidence intervals, repeated generator seeds, or significance tests. With only 7–8 models per dataset, the sampling variability of Spearman’s rho is large; the observed mean correlations (0.36–0.53) may not be distinguishable from noise. The central claim that static and temporal rankings diverge relies on these correlations. The authors should provide bootstrap confidence intervals or permutation tests for the rank correlations and inversion rates, and ideally run each generator with multiple seeds to show that the reported score differences are stable.
- The protocol’s metric applicability is determined by a manual taxonomy classification (time representation, periodicity, trajectory dependence, schema). The paper does not validate this classification or test sensitivity to alternative assignments. For example, AirBnB is labeled “Rel. Irreg. Dep. Linear,” but if the trajectories are closer to independent, cross-sectional metrics may be inapplicable or misapplied. The rank-disagreement conclusions could be an artifact of the classification rather than a property of the data. The authors should report robustness checks over plausible reclassifications (e.g., varying the dependence label for borderline datasets) and show that the main findings are unchanged.
- Several metrics depend on free parameters that are set without ablation or justification: the temporal partition width B in cross-sectional metrics (Eq. 8), the regularity tolerance epsilon (Eq. 4), the autocorrelation horizon H (Eq. 18), the n-gram length n in privacy metrics, and the k-hop path length in structural metrics. The imputation ablation in Appendix D.2 is a good step, but it does not address these other choices. Since the benchmark makes comparative claims across models, the authors should either justify these defaults with experiment or discuss their sensitivity, or at minimum note the parameter values in the main text.
minor comments (7)
- The figure has repeated/overlapping panel labels (e.g., (a) and (b) appear twice), which makes it hard to follow the caption. Please redraw with unique labels.
- The ts aggregate in Table 3 includes TemporalRangeCompliance, but Table 5 omits that submetric. List all submetrics included in ts or note the omission to avoid confusion.
- The symbol T is used both for a relational dataset and for a target table, which is confusing. Use different symbols, e.g., D for the dataset and T for the table.
- The paper does not state whether code or the benchmark implementation will be released. For a benchmark paper, a reproducibility statement with code/data availability is expected.
- The “Mode” column for TT-Wasserstein is unclear; clarify what “mode” refers to and how it affects the metric’s applicability.
- The row for TimeIntervalDistributionSimilarity lists “Both Irregular” under periodicity, but the metric is defined only for irregular series. Consider simplifying the table entry.
- The imputation ablation is described as showing stability across variants, but only Rossmann and Walmart are shown. State explicitly whether the same analysis was performed on all regular-series datasets.
Circularity Check
No significant circularity; the benchmark is empirically self-contained, with only minor author-driven design choices and a metric-aggregation caveat that does not reduce the central claim to its inputs.
full rationale
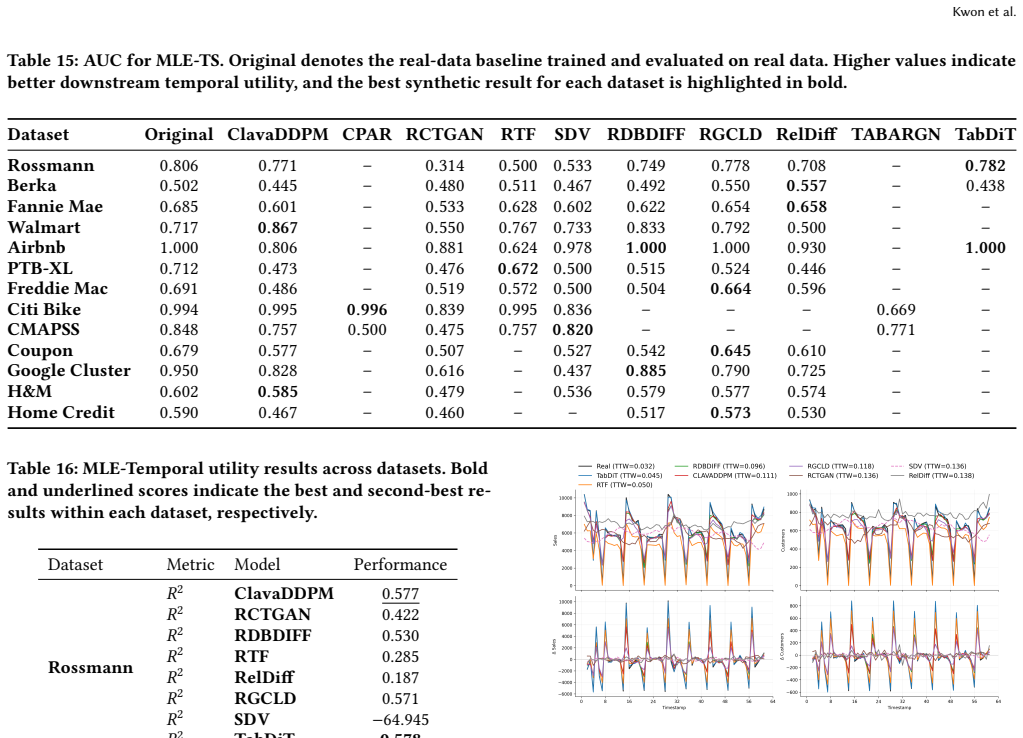
The paper is an empirical benchmark, not a derivation. The central claim—that static-distribution rankings do not reliably summarize temporal fidelity—is supported by measured rank correlations (Table 4: mean Spearman 0.36 for timestamp, 0.46 for longitudinal, 0.53 for structural; cross-sectional remains high at 0.82) computed from independently defined metrics. No parameter is fitted to a subset of data and then renamed as a prediction; no uniqueness theorem is imported; and the adopted metrics (MLD-TS, MLE-TS, SequenceLengthSimilarity, CardinalityShapeSimilarity) are cited from external work and used as stated. The taxonomy-to-metric mapping (Table 9) is author-designed, but it is not defined in terms of the target conclusion—it is a classification protocol whose applicability conditions are explicit and not circular. The only notable caveat is a validity concern, not circularity: Section 3.2 says 'Scores are aggregated within each dimension over metrics applicable to each dataset,' and Table 5 shows RTF and TabDiT with near-zero TemporalOrderConsistency (0.001 and 0.023) yet top timestamp scores (0.823 and 0.824) because four non-order submetrics average near 1.0. This could make the timestamp-based rank disagreement partly an artifact of unweighted aggregation, but the central claim also rests on longitudinal and structural rank disagreement and on submetric failure profiles, so the benchmark's conclusion is not logically forced by its own definitions. There are no load-bearing self-citations and no fitted inputs called predictions. The low score reflects only this minor design-choice dependency.
Axiom & Free-Parameter Ledger
free parameters (6)
- Cross-sectional partition B / interval width =
not reported
- Regularity tolerance epsilon =
0.01c
- Autocorrelation horizon H =
min(L/4, 50)
- n-gram length n =
3 (and 1)
- k-hop path length =
1 by default
- Data subsampling quotas =
e.g., 10,000 customers; 500 machine IDs; 1,000 ECG IDs; PTB-XL 100 timesteps
axioms (4)
- domain assumption The four taxonomy axes—time representation, periodicity, trajectory dependence, and schema structure—are exhaustive and mutually exclusive for sequential tabular data.
- ad hoc to paper The metric-applicability mapping in Table 9 is valid: e.g., cross-sectional metrics require absolute time and dependent trajectories; longitudinal metrics require regular sampling for certain variants.
- domain assumption The five-stage post-processing pipeline (sort, align, trim, dedupe, impute) does not systematically change model rankings.
- domain assumption The seven core datasets are representative enough for the rank-disagreement claim.
Cite this review
Pith. "Pith review of Do Generative Models Keep Time? A Time-Aware Evaluation of Synthetic Sequential Tabular Data." pith.science (2026). https://pith.science/paper/PWEHTJYN
@misc{pith2026260715606,
  author       = {Pith},
  title        = {Pith review of: Do Generative Models Keep Time? A Time-Aware Evaluation of Synthetic Sequential Tabular Data},
  year         = {2026},
  howpublished = {\url{https://pith.science/paper/PWEHTJYN}},
  note         = {Machine review of arXiv:2607.15606}
}
read the original abstract
Synthetic sequential tabular data are increasingly used for privacy-preserving data sharing, yet a generator can reproduce every marginal and every foreign-key relationship while emitting timestamps that run backwards or repeat, and while sending entities along paths that no real entity followed. Conventional tabular evaluation, which pools records into static distributions, is blind to such failures. We present a taxonomy-guided evaluation protocol for temporal fidelity, in which the applicable measurements are determined by the data rather than fixed in advance. Each dataset is first characterized along four properties: how time is represented, whether observations are regularly sampled, whether trajectories are mutually dependent, and how the schema links entities to their histories. These properties determine which evaluation dimensions are meaningful. The protocol then measures timestamp validity, cross-sectional structure at aligned time points, within-entity dynamics, and time-varying relational structure, and recasts utility and privacy evaluation over trajectories rather than isolated rows. We apply the protocol to eight generative models across thirteen datasets spanning six domains. Rankings under conventional evaluation disagree substantially with those obtained under temporal evaluation, and the resulting failures are architecture-coherent rather than random. Temporal fidelity must therefore be measured on the time axis itself, rather than inferred from pooled record distributions.
Figures




Reference graph
Works this paper leans on
-
[1]
Samuel A Assefa, Danial Dervovic, Mahmoud Mahfouz, Robert E Tillman, Prashant Reddy, and Manuela Veloso. 2020. Generating synthetic data in fi- nance: opportunities, challenges and pitfalls. InProceedings of the first ACM international conference on AI in finance. 1–8
2020
-
[2]
Tianqi Chen and Carlos Guestrin. 2016. Xgboost: A scalable tree boosting system. InProceedings of the 22nd acm sigkdd international conference on knowledge discovery and data mining. 785–794
2016
-
[3]
Citi Bike NYC. 2013. Citi Bike Trip History Data. https://www.kaggle.com/ datasets/sujan97/citibike-system-data Accessed via Kaggle
2013
-
[4]
DataCebo, Inc. 2020. SDMetrics: The Synthetic Data Metrics Library. https: //github.com/sdv-dev/SDMetrics
2020
-
[5]
Yuntao Du and Ninghui Li. 2025. Systematic assessment of tabular data syn- thesis. InProceedings of the 2025 ACM SIGSAC Conference on Computer and Communications Security. 2414–2428
2025
-
[6]
Fannie Mae. 2026. Single-Family Loan Performance Data. https: //capitalmarkets.fanniemae.com/credit-risk-transfer/single-family-credit-risk- transfer/fannie-mae-single-family-loan-performance-data. Updated January 30, 2026
2026
-
[7]
Freddie Mac. 2026. Single-Family Loan-Level Dataset. https://www.freddiemac. com/research/datasets/sf-loanlevel-dataset. Release 46
2026
-
[8]
Fabrizio Garuti, Enver Sangineto, Simone Luetto, Lorenzo Forni, and Rita Cuc- chiara. 2025. Diffusion Transformers for Tabular Data Time Series Generation. arXiv:2504.07566 [cs.LG] https://arxiv.org/abs/2504.07566
Pith/arXiv arXiv 2025
-
[9]
Mohamed Gueye, Yazid Attabi, and Maxime Dumas. 2023. Row Conditional- TGAN for Generating Synthetic Relational Databases. InICASSP 2023 - 2023 IEEE International Conference on Acoustics, Speech and Signal Processing (ICASSP). 1–5. doi:10.1109/ICASSP49357.2023.10096001
arXiv 2023
-
[10]
haisland0909, Shingo KATO, suharay, and Will Cukierski. 2015. Coupon Pur- chase Prediction. https://kaggle.com/competitions/coupon-purchase-prediction. Kaggle
2015
-
[11]
H&M Group. 2021. H&M Personalized Fashion Recommendations. https://www.kaggle.com/competitions/h-and-m-personalized-fashion- recommendations. Kaggle dataset
2021
-
[12]
Home Credit Group. 2018. Home Credit Default Risk Dataset. https://www. kaggle.com/competitions/home-credit-default-risk
2018
-
[13]
Valter Hudovernik. 2024. Relational Data Generation with Graph Neural Net- works and Latent Diffusion Models. InNeurIPS 2024 Third Table Representation Learning Workshop. https://openreview.net/forum?id=MNLR2NYN2Z
2024
-
[14]
Valter Hudovernik, Minkai Xu, Juntong Shi, Lovro Šubelj, Stefano Ermon, Erik Štrumbelj, and Jure Leskovec. 2025. RelDiff: Relational Data Generative Modeling with Graph-Based Diffusion Models. arXiv:2506.00710 [cs.LG] https://arxiv.org/ abs/2506.00710
Pith/arXiv arXiv 2025
-
[15]
Martin Jurkovic, Valter Hudovernik, and Erik Štrumbelj. 2025. SyntheRela: A Benchmark For Synthetic Relational Database Generation. InWill Synthetic Data Finally Solve the Data Access Problem?https://openreview.net/forum?id= ZfQofWYn6n
2025
-
[16]
Mohamed Amine Ketata, David Lüdke, Leo Schwinn, and Stephan Günnemann
-
[17]
Lautrup, Tobias Hyrup, Arthur Zimek, and Peter Schneider-Kamp
Anton D. Lautrup, Tobias Hyrup, Arthur Zimek, and Peter Schneider-Kamp
-
[18]
Zihao Li, Xiao Lin, Zhining Liu, Jiaru Zou, Ziwei Wu, Lecheng Zheng, Dongqi Fu, Yada Zhu, Hendrik Hamann, Hanghang Tong, and Jingrui He. 2026. Language in the Flow of Time: Time-Series-Paired Texts Weaved into a Unified Temporal Narrative. InThe Fourteenth International Conference on Learning Representations. https://openreview.net/forum?id=a1zBg9cBvt
2026
-
[19]
Eirini Ntoutsi, Pavlos Fafalios, Ujwal Gadiraju, Vasileios Iosifidis, Wolfgang Nejdl, Maria-Esther Vidal, Salvatore Ruggieri, Franco Turini, Symeon Papadopoulos, Emmanouil Krasanakis, et al . 2020. Bias in data-driven artificial intelligence systems—An introductory survey.Wiley Interdisciplinary Reviews: Data Mining and Knowledge Discovery10, 3 (2020), e1356
2020
-
[20]
Wei Pang, Masoumeh Shafieinejad, Lucy Liu, Stephanie Hazlewood, and Xi He
-
[21]
Neha Patki, Roy Wedge, and Kalyan Veeramachaneni. 2016. The Synthetic Data Vault. In2016 IEEE International Conference on Data Science and Advanced Analytics (DSAA). 399–410. doi:10.1109/DSAA.2016.49
-
[22]
Vamsi K Potluru, Daniel Borrajo, Andrea Coletta, Niccolò Dalmasso, Yousef El-Laham, Elizabeth Fons, Mohsen Ghassemi, Sriram Gopalakrishnan, Vikesh Gosai, Eleonora Kreačić, et al. 2023. Synthetic data applications in finance.arXiv preprint arXiv:2401.00081(2023)
Pith/arXiv arXiv 2023
-
[23]
InProceedings of the 38th International Conference on Neural Information Processing Systems(Vancouver, BC, Canada)(NIPS ’24)
ClavaDDPM: multi-relational data synthesis with cluster-guided diffusion models. InProceedings of the 38th International Conference on Neural Information Processing Systems(Vancouver, BC, Canada)(NIPS ’24). Curran Associates Inc., Red Hook, NY, USA, Article 2657, 27 pages
-
[24]
Pranav Rajpurkar, Emma Chen, Oishi Banerjee, and Eric J Topol. 2022. AI in health and medicine.Nature medicine28, 1 (2022), 31–38
2022
-
[25]
Debbie Rankin, Michaela Black, Raymond Bond, Jonathan Wallace, Maurice Mulvenna, and Gorka Epelde. 2020. Reliability of supervised machine learning using synthetic data in health care: Model to preserve privacy for data sharing. JMIR medical informatics8, 7 (2020), e18910
2020
-
[26]
Zhaozhi Qian, Rob Davis, and Mihaela van der Schaar. 2023. Synthcity: a benchmark framework for diverse use cases of tabular synthetic data. InAd- vances in Neural Information Processing Systems, A. Oh, T. Naumann, A. Glober- son, K. Saenko, M. Hardt, and S. Levine (Eds.), Vol. 36. Curran Associates, Inc., 3173–3188. https://proceedings.neurips.cc/paper_f...
2023
-
[27]
Abhinav Saxena and Kai Goebel. 2008. Turbofan Engine Degradation Simulation Data Set. NASA Prognostics Data Repository, NASA Ames Research Center. https://data.nasa.gov/dataset/cmapss-jet-engine-simulated-data Do Generative Models Keep Time? A Time-Aware Evaluation of Synthetic Sequential Tabular Data
2008
-
[28]
Aivin V. Solatorio and Olivier Dupriez. 2023. REaLTabFormer: Generating Real- istic Relational and Tabular Data using Transformers. arXiv:2302.02041 [cs.LG] https://arxiv.org/abs/2302.02041
Pith/arXiv arXiv 2023
-
[29]
Lenssen, Yiwen Yuan, Zecheng Zhang, Xinwei He, and Jure Leskovec
Joshua Robinson, Rishabh Ranjan, Weihua Hu, Kexin Huang, Jiaqi Han, Alejandro Dobles, Matthias Fey, Jan E. Lenssen, Yiwen Yuan, Zecheng Zhang, Xinwei He, and Jure Leskovec. 2024. RelBench: A Benchmark for Deep Learning on Relational Databases. InAdvances in Neural Information Processing Systems, A. Globerson, L. Mackey, D. Belgrave, A. Fan, U. Paquet, J. ...
-
[30]
Patrick Wagner, Nils Strodthoff, Ralf-Dieter Bousseljot, Wojciech Samek, and Tobias Schaeffter. 2022. PTB-XL, a large publicly available electrocardiography dataset.PhysioNet(Nov. 2022). doi:10.13026/kfzx-aw45 Version 1.0.3
-
[31]
John Wilkes. 2011. More Google cluster data. Google research blog. Posted at http://googleresearch.blogspot.com/2011/11/more-google-cluster-data.html
2011
-
[32]
Paul Tiwald, Ivona Krchova, Andrey Sidorenko, Mariana Vargas Vieyra, Mario Scriminaci, and Michael Platzer. 2025. Tabularargn: A flexible and efficient auto- regressive framework for generating high-fidelity synthetic data.arXiv preprint arXiv:2501.12012(2025)
Pith/arXiv arXiv 2025
-
[33]
Kevin Zhang, Neha Patki, and Kalyan Veeramachaneni. 2022. Sequential models in the synthetic data vault.arXiv preprint arXiv:2207.14406(2022). A Evaluation Metrics This appendix gives the operational definition of every metric used in the main paper. All metrics produce a scalar in[0, 1] unless noted otherwise;1denotes perfect fidelity. Notation follows S...
Pith/arXiv arXiv 2022
-
[2024]
Syntheval: a framework for detailed utility and privacy evaluation of tabular synthetic data.Data Mining and Knowledge Discovery39, 1 (Dec. 2024). doi:10.1007/s10618-024-01081-4
-
[2025]
https://arxiv.org/abs/2505.16527
Joint Relational Database Generation via Graph-Conditional Diffusion Models.arXiv preprint arXiv:2505.16527(2025). https://arxiv.org/abs/2505.16527
Pith/arXiv arXiv 2025
This paper was first reviewed by deepseek-v4-flash on August 1, 2026.
discussion (0)
Sign in with ORCID, Apple, or X to comment. Anyone can read and Pith papers without signing in.