REVIEW 3 major objections 4 minor 56 references
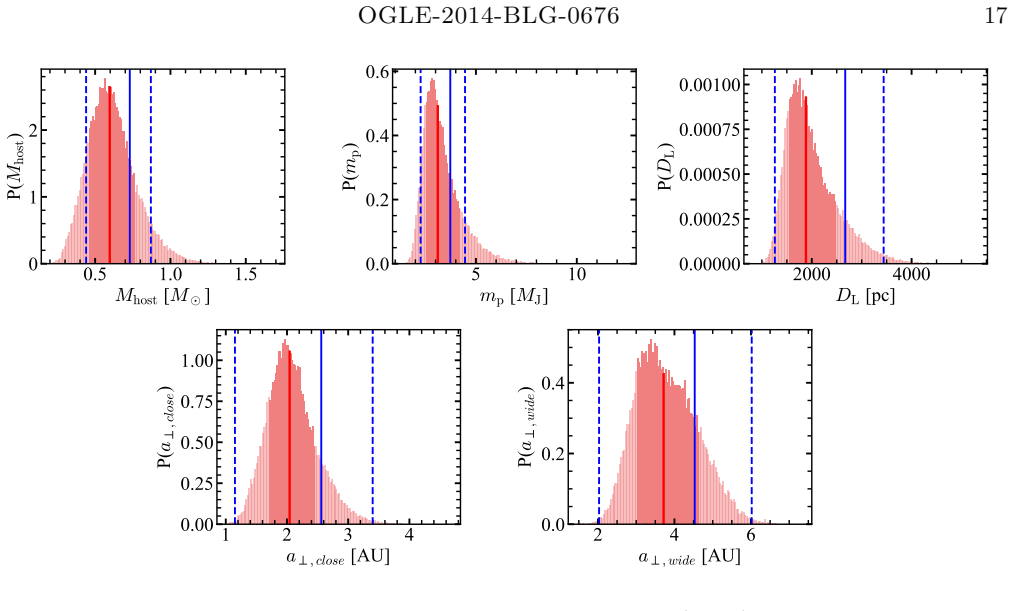
High-resolution imaging of the microlensing event OGLE-2014-BLG-0676 breaks the light-curve degeneracy and shows the system is a 3.11-Jupiter-mass planet around a 0.60-solar-mass star at 1.88 kpc.
Reviewed by Pith at T0; open to challenge. T0 means a machine referee read the full paper against a public rubric. the ladder, T0–T4 →
Keck imaging resolves the lens and source of OGLE-2014-BLG-0676 and, when folded into the light-curve fit, gives a 0.60-solar-mass host at 1.88 kpc with a 3.11-Jupiter-mass planet.
T0 review reviewed 2026-08-01 challenge →
load-bearing objection The Keck-constrained fit is not actually consistent with the Keck data — χ²_Keck ≈ 27–34 for 4 constraints is a ~5σ problem the paper never acknowledges. the 3 major comments →
Characterizing Microlensing Planetary System OGLE-2014-BLG-0676L with High-Resolution Image Constrained Light Curve Modeling
The pith
A machine-rendered reading of the paper's core claim, the machinery that carries it, and where it could break.
The reading
Core claim
Incorporating the resolved-lens measurements—the lens's K-band magnitude, the source's K-band magnitude, and the lens–source relative proper motion—directly into the microlensing light-curve modeling removes the degeneracy that plagued earlier fits. The imaging data show the K-band source flux is 0.52 magnitudes brighter than predicted by the previous model and the relative proper motion is about 6 mas/yr, larger than the roughly 4 mas/yr assumed. With these constraints added as a penalty term to the fit, the best-fit Einstein timescale shortens from about 100–130 days to about 90 days, and the resulting physical parameters are a host mass of 0.60+0.17−0.14 solar masses, a lens distance of 1
What carries the argument
The central mechanism is image-constrained light-curve modeling: a combined chi-square (χ²_total = χ²_lc + χ²_Keck) that penalizes light-curve models whose predicted source flux, lens flux, and geocentric relative proper motion disagree with the measured resolved-imaging values. The lens-flux prediction uses an empirical main-sequence mass–luminosity relation, while the proper-motion constraint converts the measured heliocentric separation into the geocentric frame used by the light-curve model. This combined penalty breaks the Einstein-timescale/source-flux degeneracy that left the earlier model biased.
Load-bearing premise
The central claim rests on the assumption that the brighter resolved component is the lens and that it is a single main-sequence star following the adopted mass–luminosity relation; if the lens is a white dwarf, an unresolved binary, or the adopted extinction values are incorrect, the derived host mass and distance would not hold.
What would settle it
A future high-resolution observation of this field that measures the lens and source in multiple near-infrared bands: if the lens appears more than ~1 magnitude fainter than predicted for a 0.6-solar-mass main-sequence star at 1.88 kpc (K_L ≈ 16.7), or if the source flux is inconsistent with the model's prediction, the claimed mass and distance would be refuted.
If this is right
- The system is a 3.11-Jupiter-mass planet around a 0.60-solar-mass M/K dwarf, a benchmark for planet formation around low-mass stars.
- The earlier 100–130 day timescale solution is disfavored; the true timescale is about 90 days, showing that sparsely covered light-curve wings can bias t_E when blending is unconstrained.
- Resolving the lens and source directly eliminates the need to assume that unresolved blended light originates from the lens, a simplification earlier work was forced to make.
- The image-constrained fits shrink the uncertainties on host mass, planet mass, distance, and separation compared with Bayesian-only or unresolved-imaging analyses.
- Future survey observations of this field can confirm the predicted lens and source magnitudes and separation, and refine the parameters with multi-band photometry.
Where Pith is reading between the lines
- The same approach can be applied to other microlensing events with archival or future high-resolution follow-up imaging, potentially revising published planet masses where light-curve-only models are degenerate.
- The quoted masses are conditional on the resolved brighter star being a single main-sequence lens; if it is a white dwarf or unresolved binary, the mass–distance relation shifts and the host mass and distance would change.
- A second epoch of high-resolution imaging would directly test the predicted relative proper motion and check for a bound companion, the main remaining alternative interpretation.
- The 0.52-magnitude source-flux discrepancy implies that other parameters derived from the same light-curve data set (e.g., the angular Einstein radius) may also carry hidden biases that resolved imaging can expose.
Editorial analysis
A structured set of objections, weighed in public.
Referee Report
Summary. The paper reanalyzes the planetary microlensing event OGLE-2014-BLG-0676 by combining Keck/OSIRIS adaptive-optics imaging obtained 6.3 years after the event with MOA, OGLE, and Wise light-curve modeling. The authors resolve the lens and source, measure their K-band magnitudes and relative proper motion, and add these measurements as chi-square constraints in an MCMC light-curve fit. Their adopted solution gives a host mass M_host = 0.60^{+0.17}_{-0.14} Msun, lens distance D_L = 1.88^{+0.63}_{-0.35} kpc, and planet mass m_p = 3.11^{+1.11}_{-0.63} MJ, and they argue that the previous longer-timescale solution was biased. They also predict separation and magnitudes for future Roman observations.
Significance. If the measurement is correct, the paper is a valuable demonstration of how high-resolution imaging can break light-curve degeneracies in planetary microlensing events. The direct resolution of lens and source, the careful PSF modeling, the jackknife treatment of frame-to-frame systematics, and the concrete Roman predictions are genuine strengths. The central claim, however, is not supported by the model's own reported chi-square values: the Keck constraints are jointly inconsistent with the light-curve model at the 4-5 sigma level, and the prior on the source distance appears to have been calibrated using the same Keck data that later enter the likelihood. The headline masses and distances therefore cannot be considered robust at the claimed confidence without a substantial revision of the treatment of the imaging constraints.
major comments (3)
- [Table 4, Eq. (11)-(12)] The reported chi-square values for the Keck constraints are chi2_Keck = 27.4-34.0 for four measurements (K_S, K_L, mu_rel,HN, mu_rel,HE). With 4 degrees of freedom, these correspond to p ~ 1e-5 to 1e-7 (about 4-5 sigma), meaning the light-curve model and the Keck imaging are not simultaneously consistent. The paper does not discuss this tension, and the 'd.o.f.' column in Table 4 includes only the light-curve data points, not the Keck terms. This directly undermines the claim in Sections 6.2-6.3 that the solution is 'self-consistent' and 'physically reliable'. The authors should report the p-value of chi2_Keck, identify which constraint(s) dominate the discrepancy, and either propagate the tension into the parameter uncertainties or correct the systematic error budget in the Keck measurements.
- [Section 4.2.1] The prior on the source distance is described as 'constructed using a Galactic model implemented via genulens, and calibrated to be consistent with the observational constraints from the Keck image analysis, as described in Section 3.' If this means the D_S prior was adjusted to match the same Keck measurements that are later used in chi2_Keck, then the imaging information is used twice, biasing the posterior and artificially narrowing the quoted uncertainties. This is a load-bearing circularity. The authors must either demonstrate that the D_S prior was derived from the Galactic model alone, or re-run the fit with a prior that is not informed by the Keck data.
- [Sections 3 and 4.2.2, Eqs. (3)-(5), (8)-(9)] The derived lens mass and distance depend on converting the measured K-band lens brightness to a mass through a main-sequence mass-luminosity relation, and on the adopted extinction values A_K,rc = 0.37 and A_I,rc = 2.50. The paper acknowledges that a white-dwarf lens cannot be entirely excluded, but it does not propagate this as an alternative model. Given that the Keck constraints are already in tension with the light curve, the mass-luminosity and extinction assumptions are plausible sources of the discrepancy. The authors should provide a sensitivity analysis that allows the lens to be a white dwarf (or an unresolved binary) and that varies the extinction parameters over their full ranges, and show how the resulting M_L-D_L posteriors change.
minor comments (4)
- [Equations (6)-(7)] The photometric transformations in Eqs. (6)-(7) need a clearer statement of the photometric systems and the covariance among the coefficients. The presence of the -1.00+/-0.29 mag offset in Eq. (7) is large and should be justified explicitly.
- [Section 3 and Table 2] In Section 3 the lens brightness is quoted as K_L = 16.98 +/- 0.05 mag, while Table 2 lists K_L = 16.982 +/- 0.080 mag. The uncertainty differs; please reconcile the two values.
- [Table 4] The 'MCMC Averages' column appears to contain two entries for several parameters (e.g., s and alpha) within a single cell. This makes the table difficult to read; separate the close and wide values into distinct rows or columns.
- [Section 2.1] The text says the adopted pixel scale is 10 mas/pixel while the measured scale is 9.952 mas/pixel, and that 'the difference does not affect our result.' Given that the measured separations are at the few-mas level, a brief quantitative statement of the resulting shift would be useful.
Circularity Check
D_S prior is calibrated to the same Keck constraints used as likelihood, double-counting the imaging data.
specific steps
-
self definitional
[Section 4.2.1 (Source Flux), D_S prior sentence]
"The prior distribution for D_S was constructed using a Galactic model implemented via genulens (Koshimoto & Ranc 2022), and calibrated to be consistent with the observational constraints from the Keck image analysis, as described in Section 3. The D_S prior is 8.2±0.6 kpc..."
D_S is an MCMC parameter that enters the model-predicted Keck observables: the source K-band magnitude (via the I→K main-sequence conversion) and the geocentric proper-motion conversion, and it sets D_L through Eq. (9). Calibrating the D_S prior to the Keck measurements and then applying the same measurements as χ2_Keck in Eq. (11) uses the imaging data twice. The posterior agreement with Keck is therefore partly enforced by construction, so the quoted D_L (and the claimed 'confirmation' of the solution) is not an independent outcome of the joint fit.
full rationale
The main derivation is a joint fit: Keck measurements of K_S, K_L, and μ_rel,H enter a penalty term χ2_Keck alongside the light curve, and the final masses/distances are posterior medians, not first-principles predictions. That in itself is legitimate data use. The one circular element is the D_S prior: the text says it was 'calibrated to be consistent with the observational constraints from the Keck image analysis,' and D_S feeds the model-predicted source K magnitude, the geocentric proper-motion conversion, and Eq. (9) for D_L. This double-counts the Keck data (also used in χ2_Keck) and means the reported agreement with Keck is partly built into the prior rather than demonstrated. Section 5's reference to 'incorporating the Keck-derived priors' reinforces this reading. The effect is partial: M_host = θ_E/(κπ_E) (Eq. 8) does not directly depend on D_S, so the central mass and planet mass retain independent light-curve content. The large χ2_Keck = 27–34 for 4 dof is a correctness/tension concern, not a circularity, and is not scored here. No other load-bearing self-citation or definitional circularity was found.
Axiom & Free-Parameter Ledger
free parameters (6)
- D_S (source distance) =
8.07 +0.48/-0.58 kpc (median)
- t_E (Einstein timescale) =
88.9 +10.7/-10.4 days (MCMC average)
- q (planet-to-host mass ratio) =
5.17e-3 (MCMC average)
- rho (normalized source radius) =
2.96e-4 (MCMC average)
- pi_EE, pi_EN (microlensing parallax components) =
pi_EE=-0.205, pi_EN=0.206 (MCMC averages)
- Other binary-lens parameters (t0, u0, s, alpha) =
See Table 4 for close/wide and +/-u0 solutions
axioms (7)
- domain assumption The main-sequence mass-luminosity relation of Bennett et al. (2015) applies to both the lens and the source.
- domain assumption The extinction model and adopted parameters (h_dust=164 pc, A_K,rc=0.37 mag, A_I,rc=2.50 mag, D_rc=8166 pc) are correct.
- domain assumption The empirical OGLE/MOA color relations (Eqs. 6 and 7) transfer source flux to the K band accurately.
- domain assumption The brighter resolved component is the lens and the fainter is the source.
- domain assumption The Boyajian et al. (2014) relation gives the source angular radius theta_star.
- ad hoc to paper The D_S prior is independent of the Keck imaging constraints.
- domain assumption No unrelated field star or bound companion lies within roughly 20 mas of the lens/source position.
Cite this review
Pith. "Pith review of Characterizing Microlensing Planetary System OGLE-2014-BLG-0676L with High-Resolution Image Constrained Light Curve Modeling." pith.science (2026). https://pith.science/paper/H26JFKBE
@misc{pith2026260718408,
  author       = {Pith},
  title        = {Pith review of: Characterizing Microlensing Planetary System OGLE-2014-BLG-0676L with High-Resolution Image Constrained Light Curve Modeling},
  year         = {2026},
  howpublished = {\url{https://pith.science/paper/H26JFKBE}},
  note         = {Machine review of arXiv:2607.18408}
}
abstract
We present an analysis that incorporates high-resolution Keck adaptive optics (AO) imaging into microlensing light-curve modeling for the planetary microlensing event OGLE-2014-BLG-0676. Using Keck AO observations obtained 6.3 years after the event, we directly resolved the lens and source. The Keck images reveal a tension, in that the $K$-band source flux is $0.52 \pm 0.22$ magnitudes brighter than predicted by previously reported light-curve models. By incorporating the Keck imaging constraints into the light-curve modeling, we find a host star mass of $M_{\rm host} = 0.60^{+0.17}_{-0.14}\,M_{\odot}$, a lens distance of $D_{\rm L} = 1.88^{+0.63}_{-0.35}$ kpc, a planet mass of $m_{\rm p} = 3.11^{+1.11}_{-0.63}\,M_{\rm J}$, and a projected separation of $a_{\perp} = 2.04^{+0.44}_{-0.35}$ au and $a_{\perp} = 3.72^{+0.92}_{-0.72}$ au for the close and wide solution, respectively. These results demonstrate the power of combining high-angular-resolution imaging with microlensing light-curve modeling to mitigate potential systematic effects and modeling degeneracies, enabling robust determinations of the physical properties of microlensing planetary systems. The results presented here can be confirmed by future observations from the \textit{Roman}'s Galactic Plane Survey.
Figures


Reference graph
Works this paper leans on
-
[1]
L., Chen, X., Ciardi, D., et al.\ 2013, , 125, 930, 989
Akeson, R. L., Chen, X., Ciardi, D., et al.\ 2013, , 125, 930, 989. doi:10.1086/672273
doi:10.1086/672273 2013
-
[2]
P., et al.\ 2015, , 808, 2, 170
Batista, V., Beaulieu, J.-P., Bennett, D. P., et al.\ 2015, , 808, 2, 170. doi:10.1088/0004-637X/808/2/170
-
[3]
Bennett, D. P. & Rhie, S. H.\ 1996, , 472, 660. doi:10.1086/178096
doi:10.1086/178096 1996
-
[4]
Bennett, D. P., Anderson, J., & Gaudi, B. S.\ 2007, , 660, 1, 781. doi:10.1086/513013
doi:10.1086/513013 2007
-
[5]
Bennett, D. P., Sumi, T., Bond, I. A., et al.\ 2012, , 757, 2, 119. doi:10.1088/0004-637X/757/2/119
-
[6]
Bennett, D. P., Batista, V., Bond, I. A., et al.\ 2014, , 785, 2, 155. doi:10.1088/0004-637X/785/2/155
-
[7]
P., Bhattacharya, A., Anderson, J., et al.\ 2015, , 808, 169
Bennett, D. P., Bhattacharya, A., Anderson, J., et al.\ 2015, , 808, 169. doi:10.1088/0004-637X/808/2/169
-
[8]
P., Bhattacharya, A., Beaulieu, J.-P., et al.\ 2020, , 159, 2, 68
Bennett, D. P., Bhattacharya, A., Beaulieu, J.-P., et al.\ 2020, , 159, 2, 68. doi:10.3847/1538-3881/ab6212
-
[9]
P., Bhattacharya, A., Beaulieu, J.-P., et al.\ 2024, , 168, 15
Bennett, D. P., Bhattacharya, A., Beaulieu, J.-P., et al.\ 2024, , 168, 15. doi:10.3847/1538-3881/ad4880
-
[10]
P., et al.\ 2018, , 156, 6, 289
Bhattacharya, A., Beaulieu, J.-P., Bennett, D. P., et al.\ 2018, , 156, 6, 289. doi:10.3847/1538-3881/aaed46
-
[11]
Bhattacharya, A., Bennett, D. P., Beaulieu, J. P., et al.\ 2021, , 162, 2, 60. doi:10.3847/1538-3881/abfec5
-
[12]
Blackman, J. W., Beaulieu, J. P., Bennett, D. P., et al.\ 2021, , 598, 7880, 272. doi:10.1038/s41586-021-03869-6
-
[13]
Bond, I. A., Abe, F., Dodd, R. J., et al.\ 2001, , 327, 3, 868. doi:10.1046/j.1365-8711.2001.04776.x
arXiv 2001
-
[14]
Bond, I. A., Bennett, D. P., Sumi, T., et al.\ 2017, , 469, 2, 2434. doi:10.1093/mnras/stx1049
-
[15]
S., van Belle, G., & von Braun, K.\ 2014, , 147, 47
Boyajian, T. S., van Belle, G., & von Braun, K.\ 2014, , 147, 47. doi:10.1088/0004-6256/147/3/47
-
[16]
Cassan, A., Kubas, D., Beaulieu, J.-P., et al.\ 2012, , 481, 7380, 167. doi:10.1038/nature10684
-
[17]
doi:10.48550/arXiv.astro-ph/0010586
Delfosse, X., Forveille, T., S \'e gransan, D., et al.\ 2000, , 364, 217. doi:10.48550/arXiv.astro-ph/0010586
-
[18]
doi:10.1088/0004-637X/695/2/970
Dong, S., Gould, A., Udalski, A., et al.\ 2009, , 695, 2, 970. doi:10.1088/0004-637X/695/2/970
-
[19]
W., Lang, D., et al.\ 2013, , 125, 306
Foreman-Mackey, D., Hogg, D. W., Lang, D., et al.\ 2013, , 125, 306. doi:10.1086/670067
doi:10.1086/670067 2013
-
[20]
Freeman, M. S. R., Lu, J. R., Lyke, J., et al.\ 2023, , 166, 3, 125. doi:10.3847/1538-3881/aceaf7
-
[21]
doi:10.1088/0004-637X/779/2/91
Furusawa, K., Udalski, A., Sumi, T., et al.\ 2013, , 779, 2, 91. doi:10.1088/0004-637X/779/2/91
-
[22]
Galactic Plane Survey Definition Committee, R.\ 2025, , arXiv:2511.07494. doi:10.48550/arXiv.2511.07494
- [23]
-
[24]
Gould, A. & Loeb, A.\ 1992, , 396, 104. doi:10.1086/171700
doi:10.1086/171700 1992
-
[25]
Henry, T. J. & McCarthy, D. W.\ 1993, , 106, 773. doi:10.1086/116685
doi:10.1086/116685 1993
-
[26]
Henry, T. J., Franz, O. G., Wasserman, L. H., et al.\ 1999, , 512, 864. doi:10.1086/306793
doi:10.1086/306793 1999
-
[27]
P., Suzuki, D., et al.\ 2021, , 918, 1, L8
Koshimoto, N., Bennett, D. P., Suzuki, D., et al.\ 2021, , 918, 1, L8. doi:10.3847/2041-8213/ac17ec
-
[28]
Koshimoto, N., Baba, J., & Bennett, D. P.\ 2021, , 917, 78. doi:10.3847/1538-4357/ac07a8
-
[29]
& Ranc, C.\ 2022, Zenodo.4784948
Koshimoto, N. & Ranc, C.\ 2022, Zenodo.4784948. doi:10.5281/zenodo.4784948
-
[30]
Lu, J.\ 2022, Zenodo
2022
-
[31]
& Paczynski, B.\ 1991, , 374, L37
Mao, S. & Paczynski, B.\ 1991, , 374, L37. doi:10.1086/186066
doi:10.1086/186066 1991
-
[32]
NASA Exoplanet Archive . 2020, Planetary Systems, Version: 2025-02-03 14:20, IPAC, doi:10.26133/NEA12 https://doi.org/10.26133/NEA12
doi:10.26133/nea12 2020
-
[33]
M., Gould, A., Fouqu \'e , P., et al.\ 2013, , 769, 88
Nataf, D. M., Gould, A., Fouqu \'e , P., et al.\ 2013, , 769, 88. doi:10.1088/0004-637X/769/2/88
-
[34]
Nunota, K., Koshimoto, N., Suzuki, D., et al.\ 2024, , 967, 2, 77. doi:10.3847/1538-4357/ad3cdc
-
[35]
& Community Survey Definition Committees, C.\ 2025, , arXiv:2505.10574
Observations Time Allocation Committee, R. & Community Survey Definition Committees, C.\ 2025, , arXiv:2505.10574. doi:10.48550/arXiv.2505
-
[36]
H.\ 1949, Ann
Quenouille, M. H.\ 1949, Ann. Math. Stat., 20, 355
1949
-
[37]
H.\ 1956, Biometrika, 43, 353
Quenouille, M. H.\ 1956, Biometrika, 43, 353
1956
-
[38]
Rattenbury, N. J., Bennett, D. P., Sumi, T., et al.\ 2017, , 466, 2710. doi:10.1093/mnras/stw3185
-
[39]
Spergel, D., Gehrels, N., Baltay, C., et al.\ 2015, , arXiv:1503.03757. doi:10.48550/arXiv.1503.03757
- [40]
-
[41]
A., et al.\ 2003, , 591, 1, 204
Sumi, T., Abe, F., Bond, I. A., et al.\ 2003, , 591, 1, 204. doi:10.1086/375212
doi:10.1086/375212 2003
-
[42]
Sumi, T., Bennett, D. P., Bond, I. A., et al.\ 2010, , 710, 2, 1641. doi:10.1088/0004-637X/710/2/1641
-
[43]
P., Sumi, T., et al.\ 2016, , 833, 2, 145
Suzuki, D., Bennett, D. P., Sumi, T., et al.\ 2016, , 833, 2, 145. doi:10.3847/1538-4357/833/2/145
-
[44]
K., Udalski, A., Soszy \'n ski, I., et al.\ 2011, , 61, 2, 83
Szyma \'n ski, M. K., Udalski, A., Soszy \'n ski, I., et al.\ 2011, , 61, 2, 83. doi:10.48550/arXiv.1107.4008
-
[45]
K., Bhattacharya, A., Bennett, D
Terry, S. K., Bhattacharya, A., Bennett, D. P., et al.\ 2021, , 161, 2, 54. doi:10.3847/1538-3881/abcc60
-
[46]
K., Beaulieu, J.-P., Bennett, D
Terry, S. K., Beaulieu, J.-P., Bennett, D. P., et al.\ 2024, , 168, 2, 72. doi:10.3847/1538-3881/
-
[47]
K., Bachelet, E., Zohrabi, F., et al.\ 2025, , arXiv:2510.13974
Terry, S. K., Bachelet, E., Zohrabi, F., et al.\ 2025, , arXiv:2510.13974. doi:10.48550/arXiv.2510.13974
-
[48]
Med., 18, 2507
Tierney, L., & Mira, A.\ 1999, Stat. Med., 18, 2507
1999
-
[49]
W.\ 1958, Ann
Tukey, J. W.\ 1958, Ann. Math. Stat., 29, 614
1958
-
[50]
K., & Szyma \'n ski, G.\ 2015, , 65, 1, 1
Udalski, A., Szyma \'n ski, M. K., & Szyma \'n ski, G.\ 2015, , 65, 1, 1. doi:10.48550/arXiv.1504.05966
-
[51]
P., Beaulieu, J.-P., et al.\ 2020, , 160, 3, 121
Vandorou, A., Bennett, D. P., Beaulieu, J.-P., et al.\ 2020, , 160, 3, 121. doi:10.3847/1538-3881/aba2d3
-
[52]
& Chen, X.\ 2019, , 877, 2, 116
Wang, S. & Chen, X.\ 2019, , 877, 2, 116. doi:10.3847/1538-4357/ab1c61
-
[53]
Witt, H. J. & Mao, S.\ 1994, , 430, 505. doi:10.1086/174426
doi:10.1086/174426 1994
-
[54]
Xie, X.-J., Dong, S., Shvartzvald, Y., et al.\ 2021, Research in Astronomy and Astrophysics, 21, 303. doi:10.1088/1674-4527/ac2a09
-
[55]
Zang, W., Jung, Y. K., Yee, J. C., et al.\ 2025, Science, 388, 6745, 400. doi:10.1126/science.adn6088
-
[56]
doi:10.1038/s41550-024-02375-9
Zhang, K., Zang, W., El-Badry, K., et al.\ 2024, Nature Astronomy, 8, 1575. doi:10.1038/s41550-024-02375-9
This paper was first reviewed by deepseek-v4-flash on August 1, 2026.
discussion (0)
Sign in with ORCID, Apple, or X to comment. Anyone can read and Pith papers without signing in.