REVIEW 3 major objections 7 minor 1 cited by
Nancy Grace Roman Space Telescope Wide Field Instrument: Bright Point Source Saturation Response and Persistence Properties from Thermal-Vacuum Testing
T0 review · 3 major / 7 minor · reviewed 2026-08-01 · deepseek-v4-flash
Pith's one-line read Deeply saturated bright stars in Roman survey fields will create large masked regions and short-lived persistence, with a 4th-magnitude source engulfing ~150 pixels in a ~170 s exposure and persistence fading to background within ~20 minute
desk verdict A careful, much-needed measurement of Roman WFI deep point-source saturation and persistence; the 20-minute persistence decay is solid, but the 150-pixel saturation diameter carries an unquantified SORC-to-flight transfer caveat. read the letter →
The pith
A machine-rendered reading of the paper's core claim, the machinery that carries it, and where it could break.
The reading
What carries the argument
The analysis rests on a 56-frame up-the-ramp exposure sequence (reset frame plus 55 science frames) corrected with the IRRC reference correction, superbias subtraction, and per-pixel gain maps. A saturation mask flags pixels reaching 100,000–130,000 e− in the final frame; the saturation front is characterized by the ratio of instantaneous slope (difference between consecutive frames) to mean slope (average of pre-saturation frames) per pixel. Persistence is measured as the slope of interleaved dark exposures after subtracting a thermal dark-current frame and empirically constructed fiber-contamination masks, and the decay curves are the median persistence within each saturation mask versus t
What would settle it
Measure, on orbit, the saturated-region diameter and persistence decay for a known ~4th-magnitude star observed through F146: if the saturated region differs substantially from ~150 pixels at ~170 s (beyond PSF differences) or if persistence remains above the detector background for more than ~20–30 minutes at the flight operating temperature, the central claims would be refuted. On the ground, repeating the test with the full F146 spectrum (extending the projector's cut-on from 1.2 µm down to 0.927 µm) would show whether the narrower test bandpass altered the saturation growth or the persiste
Extended reading notes
Core claim
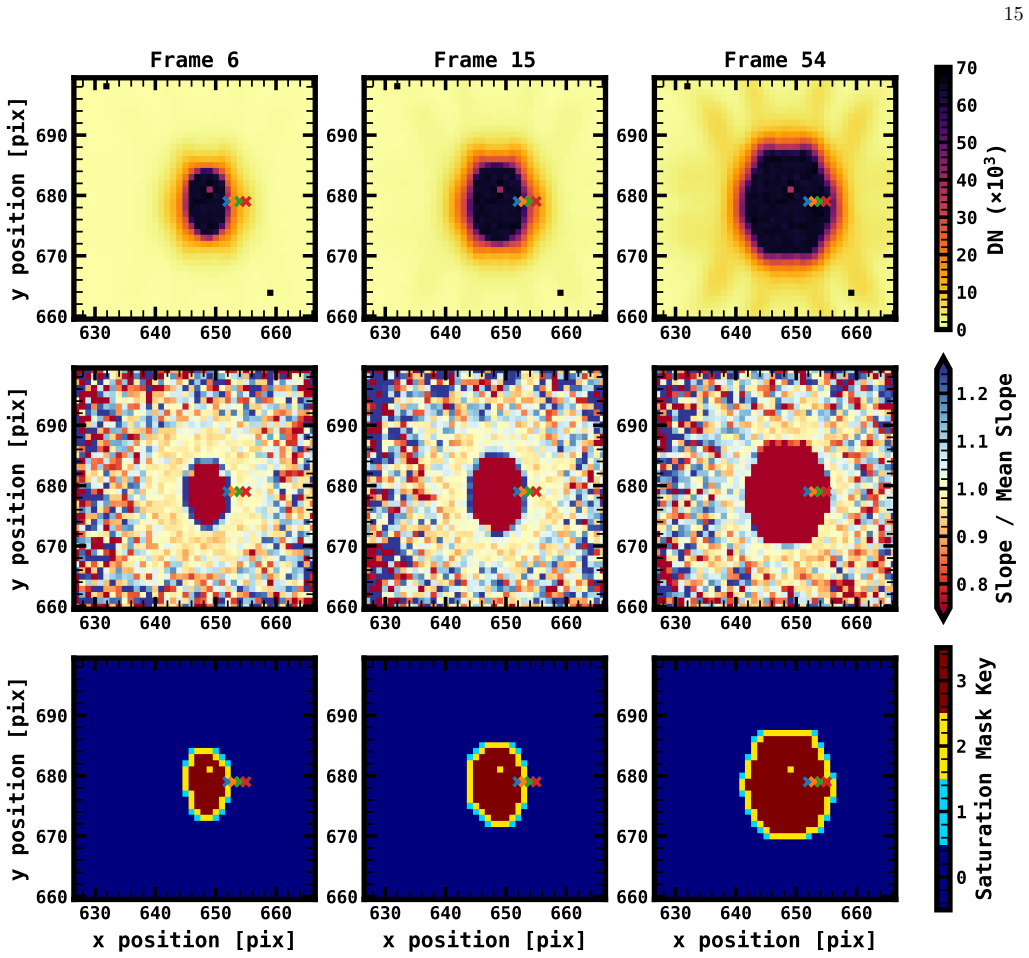
We measured the saturation response and persistence of two Roman WFI sensor chip assemblies by projecting nine in-focus point sources through the F146 filter with the SORC telescope simulator, at fluxes approximating stellar magnitudes ~4 to ~18, in ~170 s up-the-ramp exposures. The saturated region grows to ~150 pixels in diameter for a ~4 mag source versus ~15 pixels for ~12 mag, and pixels adjacent to the advancing saturation front exhibit a dynamic increase in instantaneous slope relative to their pre-saturation mean slope, consistent with charge leakage from saturated neighbors. In interleaved dark exposures, the median persistence within the saturated pixels is broadly consistent acros
Load-bearing premise
The quantitative results transfer to orbit only if the projector's point spread function, spectral passband (1.2–1.9 µm versus the F146 band 0.927–2.0 µm), and stray light faithfully mimic how the flight telescope will illuminate the detectors.
Editorial extensions
If this is right
- A ~4 mag star in a ~170 s exposure will saturate a ~150-pixel-diameter region, so masking tools for GBTDS and other surveys can use this as a first-order footprint for the brightest targets.
- Persistence from deeply saturated point sources decays to the detector background within about 20 minutes, so repeat visits to dense stellar fields can be planned with roughly that recovery timescale in mind.
- Because the first post-illumination persistence is nearly independent of source magnitude, a single persistence correction curve may apply across a wide brightness range.
- The charge leakage at the saturation front is time-dependent and scales with the pixel's own brightness, so photometry of pixels bordering saturated cores requires a model with a time-varying count-rate boost.
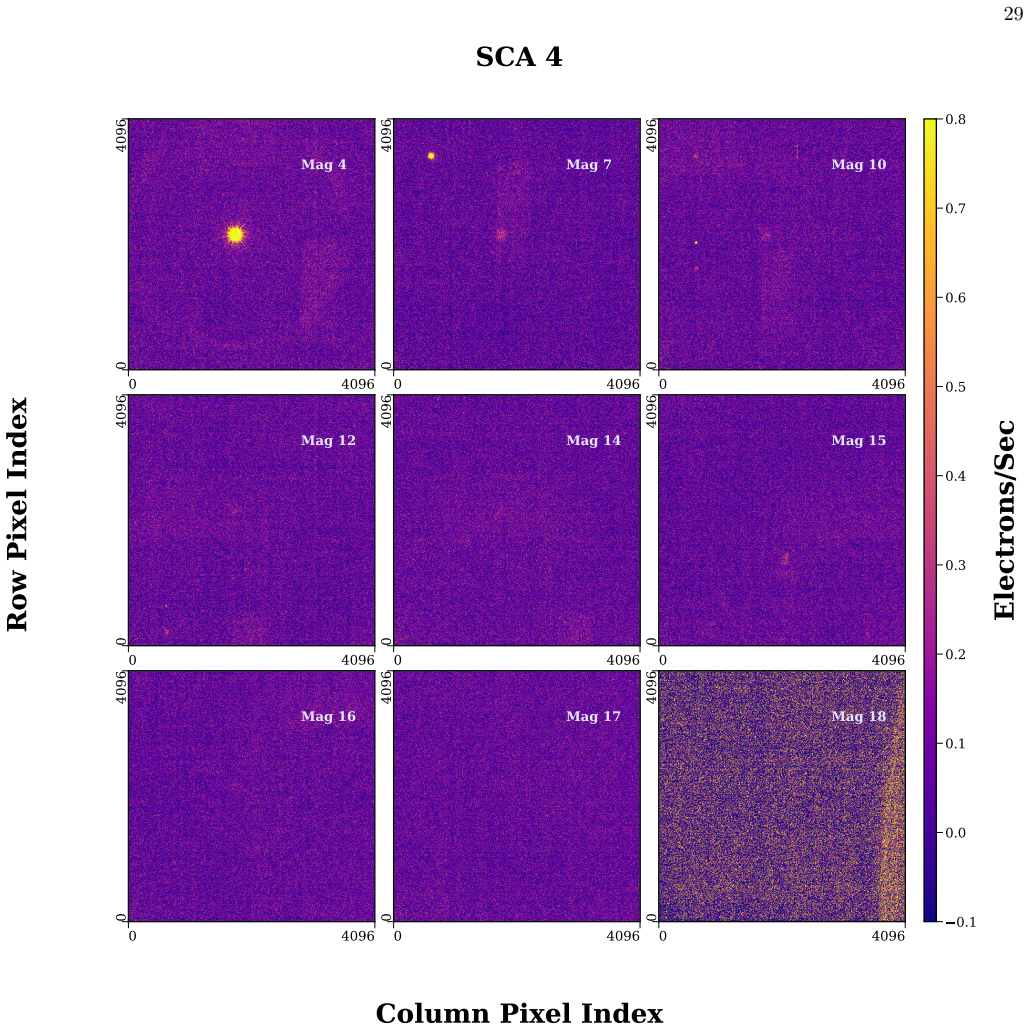
- The band-edge halo redistributes flux laterally across the detector and casts defect shadows, so high-accuracy photometry of the brightest saturated sources must account for internal radiative emission.
Reading between the lines
- If the trap population responsible for persistence is already filled at the fluxes tested, even deeper saturation (say a mag 2–3 source or a ~400 s exposure) should leave the ~20-minute recovery unchanged; a follow-up test could check that directly.
- The near-magnitude independence of persistence suggests a simple scheduling rule for Roman operations: after any exposure containing a saturated star, wait roughly 25–30 minutes before using the same detector region for faint science, making persistence a fixed overhead.
- The observed dynamic charge leakage could be modeled as a spreading-front wave triggered by neighbor saturation; if such a model were developed, it might recover reliable photometry for pixels that are currently discarded in crowded fields.
- The flux halo may be mistaken for telescope stray light or PSF wings in ground test data; on-orbit observations of bright stars in touchstone fields should separate the internal band-edge halo from the flight telescope's scattered light.
Editorial analysis
A structured set of objections, weighed in public.
Referee Report
Summary. This paper reports a bright point-source saturation and persistence test performed during the Roman WFI Thermal Vacuum campaign TVAC2. Using the SORC telescope simulator, nine in-focus point sources approximating stellar magnitudes 4–18 were projected through the F146 filter onto SCAs 4 and 11. The authors analyze up-the-ramp data to measure the growth of saturated regions, characterize non-linear slope behavior near the saturation front, and derive persistence decay curves from interleaved darks. The headline results are that a ~4 mag source produces a saturated region ~150 pixels in diameter after ~170 s (vs. ~15 pixels for ~12 mag), and that persistence from all tested sources decays to detector background levels (≲0.05 e− s−1) within about 20 minutes. The paper also reports a flux halo with defect shadows around the brightest source and makes its analysis products available via Zenodo and STScI repositories.
Significance. If correct, these measurements provide the first direct pre-flight characterization of deep point-source saturation and persistence for Roman WFI, with immediate value for survey planning, masking, and scheduling in the GBTDS and other bright-star fields. The paper is unusually detailed in its data processing: IRRC reference correction, superbias subtraction, per-pixel gains, classical non-linearity correction, explicit saturation-mask definitions, bad-pixel masks, dark-current subtraction, and a documented fiber-contamination subtraction procedure. The persistence comparison with flat-field illumination from the same TVAC2 campaign is a strong internal consistency check, and the public data products will enable further analysis. The principal weakness is the transferability of SORC-based measurements, especially the saturation-region diameter, to the flight telescope.
major comments (3)
- [§2.1, Fig. 4, §3.1] The headline saturation-region diameter (~150 px for mag 4, ~15 px for mag 12) is measured under SORC illumination whose spectrum (SPLIT-IR, 1.2–1.9 µm) is markedly narrower than F146 (0.927–2.0 µm) and whose optics produce stray-light arcs (Fig. 6) that are acknowledged to be absent in flight. The diameter is reported without error bars or a comparison with a modeled PSF (e.g., stpsf) that would support transfer to flight conditions. Since the saturation mask is defined by a 100,000–130,000 e− threshold in the final frame, any PSF broadening or spectral shift could change the measured diameter. Please provide a PSF-fidelity assessment (e.g., comparing a sub-saturated SORC PSF to stpsf predictions and propagating the uncertainty) or explicitly frame the 150-pixel value as a SORC-specific measurement with a corresponding caveat in the abstract and conclusions.
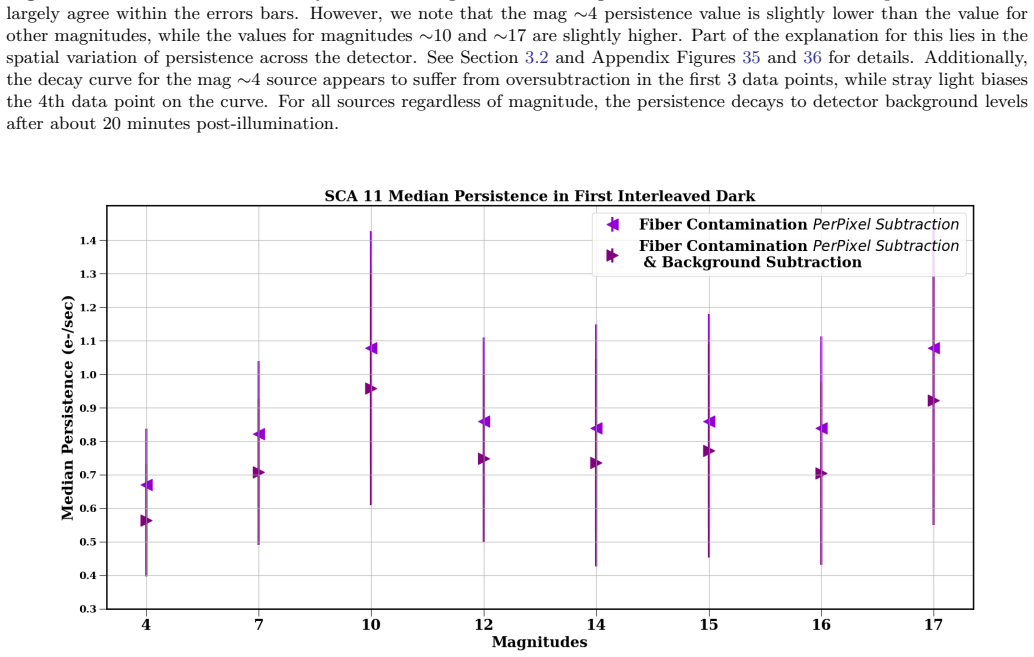
- [§2.2.3, §3.2] The central persistence claim — decay to ≲0.05 e− s−1 within ~20 min — is not supported by a quantitative criterion. The abstract quotes ≲0.05 e− s−1, but the text does not show how this background threshold is derived, nor is it overlaid on the decay curves in Figs. 19 and 21. Several data points are explicitly labeled as oversubtracted or biased by stray light (mag 4 first three points; last points for SCA 4), and the first interleaved dark values for SCA 4 do not agree within the error bars. Please define 'detector background level,' show the threshold on the decay curves, and fit or tabulate the time at which each magnitude/SCA reaches the threshold (or provide another statistical summary). Without this, the 20-minute claim is not crisply evidenced.
- [§2.2.3, steps 1–4] The fiber-contamination subtraction uses an empirical flux threshold (0.62 e−/s for SCA 11, 0.75 e−/s for SCA 4) and a scaling factor for the 'lower' component that is tuned to force the lowest residual in the mask to zero. These are free parameters, and the paper itself reports oversubtraction for the mag 4 source in the first three interleaved darks. The sensitivity of the persistence decay curves to reasonable variations in the threshold and scaling factor should be quantified, or the correction validated using a source geometry where the fiber leak lies outside the ROI. This would establish that the persistence-decay conclusion is robust to the correction.
minor comments (7)
- [§2.1] The SORC characterization reference (Wake and Lyons et al., in prep) is not public. If possible, include additional details of the SORC PSF and its measured quality, or a preprint/technical note.
- [§2.2.1] The IRRC algorithm is cited as 'Rauscher et al., in prep' in addition to the STScI report; a public reference or more algorithmic detail would help reproducibility.
- [§3.1] The statement that the saturation region 'grows to about 150 pixels in diameter' should specify how the diameter is defined (e.g., equivalent circular diameter from the mask area) and should include an uncertainty estimate.
- [§3.2] The error bars are described as 'the average of the persistence interquartile range for all pixels within a given saturation mask.' This is unusual; clarify the statistical choice (e.g., why not the median absolute deviation or bootstrap uncertainty).
- [Fig. 20 caption] For mag 17, only 6 pixels are in the saturation mask and all are affected by fiber contamination. This context should be stated in the figure caption or main text when interpreting the mag 17 point.
- [§4.1] The flux-halo/defect-shadow explanation rests on 'internal discussions with detector experts' and a private communication with T. Brandt. This is speculative; label it clearly as a hypothesis rather than an established mechanism, and cite the NIRCam in-flight observation once the analysis is public.
- [§4.2] The statement 'We make our analysis products publicly available' is qualified by 'the Zenodo repository will be published after paper acceptance.' Please clarify the current availability status in the submitted version.
Circularity Check
No circularity: TVAC2 bright-star saturation and persistence results are direct measurements with independent internal and external anchors.
full rationale
This is a measurement/characterization paper, not a derivation. The headline numbers—~150-pixel saturated-region diameter for a ~4 mag source, ~15 pixels for ~12 mag, and persistence decaying to ≲0.05 e−/s within ~20 minutes—are read directly from up-the-ramp detector frames and interleaved darks. The saturation mask definition (pixels reaching 100,000–130,000 e− in the final illuminated frame) is an operational threshold chosen from the observed flat-top well-depth structure, not a parameter fitted to the reported diameters or persistence levels. The simulated magnitudes were calibrated independently via a published time-to-saturation, magnitude scaling, and the STScI stpsf PSF model; they are approximate inputs but are not derived from the measured saturated-region size, so the magnitude-dependent diameter is not circular. Persistence values are computed as slopes in post-illumination darks with dark-current subtraction, and the comparison with flat-field persistence from the same TVAC2 campaign is a cross-check between two independent measurements, not an input. The paper does cite prior work by overlapping authors (e.g., Betti et al. 2024 for IRRC, Mosby et al. 2020/2025, Schlieder et al. 2024, Wilson et al. 2023), but none of these citations supplies or constrains the central saturation/persistence results; they provide calibration, detector context, and instrument description. The load-bearing caveat, acknowledged in the manuscript itself, is that the SORC projector's spectrum and PSF/stray light (Figs. 4 and 6) must faithfully represent flight illumination for the quantitative values to transfer to orbit; this is an external-validity/correctness risk, not a circularity. No step in the paper's chain equates a prediction with a fitted input or an imported self-citation.
Assumptions & free parameters
free parameters (5)
- SORC source flux calibration for each simulated magnitude =
Mag 4: 4.7e10 e−; 7: 2.9e9; 10: 1.9e8; 12: 2.9e7; 14: 4.7e6; 15: 1.9e6; 16: 7.4e5; 17: 2.9e5; 18: 1.17e5 e− per ~170 s a
- Saturation mask electron range =
100,000–130,000 e−
- Fiber contamination threshold =
0.62 e−/s (SCA 11); 0.75 e−/s (SCA 4)
- Lower fiber subtraction scaling factor =
Not stated numerically (per-pixel constant enforced to give a zero minimum)
- Saturation definition for slope analysis =
Signal constant in subsequent frame and uncorrected signal > 63,500 DN; only first 54 of 55 science frames used
assumptions (5)
- domain assumption SORC projector reproduces the Roman telescope optical prescription (≈f/8) and its SPLIT-IR spectrum adequately represents F146 stellar illumination
- domain assumption Classical non-linearity coefficients from TVAC2 are correct for the deeply saturated regime
- domain assumption The slope enhancement near saturated pixels is caused by charge leakage from saturated neighbors
- ad hoc to paper The flux halo and defect shadows originate from internal radiative recombination near the HgCdTe bandgap edge
- domain assumption The flat-field persistence measured in the same TVAC2 campaign is a valid baseline for point-source persistence comparison
Cite this review
Pith. "Pith review of Nancy Grace Roman Space Telescope Wide Field Instrument: Bright Point Source Saturation Response and Persistence Properties from Thermal-Vacuum Testing." pith.science (2026). https://pith.science/paper/O2KDZ7HW
@misc{pith2026260718419,
  author       = {Pith},
  title        = {Pith review of: Nancy Grace Roman Space Telescope Wide Field Instrument: Bright Point Source Saturation Response and Persistence Properties from Thermal-Vacuum Testing},
  year         = {2026},
  howpublished = {\url{https://pith.science/paper/O2KDZ7HW}},
  note         = {Machine review of arXiv:2607.18419}
}
abstract
The Nancy Grace Roman Space Telescope's Wide Field Instrument (WFI) will observe hundreds of thousands of bright stars across its Core Community Surveys, particularly in the dense stellar fields of the Galactic Bulge Time Domain Survey (GBTDS). Sources brighter than ~17th magnitude will saturate WFI detector pixels in typical survey exposures, with the brightest stars deeply saturating large pixel regions and potentially producing persistence signals that may impact subsequent observations. Prior detector characterization did not explore the regime of deep point source saturation. To address this gap, we conducted a bright star saturation test during WFI's second Thermal Vacuum test campaign (TVAC2) at BAE Space & Mission Systems in Boulder, CO. Using the Stimulus of Ray Cones (SORC) telescope simulator, we projected nine in-focus point sources through the F146 filter onto two Sensor Chip Assemblies (SCAs), with fluxes tuned to approximate stellar magnitudes ranging from ~4 to ~18 in ~170 s exposures. We present analyses of the saturation response and persistence properties of these detectors. We find that the saturated region of a ~4 mag source grows to ~150 pixels in diameter after ~170 s of illumination, compared to ~15 pixels for a ~12 mag source. Pixels adjacent to the expanding saturation front exhibit pronounced non-linear behavior consistent with charge leakage from saturated neighbors. For persistence, we find that the median signal in the first post-illumination dark exposure is broadly consistent across source magnitudes spanning ~4 to ~17, and that persistence decays to detector background levels ($\lesssim$0.05 e$^{-}$ s$^{-1}$) within approximately 20 minutes, consistent with flat field persistence measurements from the same TVAC2 campaign. These pre-flight characterization results inform community understanding of WFI detector response to prepare for Roman science.
Figures


Figures from the paper (31 more)










Forward citations
Cited by 1 Pith paper
-
Persistence characteristics of H4RG-15 detectors for ESO instruments
Persistence in H4RG-15 detectors varies widely between detectors and with temperature; only 2 of 15 show the previously reported 65 K persistence peak.
Reference graph
Works this paper leans on
-
[1]
Astropy Collaboration, Robitaille, T. P., Tollerud, E. J., et al. 2013, A&A, 558, A33, doi: 10.1051/0004-6361/201322068
-
[2]
K., Casertano, S., Brandt, T., et al
Betti, S. K., Casertano, S., Brandt, T., et al. 2024, Application and Characterization of IRRC on Roman/WFI TV AC1 Data, Tech. Rep. Technical Report Roman-STScI-000673, STScI
2024
-
[3]
D., Rizzo, M., Groff, T., et al
Brandt, T. D., Rizzo, M., Groff, T., et al. 2017, Journal of Astronomical Telescopes, Instruments, and Systems, 3, 048002, doi: 10.1117/1.JATIS.3.4.048002
-
[4]
Bray, E., Batkis, M., Chambers, V. J., et al. 2024, Journal of Astronomical Telescopes, Instruments, and Systems, 10, 014003, doi: 10.1117/1.JATIS.10.1.014003
-
[5]
2022, Determining the Best-Fitting Slope and Its Uncertainty for Up-the-Ramp Sampled Images with Unevenly Distributed Resultants, Tech
Casertano, S. 2022, Determining the Best-Fitting Slope and Its Uncertainty for Up-the-Ramp Sampled Images with Unevenly Distributed Resultants, Tech. Rep. Technical Report Roman-STScI-000394, STScI
2022
-
[6]
2023, in Society of Photo-Optical Instrumentation Engineers (SPIE) Conference Series, Vol
Sabatke, D. 2023, in Society of Photo-Optical Instrumentation Engineers (SPIE) Conference Series, Vol. 12676, UV/Optical/IR Space Telescopes and Instruments: Innovative Technologies and Concepts XI, ed. A. A. Barto, F. Keller, & H. P. Stahl, 126760R, doi: 10.1117/12.2676488
-
[7]
Cromey, B., Sabatke, D., Finch, T., et al. 2025, Journal of Astronomical Telescopes, Instruments, and Systems, 11, 044001, doi: 10.1117/1.JATIS.11.4.044001
-
[8]
Eegholm, B. H., Marx, C. T., Chambers, V. J., et al. 2025, Journal of Astronomical Telescopes, Instruments, and Systems, 11, 025001, doi: 10.1117/1.JATIS.11.2.025001 Galactic Plane Survey Definition Committee, R. 2025, arXiv e-prints, arXiv:2511.07494, doi: 10.48550/arXiv.2511.07494
Show all 27 references
-
[9]
R., Millman, K
Harris, C. R., Millman, K. J., van der Walt, S. J., et al. 2020, Nature, 585, 357, doi: 10.1038/s41586-020-2649-2
2020 doi
-
[10]
Hunter, J. D. 2007, Computing in Science and Engineering, 9, 90, doi: 10.1109/MCSE.2007.55
2007 doi
-
[12]
2024b, in Society of Photo-Optical Instrumentation Engineers (SPIE) Conference Series, Vol
Kubik, B., Barbier, R., Smadja, G., et al. 2024b, in Society of Photo-Optical Instrumentation Engineers (SPIE) Conference Series, Vol. 13103, X-Ray, Optical, and Infrared Detectors for Astronomy XI, ed. A. D. Holland & K. Minoglou, 1310315, doi: 10.1117/12.3014312
-
[13]
M., Rieke, M., Misselt, K., & Robberto, M
Leisenring, J. M., Rieke, M., Misselt, K., & Robberto, M. 2016, in Society of Photo-Optical Instrumentation Engineers (SPIE) Conference Series, Vol. 9915, High
2016
-
[14]
Energy, Optical, and Infrared Detectors for Astronomy VII, ed. A. D. Holland & J. Beletic, 99152N, doi: 10.1117/12.2233917
-
[15]
J., Bennett, C., et al
Mosby, G., Rauscher, B. J., Bennett, C., et al. 2020, Journal of Astronomical Telescopes, Instruments, and Systems, 6, 046001, doi: 10.1117/1.JATIS.6.4.046001
2020 doi
-
[16]
Mosby, G., Hill, B., Cillis, A., et al. 2025, Journal of Astronomical Telescopes, Instruments, and Systems, 11, 011210, doi: 10.1117/1.JATIS.11.1.011210 Observations Time Allocation Committee, R., & Community Survey Definition Committees, C. 2025, arXiv e-prints, arXiv:2505.10...
2025 doi
-
[17]
T., Gaudi, B
Penny, M. T., Gaudi, B. S., Kerins, E., et al. 2019, ApJS, 241, 3, doi: 10.3847/1538-4365/aafb69
2019 doi
-
[18]
D., Sivaramakrishnan, A., Lajoie, C.-P., et al
Perrin, M. D., Sivaramakrishnan, A., Lajoie, C.-P., et al. 2014, in Society of Photo-Optical Instrumentation Engineers (SPIE) Conference Series, Vol. 9143, Space Telescopes and Instrumentation 2014: Optical, Infrared, and Millimeter Wave, ed. J. Oschmann, Jacobus M., M. Clampi...
2014 doi
-
[19]
D., Mel´ endez, M., Osborne, S., et al
Perrin, M. D., Mel´ endez, M., Osborne, S., et al. 2015, WebbPSF: James Webb Space Telescope PSF Simulation Tool. http://ascl.net/1504.007
2015
-
[20]
J., Boehm, N., Cagiano, S., et al
Rauscher, B. J., Boehm, N., Cagiano, S., et al. 2014, PASP, 126, 739, doi: 10.1086/677681
2014 doi
-
[21]
W., & Bergeron, L
Regan, M. W., & Bergeron, L. E. 2018, in Society of Photo-Optical Instrumentation Engineers (SPIE) Conference Series, Vol. 10709, High Energy, Optical, and Infrared Detectors for Astronomy VIII, ed. A. D. Holland & J. Beletic, 107091B, doi: 10.1117/12.2314166
2018 doi
-
[22]
J., Kelly, D
Rieke, M. J., Kelly, D. M., Misselt, K., et al. 2023, PASP, 135, 028001, doi: 10.1088/1538-3873/acac53
2023 doi
-
[23]
E., Barclay, T., Barnes, A., et al
Schlieder, J. E., Barclay, T., Barnes, A., et al. 2024, in Society of Photo-Optical Instrumentation Engineers (SPIE) Conference Series, Vol. 13092, Space Telescopes and Instrumentation 2024: Optical, Infrared, and Millimeter Wave, ed. L. E. Coyle, S. Matsuura, & M. D. Perrin, ...
2024 doi
-
[24]
F., Cutri, R
Skrutskie, M. F., Cutri, R. M., Stiening, R., et al. 2006, AJ, 131, 1163, doi: 10.1086/498708
2006 doi
- [25]
-
[26]
2019, Journal of Astronomical Telescopes, Instruments, and Systems, 5, 036004, doi: 10.1117/1.JATIS.5.3.036004
Tulloch, S., George, E., & ESO Detector Systems Group. 2019, Journal of Astronomical Telescopes, Instruments, and Systems, 5, 036004, doi: 10.1117/1.JATIS.5.3.036004
2019 doi
-
[27]
E., & others
Virtanen, P., Gommers, R., Oliphant, T. E., & others. 2020, Nature Methods, 17, 261, doi: 10.1038/s41592-019-0686-2
2020 doi
-
[28]
F., Barclay, T., Powell, B
Wilson, R. F., Barclay, T., Powell, B. P., et al. 2023, ApJS, 269, 5, doi: 10.3847/1538-4365/acf3df
2023 doi
Reviewed August 1, 2026 · model on record in the stance chip above.
Discussion (0). Continue with ORCID to comment.