REVIEW 4 major objections 4 minor 20 references
The concordance index can report near-perfect discrimination while a survival model's probability estimates fail calibration tests by enormous margins, and C-index-only evaluation outside healthcare is not a reliable proxy.
Reviewed by Pith at T0; open to challenge. T0 means a machine referee read the full paper against a public rubric. the ladder, T0–T4 →
2026-08-01 12:28 UTC pith:WPTPGC6F
load-bearing objection First real-data test of the C-index critique: the calibration dissociation is real, but the headline meta-verdict rests on one fragile threshold reading. the 4 major comments →
The C-index illusion: discrimination without calibration in published survival models
The pith
A machine-rendered reading of the paper's core claim, the machinery that carries it, and where it could break.
Core claim
The paper establishes that the illusion warned about by a recent position paper is real and generalizes beyond synthetic data: a survival model can rank risk almost perfectly while assigning probabilities that are systematically wrong. Reproducing three published survival-ML models to tight fidelity, the authors show that all seven reproduced models fail a formal D-Calibration test, including one with C = 0.9595 matching the published 0.958. Treating loan prepayment as ordinary censoring instead of a competing risk biases estimated default probability upward by roughly two percentage points on average and nearly four in the riskiest credit grades. A platform churn model's global C-index sits
What carries the argument
The central machinery is the double-helix ladder: the rule that an evaluation metric is valid only at the same rung of a censoring-assumption hierarchy as the model it judges. The paper applies three instruments from survival analysis—D-Calibration, a formal hypothesis test that checks whether predicted survival quantiles match observed outcomes; IPCW-weighted Integrated Brier Score, a proper scoring rule that penalizes the full predicted probability; and the Aalen-Johansen estimator, which correctly handles competing events. These are applied to reproduced published models while holding the models fixed and varying only the evaluation lens.
Load-bearing premise
The load-bearing premise is that the evaluation instruments—D-Calibration and IPCW-IBS, ported from the position paper's code and validated only for integration fidelity—correctly measure miscalibration on these real datasets; a latent error in that code or dependent censoring inflating apparent miscalibration would weaken the headline dissociation.
What would settle it
Run an independent, from-scratch implementation of D-Calibration and IPCW-IBS on the same reproduced hard-drive failure model and check whether the calibration p-value is still far below 0.001; if it is not, the headline dissociation is an instrumentation artifact. Additionally, apply a copula-adjusted calibration test under assumed dependent censoring to see whether the miscalibration shrinks toward irrelevance.
If this is right
- A published survival model with a high C-index can have probability estimates that a formal calibration test rejects by over a hundred orders of magnitude; calibration checks should accompany discrimination reporting.
- Treating a competing event such as loan prepayment as ordinary censoring materially inflates estimated default risk, especially in the riskiest segments, which is consequential for lending and capital decisions.
- A model's global C-index can remain inside a published performance band while its predictive accuracy degrades at longer horizons; horizon-specific proper scores are needed for operational decisions.
- The failure mode documented is misplaced confidence rather than choosing the wrong model: the ranking-inversion test did not reject, so C-index-only evaluation is more a trust problem than a selection problem.
- The released evaluation harness makes it straightforward to audit future survival-model results with calibration and proper-scoring metrics rather than discrimination alone.
Where Pith is reading between the lines
- Editorially: the non-rejection of the ranking-inversion hypothesis should not be read as reassurance, since only two to three models per domain give that test very low power; larger model sets could still reveal metric-driven preference flips.
- Editorially: extending the same audit to deep survival models would test whether the discrimination-calibration dissociation is specific to Cox and random survival forests or is a more general property of survival ML.
- Editorially: constructing a copula-adjusted version of D-Calibration—which does not yet exist—would determine how much of the apparent miscalibration is due to dependent censoring rather than genuine model error, and is a natural next step.
- Editorially: the pattern parallels accuracy under class imbalance in classification; a single aggregate metric becomes blind to the failure mode that matters most, suggesting the supplement-the-metric remedy may be broadly applicable.
Editorial analysis
A structured set of objections, weighed in public.
Referee Report
Summary. This paper empirically tests whether C-index-only evaluation of survival models misleads outside healthcare. It reproduces three published survival-ML baselines (hard-drive failure, P2P credit default, and Stack Exchange user disengagement), validates an evaluation harness by reproducing the anchor paper's synthetic experiment, and tests five pre-registered hypotheses under Holm-corrected family-wise error control. The headline results are: H2 rejects (a model reproducing published discrimination at C=0.9595 fails D-Calibration at p≈10^-136); H3 rejects under the authors' absolute-count reading of the pre-registered strata rule (naive minus Aalen-Johansen 12-month default CIF bias = 0.0218, exceeding the 0.02 threshold, with D/E/F strata supporting); and H5 rejects (IPCW Brier worsens with horizon while global C-index remains in the reported band). H1 and H4 do not reject. The meta-hypothesis (≥3/5 primary rejections) is therefore declared rejected, but this verdict depends on interpreting the freeze's '≥3 of 5 rating strata' as an absolute count rather than a fraction of the seven observed strata; the authors disclose this ambiguity explicitly.
Significance. If taken at face value, the paper is a valuable existence proof and a methodological contribution: it shows that high discrimination can coexist with formally rejected calibration, that treating a competing event as non-informative censoring creates a directional and practically relevant probability bias, and that horizon-specific degradation of a proper score can be masked by a stable global C-index. The paper's strengths are its pre-registration, its unusually explicit disclosure of a posteriori decisions, its careful reproduction of all three baselines (Domain 1 C-index reproduced within 0.0015), and the release of a reusable harness and notebook. The main weakness is that the formal meta-verdict is fragile: it hinges on an ambiguous pre-registration denominator, and the evaluation instrument is validated only by integration fidelity with the anchor's code, not by independent reimplementation. These limitations are disclosed, but they make the headline 'three of five reject' and the unconditional meta-verdict stronger than the evidence supports. The substantive H2 and H5 findings, and the monotonic H3 pattern, remain informative even if the meta-claim is reframed.
major comments (4)
- [§4.5, §5.3, Appendix A (H3/Hmeta)] The central meta-verdict is not robust to the pre-registration denominator ambiguity. The freeze specifies '≥3 of 5 rating strata,' written before inspecting Bondora, which contains seven strata (AA–F). The manuscript applies the absolute count ≥3, satisfied by D/E/F, and rejects H3. But a fractional reading of '≥3 of 5' as '≥60%,' i.e., ≥5 of 7, is equally defensible and would not reject H3. H3's Holm-adjusted p is 0.0448, and the effect (0.0218) exceeds the 0.02 threshold by only 0.0018. Without H3, only H2 and H5 reject, so the pre-registered meta-hypothesis gate of ≥3/5 is not met. The authors disclose both readings, but the abstract and §4.8 state 'three of five reject' and 'the meta-hypothesis is rejected' without making this conditionality the primary framing. Because the paper's central claim is the meta-verdict, this is load-bearing. The revision should present the verdict as ex
- [§3.4, §5.3] The instrument validation establishes fidelity of integration, not independent correctness. The authors state that a latent bug in the anchor's D-Calibration/IPCW-IBS implementation would be inherited by their harness. Since H2's headline p<0.001 is computed with this ported implementation, the claim that the instrument is 'validated' is weaker than an independent verification. I am not asserting that a bug exists, but the correctness risk is load-bearing for H2. The authors should either cross-check D-Calibration and IPCW-IBS against an independent implementation, or explicitly state in the results that the calibration p-values come from an integration-validated but not independently reimplemented tool, and discuss how a systematic implementation error would affect the conclusions. The enormous observed p margin makes a full reversal implausible, but the audit's methodological standard
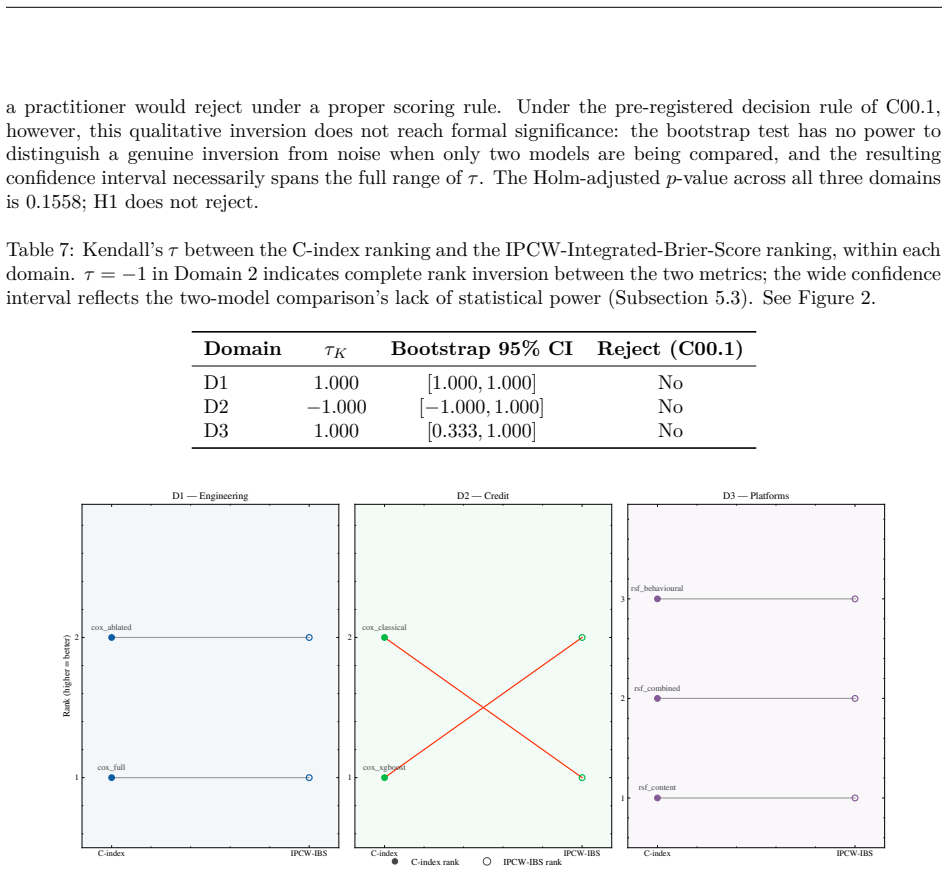
- [§4.3, Table 7, §5.1] The conclusion that C-index-only evaluation 'does not fail as a comparison problem' overstates what H1 can support. In Domain 2, the observed Kendall's τ is -1.000 but the bootstrap CI is [-1.000, 1.000], which is completely uninformative; with only two models, the test has no power to distinguish inversion from noise. The paper acknowledges this, yet §5.1 and the conclusion rely on H1's non-rejection to argue that the failure mode is 'misplaced confidence' rather than 'choosing the wrong model.' The correct summary is that H1 is inconclusive in Domain 2 and consistent with agreement in Domains 1 and 3. This distinction should be reflected in the framing of the paper's main message.
- [§4.6, §5.1] The post-hoc cluster ablation complicates the 'not a trivial shortcut artifact' interpretation of H2. The pre-registered leave-one-out null stands, but Cluster A (SMART 9/240/241, age/usage proxies) jointly drops C by 0.0920 with non-overlapping CIs, indicating that a substantial share of the reproduced discrimination is concentrated in a small correlated feature group. The manuscript reports this transparently, but the abstract's statement that the calibration failure is 'not a trivial shortcut artifact' should be qualified: no single attribute is responsible, but a small age/usage cluster is. This does not undermine the H2 dissociation, but it narrows the claim about how distributed the discrimination actually is.
minor comments (4)
- [Table 3] The notation '≥3/7 strata' in Table 3 is ambiguous: it can be read as an absolute count (3 of 7) or as a fraction (3/7 ≈ 43%). Harmonize it with the Appendix A freeze text, which says '≥3 of 5,' and clarify in the table footnote that the applied rule is the absolute count.
- [Figure 6] The x-axis label in Figure 6 renders as 'Kendall's ¿' instead of Kendall's τ, likely an encoding issue. Please fix.
- [Abstract / §6] 'Over a hundred orders of magnitude' is imprecise; p=2.60×10^-136 means 135 orders of magnitude below 1. State the p-value or '≈10^-136' instead.
- [§3.3] The reproduction tolerance was fixed after observing that all three domains cleared it. This is disclosed, but the admission criterion should be described as 'post-hoc but non-load-bearing' in the main text, not only in the appendix, to avoid readers missing that it was not pre-registered.
Circularity Check
No circularity: the paper is an empirical audit against external published models; disclosed limitations are validity risks, not circular reductions.
full rationale
The paper's derivation chain is an audit, not a construction that folds its conclusion into its inputs. The three baselines are external published papers (Ahmed & Green, Bone-Winkel & Reichenbach, Abedi Firouzjaei), and the headline quantities—Harrell C, D-Calibration p-values, naive vs. Aalen-Johansen cumulative incidence, and horizon-specific IPCW Brier scores—are computed from reproduced models on public data. No fitted parameter is renamed as a prediction: the reproduced C-index (0.9595) is matched to the published value and then independently evaluated for calibration; the calibration failure is a measured property of the fitted model, not a consequence of the reproduction target. H3's bias (0.0218 vs. 0.02 threshold) is also a measurement, and neither the measurement nor its confidence interval depends on the pre-registration denominator; the disclosed '>=3 of 5' vs. '>=3 of 7' ambiguity affects only the counting rule for the meta-verdict, and the paper explicitly reports both readings rather than silently choosing the favorable one. The instrument validation against the anchor paper's synthetic experiment is explicitly limited to 'fidelity of integration, not independent correctness,' and the paper flags that a latent bug in the anchor's code would be inherited—this is a validity limitation, not a circular step, and it is weighed as such here. The reproduction admission criterion was declared a posteriori, but the paper verifies that it governs baseline admission only and does not alter any hypothesis outcome. There is no self-citation chain, no imported uniqueness theorem, no ansatz smuggled in via citation, and no renaming of a known result as a new derivation. The close calls are pre-registration fragility and instrument-validation strength, not definitional circularity, so the honest finding is no significant circularity.
Axiom & Free-Parameter Ledger
free parameters (6)
- H3 CIF bias threshold =
0.02
- H3 strata-count rule =
>=3 (absolute) of 7 observed strata
- H4 delta-C threshold =
0.03 with non-overlapping CIs
- H5 C-index band =
[0.66, 0.76]
- Domain 1 Cox penalizer =
0.01
- Domain 1 SMART snapshot =
last observed day
axioms (6)
- domain assumption The three reproduced baselines are faithful enough to the published models to stand in for them
- domain assumption D-Calibration (Haider et al.) correctly detects miscalibration on these data
- domain assumption The ported anchor evaluation code is correct
- domain assumption Standard survival metrics (Harrell C, IPCW-IBS) are valid under each domain's censoring mechanism
- standard math Bootstrap CIs with B=1000 adequately represent sampling variability
- standard math Two-level Holm-Bonferroni controls FWER at alpha=0.05
Cite this review
Pith. "Pith review of The C-index illusion: discrimination without calibration in published survival models." pith.science (2026). https://pith.science/paper/WPTPGC6F
@misc{pith2026260719526,
  author       = {Pith},
  title        = {Pith review of: The C-index illusion: discrimination without calibration in published survival models},
  year         = {2026},
  howpublished = {\url{https://pith.science/paper/WPTPGC6F}},
  note         = {Machine review of arXiv:2607.19526}
}
read the original abstract
Recent work has argued normatively, on synthetic data, that evaluating survival models by discrimination alone (concordance index) yields systematically misleading model comparisons, because the metric ignores calibration and time-dependent accuracy. Whether this matters for real, published, non-clinical models has not been tested. We reproduce three published survival-ML models across three structurally distinct domains -- hard-drive failure prediction, peer-to-peer credit default, and user disengagement on digital platforms -- validate our instrument against the anchor paper's own synthetic experiment, and test five pre-registered hypotheses under a Holm-corrected family-wise error rate. Three of five reject (though one pre-registered threshold clears by a narrow margin). A model reproducing the published literature's discrimination almost exactly (C = 0.9595 vs. 0.958 reported) fails a formal calibration test at p < 0.001; a broad feature-ablation search finds no single attribute responsible for its discrimination, so the calibration failure is not a trivial shortcut artifact. A lender's estimated default risk is biased upward by roughly two percentage points, growing to nearly four in the riskiest segment, when loan prepayment is treated as non-informative censoring rather than a competing risk. A platform's churn model shows probability estimates that degrade with the horizon even as global discrimination stays within the pre-registered C-index band. A direct test of whether metric choice inverts model preference does not reject, though with limited power given two to three models per domain; the failure mode we document is better characterized as misplaced confidence in a chosen model than as choosing the wrong one. We release a pre-registered evaluation harness with full code and an annotated notebook, so these results can be verified independently and the audit extended.
Figures



Reference graph
Works this paper leans on
-
[4]
URL https://doi.org/10.1007/s42521-024-00114-3
doi: 10.1007/s42521-024-00114-3. URL https://doi.org/10.1007/s42521-024-00114-3. Maarten Coemans, Geert Verbeke, Bernd Döhler, Caner Süsal, and Maarten Naesens. Bias by censoring for competing events in survival analysis.BMJ, 378:e071349,
-
[5]
URL https://doi.org/10.1136/bmj-2022-071349
doi: 10.1136/bmj-2022-071349. URL https://doi.org/10.1136/bmj-2022-071349. Frank Emmert-Streib and Matthias Dehmer. Introduction to survival analysis in practice.Machine Learning and Knowledge Extraction, 1(3):1013–1038,
-
[9]
URLhttps:// doi.org/10.1002/(SICI)1097-0258(19990915/30)18:17/18<2529::AID-SIM274>3.0.CO;2-5
doi: 10.1002/(SICI)1097-0258(19990915/30)18:17/18<2529::AID-SIM274>3.0.CO;2-5. URLhttps:// doi.org/10.1002/(SICI)1097-0258(19990915/30)18:17/18<2529::AID-SIM274>3.0.CO;2-5. Humza Haider, Bret Hoehn, Sarah Davis, and Russell Greiner. Effective ways to build and evaluate individual survival distributions.Journal of Machine Learning Research, 21(85):1–63,
-
[13]
doi: 10.1016/j. compbiomed.2025.111176. URLhttps://doi.org/10.1016/j.compbiomed.2025.111176. 21 Jaya M. Satagopan, Leah Ben-Porat, Marianne Berwick, Mark Robson, David Kutler, and Arleen D. Auer- bach. A note on competing risks in survival data analysis.British Journal of Cancer, 91(7):1229–1235,
arXiv 2025
-
[16]
doi: 10.1136/bmj-2021-069249. URLhttps://doi.org/10. 1136/bmj-2021-069249. Ping Wang, Yan Li, and Chandan K. Reddy. Machine learning for survival analysis: A survey.ACM Computing Surveys, 51(6):110:1–110:36,
-
[17]
URLhttps://doi.org/10.1145/ 3214306
doi: 10.1145/3214306. URLhttps://doi.org/10.1145/ 3214306. David Wissel, Nikita Janakarajan, Aayush Grover, Elisa Toniato, María Rodríguez Martínez, and Valentina Boeva. SurvBoard: Standardized benchmarking for multi-omics cancer survival models.Briefings in Bioinformatics, 26(5):bbaf521,
-
[18]
URLhttps://doi.org/10.1093/bib/ bbaf521
doi: 10.1093/bib/bbaf521. URLhttps://doi.org/10.1093/bib/ bbaf521. Ewa Wycinka. Competing risk models of default in the presence of early repayments.Econometrics. Ekonometria. Advances in Applied Data Analysis, 23(2):99–118,
-
[19]
URL https://doi.org/10.15611/eada.2019.2.07
doi: 10.15611/eada.2019.2.07. URL https://doi.org/10.15611/eada.2019.2.07. A Protocol Freeze Protocol Freeze Record (version2026-07-12.c00.v5.1). Every methodological decision documented here wasfixedbeforeanytestdatawereexamined, exceptwhereexplicitlynoted(C00.4, Subsection3.3). Rejected alternatives are listed for transparency. •Frozen at (UTC):2026-07-...
-
[20]
metric":
Hypotheses (decision rules) H1 – Ranking inversion under metric-assumption misalignment.H 0:Within each domain, C- index ranking equals IPCW-IBS ranking (τK = 1).H 1:τ K <1in at least one domain (math alternative; decision = C00.1).Statistic:Kendallτ K (C-index rank vs. IPCW-IBS rank); subject-level stratified boot- strap CI (primary); rank permutation (s...
2020
-
[1982]
URL https://doi.org/10.1001/jama.1982.03320430047030
doi: 10.1001/jama.1982.03320430047030. URL https://doi.org/10.1001/jama.1982.03320430047030. Vincent Jeanselme, Brian Tom, and Jessica Barrett. Competing risks: Impact on risk estimation and algorithmic fairness,
arXiv 1982
- [1999]
-
[2004]
URLhttps://doi.org/10.1038/sj.bjc.6602102
doi: 10.1038/sj.bjc.6602102. URLhttps://doi.org/10.1038/sj.bjc.6602102. Hajime Uno, Tianxi Cai, Michael J. Pencina, Ralph B. D’Agostino, and L. J. Wei. On the C-statistics for evaluating overall adequacy of risk prediction procedures with censored survival data.Statistics in Medicine, 30(10):1105–1117,
-
[2005]
doi: 10.1002/sim.2427. URLhttps://doi.org/10. 1002/sim.2427. Georg F. Bone-Winkel and Felix Reichenbach. Improving credit risk assessment in P2P lending with explain- able machine learning survival analysis.Digital Finance,
-
[2011]
URLhttps://doi.org/10.1002/sim.4154
doi: 10.1002/sim.4154. URLhttps://doi.org/10.1002/sim.4154. Nan van Geloven, Daniele Giardiello, Edouard F. Bonneville, Lucy Teece, Chava L. Ramspek, Maarten van Smeden, Kym I. E. Snell, Ben van Calster, Maja Pohar-Perme, Richard D. Riley, Hein Putter, and Ewout W. Steyerberg. Validation of prediction models in the presence of competing risks: A guide thr...
-
[2019]
URLhttps://doi.org/ 10.3390/make1030058
doi: 10.3390/make1030058. URLhttps://doi.org/ 10.3390/make1030058. Jason P. Fine and Robert J. Gray. A proportional hazards model for the subdistribution of a competing risk.Journal of the American Statistical Association, 94(446):496–509,
-
[2020]
doi: 10.1080/01605682.2020.1759385. URLhttps://doi.org/10. 1080/01605682.2020.1759385. Erika Graf, Claudia Schmoor, Willi Sauerbrei, and Martin Schumacher. Assessment and comparison of prognostic classification schemes for survival data.Statistics in Medicine, 18(17-18):2529–2545,
arXiv 2020
-
[2021]
Irene Rossi, Federico Sartori, Corrado Rollo, Giovanni Birolo, Piero Fariselli, and Tiziana Sanavia
URLhttps://arxiv.org/abs/2003.12206. Irene Rossi, Federico Sartori, Corrado Rollo, Giovanni Birolo, Piero Fariselli, and Tiziana Sanavia. Beyond Cox models: Assessing the performance of machine-learning methods in non-proportional hazards and non-linear survival analysis.Computers in Biology and Medicine, 198:111176,
Pith/arXiv arXiv 2003
-
[2022]
URLhttps://doi.org/10.1007/s13278-022-00914-8
doi: 10.1007/s13278-022-00914-8. URLhttps://doi.org/10.1007/s13278-022-00914-8. 20 Junaid Ahmed and Roger Green. Leveraging survival analysis in cost-aware DeepNet for efficient hard drive failure prediction.Neural Computing and Applications,
-
[2024]
URL https://doi.org/10.1007/s00521-024-10479-6
doi: 10.1007/s00521-024-10479-6. URL https://doi.org/10.1007/s00521-024-10479-6. Laura Antolini, Patrizia Boracchi, and Elia Biganzoli. A time-dependent discrimination index for survival data.Statistics in Medicine, 24(24):3927–3944,
-
[2025]
Christian Marius Lillelund, Shi-ang Qi, and Russell Greiner
URLhttps://arxiv.org/abs/2508.05435. Christian Marius Lillelund, Shi-ang Qi, and Russell Greiner. Overcoming dependent censoring in the evalu- ation of survival models, 2025a. URLhttps://arxiv.org/abs/2502.19460. Christian Marius Lillelund, Shi-ang Qi, Russell Greiner, and Christian Fischer Pedersen. Position: Stop chasing the C-index when evaluating surv...
Pith/arXiv arXiv 2019
This paper was first reviewed by deepseek-v4-flash on August 1, 2026.
discussion (0)
Sign in with ORCID, Apple, or X to comment. Anyone can read and Pith papers without signing in.