REVIEW 4 major objections 5 minor 6 references
Kinetically-Arrested Phase Separation leads to Tunable Domain Structures in Vapor-Deposited Glasses
T0 review · 4 major / 5 minor · reviewed 2026-08-01 · deepseek-v4-flash
Pith's one-line read Deposition rate alone determines the phase-separated domain size and roughness in vapor-deposited TPD/DO37 glass films.
desk verdict Deposition-rate tuning of the small domain spacing is plausible but not yet fully established—the decisive peak-2 positions come from forced fits to single broad PSD features. read the letter →
The pith
A machine-rendered reading of the paper's core claim, the machinery that carries it, and where it could break.
The reading
What carries the argument
The surface equilibration mechanism: during deposition, molecules at the free surface have enhanced mobility and can diffuse, phase-separate, and coarsen before being buried and kinetically frozen. The paper's quantitative tool is the power spectral density (PSD) of AFM height and phase images, whose peaks give characteristic real-space lengths d=2π/q; two Gaussian peaks are fit after linear background subtraction. The percolation-to-cluster transition supplies the two-length-scale interpretation: an initially bicontinuous spinodal network breaks into droplet clusters, so a large spinodal-like scale and a small droplet scale coexist. Resonant soft X-ray scattering (RSoXS) provides the bulk c
What would settle it
Re-measure the middle-rate film (0.08 nm/s) with larger scan areas and different AFM tips and compute the power spectral density: if the small-domain peak shifts with scan size or disappears when the large-scale background is removed, it is an artifact. A second check is bulk scattering near an X-ray energy where the two molecules have nearly identical refractive index—if the small-domain peak still appears there, it cannot be compositional.
Extended reading notes
Core claim
The central claim is that kinetic arrest during vapor deposition, not only thermodynamics, sets the final phase-separated morphology of a molecular glass blend. By varying deposition rate from 0.008 to 0.8 nm/s at constant substrate temperature in a TPD/DO37 film, the authors find two distinct, rate-dependent structural length scales at the surface: a low-q peak near q≈0.015 nm⁻¹ that is nearly rate-independent and a high-q peak that shifts to larger length scales as rate is lowered. AFM power spectral densities and resonant soft X-ray scattering both show these two scales, with RSoXS energy-dependent contrast indicating the shorter scale is almost entirely compositional and the longer scale
Load-bearing premise
That the two peaks seen in the roughness spectrum are truly two separate physical length scales—especially the smaller-domain peak, which shows up as only a broad hump in the middle-rate films and a weak shoulder in the slowest film; if that peak is a mathematical artifact of the fitting procedure, the claim of independently tunable small-scale structure is not supported.
Editorial extensions
If this is right
- Domain spacing in vapor-deposited organic blends can be continuously tuned by deposition rate alone, without changing temperature or composition.
- Because the short length scale is set during deposition and does not evolve on annealing, PVD can create stable small domains that later thermal treatment cannot erase.
- Surface AFM measurements significantly underestimate the bulk small-domain spacing (by about a factor of two), so bulk characterization is needed to predict device-relevant morphology.
- The energy-dependent RSoXS contrast identifies the short length scale as compositional and the long scale as partly topographical, meaning surface roughness and composition can coarsen independently.
- The annealing results indicate capillary levelling smooths surface height fluctuations without changing the underlying compositional domains, decoupling topography from phase-separation structure.
Reading between the lines
- If deposition rate can be programmed during a single run, one could build graded morphologies—small domains near the substrate and larger domains near the surface—without any post-processing step.
- The rate dependence of the short length scale resembles effective-rate control of surface equilibration depth; a testable extension is that the same short length scale can be produced by trading rate against substrate temperature according to rate-temperature superposition.
- The factor-of-two discrepancy between AFM and RSoXS suggests a growth scenario in which surface islands cap and fuse into larger bulk domains; cross-sectional imaging or depth-resolved scattering could test whether domain size increases with depth.
- The decoupling of roughness from composition implies two independent design levers for organic devices: deposition rate sets domain spacing, while a mild anneal can smooth the surface without destroying the desired phase-separated bulk structure.
Signed reviews
Editorial analysis
A structured set of objections, weighed in public.
Referee Report
Summary. The manuscript reports physical vapor deposition of co-deposited TPD/DO37 glass blends at fixed substrate temperature (310 K) and five deposition rates, and characterizes the resulting phase-separated morphologies by AFM height/phase imaging, PSD analysis, RSoXS, and post-deposition annealing. The central claim is that the domain morphology—specifically a shorter center-to-center spacing (PSD peak 2) and a longer spacing (peak 1)—can be tuned by deposition rate alone, and that the shorter length scale arises largely from compositional phase separation while the larger length scale also carries a topographic contribution. The authors interpret the results through the surface-equilibration mechanism and a percolation-to-cluster transition framework. The paper includes open data and code, multi-energy RSoXS, and annealing experiments.
Significance. If the central claim holds, the paper provides a direct processing-structure relation: deposition rate as a control parameter for domain size in vapor-deposited organic blends, which is relevant for organic electronic devices. The study is commendable for combining AFM PSD analysis with bulk-sensitive RSoXS and for making data/code openly available. However, the quantitative core of the tunability claim—the rate dependence of the shorter length scale—is built on a two-Gaussian decomposition of PSDs that are, by the authors' own description, single broad features for intermediate rates and a weak shoulder for the lowest rate. The current evidence is therefore conditional on a modelling assumption that has not been independently validated. The paper is potentially valuable, but the key quantitative result needs stronger support before publication.
major comments (4)
- [Results, AFM PSD analysis / Fig. 3] The central claim that the center-to-center domain spacing is tuned by deposition rate rests on the peak positions in Fig. 3C. For Rdep = 0.04 and 0.08 nm/s, the PSD is described as a single broad feature that the authors 'for now' assume is a convolution of two length scales; for Rdep = 0.008 nm/s, peak 2 is only a weak shoulder near q ~ 0.055 nm^-1. After subtracting a linear background and fitting two Gaussians, the fitted high-q positions are used as quantitative evidence. This is a model assumption, and the manuscript does not report model-selection tests, parameter uncertainties, or independent real-space validation. Please provide one or more of the following: one-peak vs two-peak model comparison (e.g., AIC/BIC), bootstrap confidence intervals on peak positions, replicate AFM scans, or real-space domain spacing statistics from binarized/Fourier-filtered images with error bars. Wi
- [Results, Bulk structure analysis with RSoXS / Fig. 4C] The RSoXS peak 2 positions differ by roughly a factor of two from the AFM peak 2 positions (0.8 nm/s: 0.045 vs 0.089 nm^-1; 0.04 nm/s: 0.025 vs 0.045 nm^-1). The manuscript attributes this to surface vs bulk aging, but this means that the AFM peak 2 does not directly report the bulk domain spacing. Because the tunability claim is demonstrated at the surface and RSoXS was only collected at two deposition rates, the bulk extent of the rate-tunability is not established. Please state this scope explicitly or provide additional bulk or cross-sectional data showing that the rate trend continues beyond the surface.
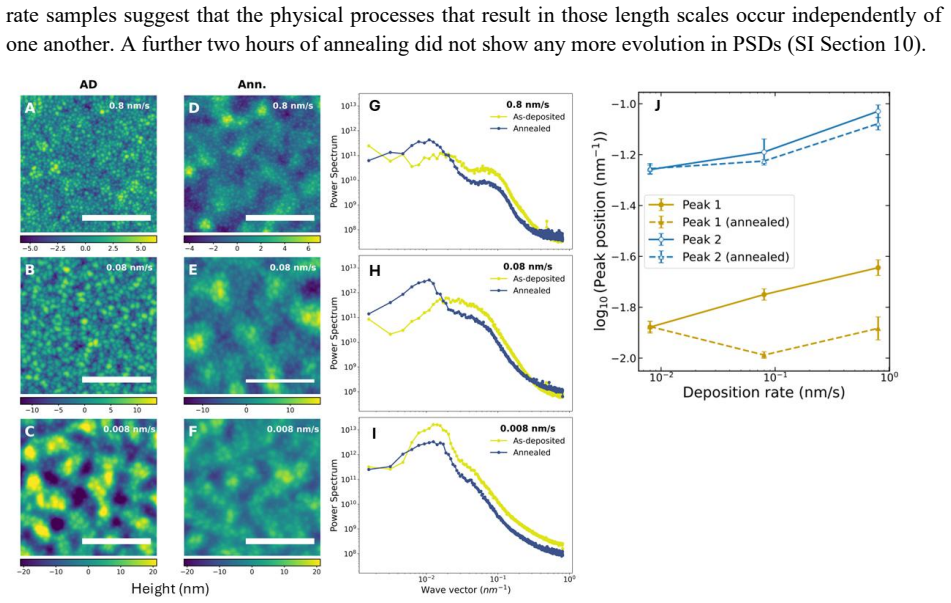
- [Results, Morphology evolution during annealing / Fig. 6] The annealing experiment is used to argue that the two length scales are physically distinct and that peak 2 is stationary while peak 1 evolves. For the Rdep = 0.08 nm/s film, the as-deposited PSD is a single broad feature and the peaks only separate after annealing. The fitted peak positions before and after annealing therefore rely on the same unvalidated decomposition. Figure 6J reports no error bars, and the corresponding fits are not shown. Please report uncertainties and the fitting details for the annealed samples so the independence of peak 2 under annealing can be evaluated.
- [Results, Bulk structure analysis with RSoXS / Eq. 7] The ISI analysis assumes that the films contain no internal voids and attributes all vacuum contrast to surface roughness. This assumption is load-bearing for the conclusion that peak 2 is essentially 100% compositional contrast while peak 1 has a topographic contribution. The manuscript does not justify the no-void assumption for a phase-separating film; voids can form during deposition or phase separation. Please address this assumption experimentally or explicitly state that the compositional/topographic assignment is conditional on it.
minor comments (5)
- [Results, AFM Surface Morphology and Phase Imaging] The paragraph ends with the incomplete sentence 'Overall, the PV distances' (page 8). The sentence should be completed or removed.
- [Results, Morphology evolution during annealing / Fig. 6] There is an apparent mismatch between the text and the Figure 6 caption. The text refers to the fastest Rdep = 0.8 nm/s film as 'shown in Figure 6A', but the caption assigns panel A to Rdep = 0.008 nm/s. Please correct the cross-reference.
- [Abstract] Typo: 'homogenous' should be 'homogeneous'.
- [Materials & Methods, Resonant Soft X-ray Scattering] The ISI model in Eq. (7) has three open parameters (B, A, E0), but the contrast functions Δn_x are derived from NEXAFS data that the authors note may contain a mixed population of DO37 conformers. Please clarify how this uncertainty propagates into the fitted composition weights A, especially for the 100% composition conclusion for peak 2.
- [Results, Morphology evolution during annealing / Fig. 6] The AFM scan size for the annealed samples is smaller than that for Figure 1, which changes the accessible q range and may influence the observed PSD. Please state the scan sizes and ensure that the before/after comparison is not affected by this difference.
Circularity Check
No significant circularity: the tunability claim is a direct measurement; the two-peak PSD decomposition is an acknowledged assumption, not a derivation from it.
full rationale
The paper's central result—that deposition rate changes the characteristic domain spacing—is an empirical correlation extracted from AFM PSDs and RSoXS. The PSD peak positions are measured quantities; the rate dependence is not imposed by the fitting model. The main validity caveat is the authors' own statement in the AFM Power Spectral Density Analysis section: 'Samples deposited at 0.04 and 0.08 nm/s appear to have a single broad feature that, for now, we will claim is the convolution of two length scales... Therefore, the uncertainty in peak position is greater for these two lower deposition rates, leading to the larger error bars and possibly the apparent increase in q-position for the high-q peak in the Rdep = 0.04 nm/s sample.' This is an underdetermined decomposition, but it is an explicit modeling assumption, not a circular derivation: the two-Gaussian fit does not force the reported monotonic shift of peak 2, and for the two highest rates the two peaks are clear. Similarly, the ISI analysis fits a weighted sum of contrast functions and reports the fitted A values; that is parameter reporting, not a prediction made from the fitted parameter. The self-citations, notably ref. 39 for NEXAFS contrast functions, provide empirical spectral references and are not load-bearing for the central rate-dependence claim, which rests on direct imaging/scattering observations. No equation in the paper defines the deposition-rate length-scale relation in terms of itself, and no uniqueness theorem is imported. The paper is therefore not circular; concerns about the two-peak decomposition belong to correctness/robustness, not circularity.
Assumptions & free parameters
free parameters (3)
- A (composition weighting factor) =
e.g., 85–90% for peak 1, 100% for peak 2
- B (multiplicative scale) =
not reported numerically
- E0 (energy offset) =
not reported numerically
assumptions (5)
- domain assumption Surface equilibration mechanism: molecules at the free surface have enhanced mobility and partially equilibrate before being buried.
- domain assumption Percolation-to-cluster transition (PCT) framework of Takeno and Hashimoto describes the morphological coexistence.
- ad hoc to paper Films contain no internal voids; all vacuum contrast in RSoXS arises from surface roughness.
- ad hoc to paper The two Gaussian peaks in PSD decomposition adequately represent the underlying length-scale distribution.
- domain assumption Reference NEXAFS spectra from prior work are representative of the molecular conformations in the present films.
Cite this review
Pith. "Pith review of Kinetically-Arrested Phase Separation leads to Tunable Domain Structures in Vapor-Deposited Glasses." pith.science (2026). https://pith.science/paper/MBJSZAFX
@misc{pith2026260720066,
  author       = {Pith},
  title        = {Pith review of: Kinetically-Arrested Phase Separation leads to Tunable Domain Structures in Vapor-Deposited Glasses},
  year         = {2026},
  howpublished = {\url{https://pith.science/paper/MBJSZAFX}},
  note         = {Machine review of arXiv:2607.20066}
}
read the original abstract
The characteristic length scale of phase-separated organic thin film blends is a critical structural parameter governing the performance and functionality of organic electronic devices. The arrested morphologies of vapor-deposited organic thin films result from the interplay between thermodynamic driving forces and kinetic constraints during deposition. Here, we aim to isolate the role of kinetic effects in phase separation by varying the deposition rate at a constant substrate temperature for a co-deposited molecular glass blend of N,N'-bis(3-methylphenyl)-N,N'-diphenylbenzidine (TPD) and Disperse Orange 37 (DO37). The dependence of morphology on deposition rate is quantified using power spectral density (PSD) analysis of atomic force microscopy (AFM) images. Two distinct deposition rate-dependent length scales at the surface reveal how deposition kinetics directly influence domain size and film topography. Complementary Resonant Soft X-ray Scattering (RSoXS) measurements indicate that phase separation extends throughout the film thickness. These observations are consistent with the surface equilibration mechanism previously described for homogeneous vapor-deposited films, in which enhanced surface mobility allows molecules in the growing film to partially equilibrate into distinct surface-templated states during deposition. In the current work, this mechanism allows the multi-component blend to phase separate and coarsen into a structure with multiple length scales before kinetically arresting to an extent that depends on the deposition rate. The demonstration of finely tunable domain size with deposition rate provides strategies to design new organic electronic devices with desired morphologies.
Figures


Figures from the paper (1 more)
Reference graph
Works this paper leans on
-
[1]
Phase separation analysis of bulk heterojunctions in small-molecule organic solar cells using zinc-phthalocyanine and C${}_{60}$,
1 C. Schünemann, D. Wynands, L. Wilde, M.P. Hein, S. Pfützner, C. Elschner, K.-J. Eichhorn, K. Leo, and M. Riede, “Phase separation analysis of bulk heterojunctions in small-molecule organic solar cells using zinc-phthalocyanine and C${}_{60}$,” Phys. Rev. B 85(24), 245314 (2012). 2 X. Yi, Z. Peng, B. Xu, D. Seyitliyev, C.H.Y. Ho, E.O. Danilov, T. Kim, J....
2012
-
[2]
Critical Role of Polymer Aggregation and Miscibility in Nonfullerene- Based Organic Photovoltaics,
Gundogdu, H. Ade, and F. So, “Critical Role of Polymer Aggregation and Miscibility in Nonfullerene- Based Organic Photovoltaics,” Advanced Energy Materials 10(8), 1902430 (2020). 3 Y. Li, Y. Deng, B. Deng, J. Lv, H. Chen, J. Liang, T. Xu, L. Zhang, J. Li, X. Li, and J. Zhang, “Insulating Polymer Optimized Vertical Phase Separation Enables Organic Bulk Het...
2020
-
[3]
Interplay between Glass Formation and Liquid– Liquid Phase Separation Revealed by the Scattering Invariant,
Ragulskaya, A. Mariani, F. Zhang, and F. Schreiber, “Interplay between Glass Formation and Liquid– Liquid Phase Separation Revealed by the Scattering Invariant,” J. Phys. Chem. Lett. 11(17), 7273–7278 (2020). 19 A. Girelli, H. Rahmann, N. Begam, A. Ragulskaya, M. Reiser, S. Chandran, F. Westermeier, M
2020
-
[4]
Microscopic Dynamics of Liquid-Liquid Phase Separation and Domain Coarsening in a Protein Solution Revealed by X-Ray Photon Correlation Spectroscopy,
Sprung, F. Zhang, C. Gutt, and F. Schreiber, “Microscopic Dynamics of Liquid-Liquid Phase Separation and Domain Coarsening in a Protein Solution Revealed by X-Ray Photon Correlation Spectroscopy,” Phys. Rev. Lett. 126(13), 138004 (2021). 20 J. Hansen, C.J. Moll, L. López Flores, R. Castañeda-Priego, M. Medina-Noyola, S.U. Egelhaaf, and F. Platten, “Phase ...
2021
-
[5]
usnistgov/PyHyperScattering,
Sunday, J. Guyer, J. Avery, and A.J. Levin, “usnistgov/PyHyperScattering,” (2023). 22 45 P. Virtanen et. al. “SciPy 1.0: fundamental algorithms for scientific computing in Python,” Nat Methods 17(3), 261–272 (2020). 46 B. Watts, “Calculation of the Kramers-Kronig transform of X-ray spectra by a piecewise Laurent polynomial method,” Opt. Express, OE 22(19)...
2023
-
[6]
High-density stable glasses formed on soft substrates,
Zhernenkov, B. Mcclimon, and Z. Fakhraai, “High-density stable glasses formed on soft substrates,” Nat. Mater. 23(5), 688–694 (2024). 50 C.E. Merzougui, F. Malloggi, H. Henry, A. Bounjad, A. Wu, C. Chevarin, J.-P. Mericq, D. Bouyer, and P. Guenoun, “Dynamics of Thermally Induced Phase Separation in Polyvinyl Alcohol Aqueous Solutions: Impact of Viscosity ...
arXiv 2024
Reviewed August 1, 2026 · model on record in the stance chip above.
Discussion (0). Continue with ORCID to comment.