REVIEW 2 major objections 5 minor 61 references
Four-band radio flux monitoring of 361 AGN improves geodetic VLBI signal-to-noise predictions.
Reviewed by Pith at T0; open to challenge. T0 means a machine referee read the full paper against a public rubric. the ladder, T0–T4 →
T0 review · deepseek-v4-flash
2026-08-01 09:41 UTC pith:MJPTZ3RD
load-bearing objection Solid, honest catalog paper with a genuinely useful new dataset; the S/N-prediction gain is real but rests on an acknowledged, untested spatial-scaling assumption. the 2 major comments →
A multi-band radio flux density catalog of ICRF3 sources using the Onsala Twin Telescopes
The pith
A machine-rendered reading of the paper's core claim, the machinery that carries it, and where it could break.
Core claim
On the paper's own terms, the central discovery is that a compact two-element interferometer can serve as a dedicated VGOS-band flux monitor: by correlating the twin antennas, calibrating against standard flux-density calibrators, and combining dedicated monthly sessions with international VGOS observing sessions, the authors obtained usable multi-epoch measurements in four bands for 361 sources. The resulting light curves show that most sources are variable — 64% have a modulation index above 0.1 at 10.4 GHz — and that spectra are predominantly flat or inverted. When flux densities from this catalog, updated to the latest month before each session, were used to predict the S/N of 2025 geode
What carries the argument
The load-bearing mechanism is the conversion from measured antenna correlation amplitude to absolute flux density, combined with the standard VLBI sensitivity relation that ties observing time to flux density, system equivalent flux densities, and bandwidth. The twin telescopes, separated by 75 meters, measure spatially unresolved total flux densities; these are scaled absolutely using three calibrator sources with known spectra. To predict geodetic S/N on longer baselines, the measured total flux density is rescaled to each baseline-length bin of the current VGOS catalog under the assumption that fractional flux changes are identical at all spatial scales. The paper's S/N test then compares
Load-bearing premise
The load-bearing premise is that a fractional change in total flux density measured on the 75-meter baseline applies equally to all longer baselines; if source variability is not scale-invariant, the improved S/N predictions for variable sources are partly an artefact of the catalog's source-structure model.
What would settle it
Take a sample of variable sources from the catalog, observe them simultaneously with the twin telescopes and with a long-baseline VGOS network over multiple epochs, and compare fractional flux changes per baseline bin. If resolved sources show systematically different fractional variability on long versus short baselines, the scale-invariance assumption fails; if not, the catalog's S/N predictions are robust.
If this is right
- VGOS scheduling can be made adaptive: monthly flux updates let planners shorten scans of flaring sources and lengthen scans of fading ones, improving yield without changing sensitivity requirements.
- Highly variable sources, currently a source of failed or wasteful observations, can be identified in advance from their light curves and assigned updated flux densities.
- The multi-band light curves provide a ready-made sample for studying AGN variability and spectral-index evolution, including flaring events such as the order-of-magnitude brightening seen for one source.
- The monitoring approach can be extended to additional twin-telescope stations and to a wider source list, potentially covering the full VGOS source population and the southern sky.
- Because the static catalog underestimates current flux densities, its continued use likely over-allocates observing time; replacing it with updated values increases scheduling efficiency.
Where Pith is reading between the lines
- The paper does not test whether the variability amplitude is scale-independent; a same-epoch long-baseline imaging campaign would settle whether the improved S/N predictions for variable sources come from the monitoring data or from the catalog's source-structure model.
- The measured bandpass efficiency (0.92) comes from one backend unit; S/N predictions for networks with other backend hardware will need their own efficiency factors, though the absolute flux densities themselves are unaffected.
- The method could be extended to measure cross-baseline correlation amplitudes within a network of twin stations, yielding source-structure information without full imaging and reducing the need for the scale-invariance assumption.
- The observed preponderance of flat or inverted spectra and spectral-index flips during flares offers a testbed for synchrotron self-absorption models, though robust fits to individual sources will require a peaked-spectrum model rather than a simple power law.
Editorial analysis
A structured set of objections, weighed in public.
Referee Report
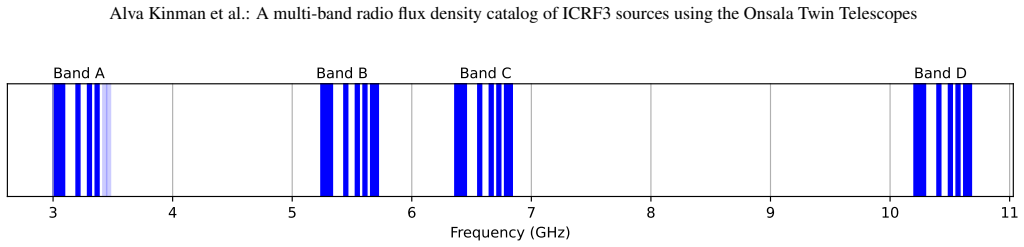
Summary. The paper presents multi-epoch, four-band (3.2, 5.5, 6.6 and 10.4 GHz) flux density measurements of 361 ICRF3 sources made with the Onsala Twin Telescopes as a 75 m single-baseline interferometer. Calibration uses CASA, phase-calibration tone flagging, absolute flux scaling to Perley & Butler (2017) models of 3C147, 3C286 and 3C295, RFI/sub-band outlier filtering, and error bars that combine a random component with a 3% systematic term validated by a reduced chi-square analysis. The resulting light curves are published as a catalog. As an application, predicted signal-to-noise ratios for 2025 VGOS sessions are computed from Eq. (6), where the OTT total flux density is used to scale the baseline-length bins of flux.cat.vgos (§4.1), and are compared with observed S/Ns. The authors report that the new flux densities predict geodetic S/N more precisely than the standard VGOS catalog, especially for the most variable sources.
Significance. If the claims hold, this is a genuinely useful community resource: the first systematically monitored VGOS-band flux catalog, with simultaneous four-band light curves for 361 sources (269 with at least five epochs), directly relevant to VGOS scheduling and to AGN variability studies. The strengths are substantial and should be credited: external absolute calibration against well-studied standards, explicit per-sub-band error propagation, a 3% systematic term whose size is checked with chi-square statistics on stable sources, transparent outlier filtering, and a public, continuously updated catalog with pipeline code. The S/N comparison is a valuable first step, but the headline claim of improved prediction rests on an untested baseline-scaling assumption and on the choice of dispersion metric. The catalog itself is likely to be of immediate use regardless of the outcome of that comparison.
major comments (2)
- [§4.1, Eq. (6) and Table 1] The S/N prediction for long baselines is obtained by scaling every baseline-length bin of flux.cat.vgos by the ratio of the OTT total flux density to the 0–1000 km bin value. The paper acknowledges that this assumes a change in flux density has the same relative size on all spatial scales and expects discrepancies for non-compact sources, but no test of this assumption is provided. Because Case 1 and Case 2 share the same baseline-shape model, the reported improvement in MAD for variable sources (Table 1, Fig. 7) could be driven by the total-flux normalization update alone and may not reflect an accurate long-baseline flux. Please add a robustness check: for example, compare predicted/observed S/N as a function of projected baseline length, or repeat Case 2 using only the 0–1000 km bin, and quantify how plausible changes in the source-structure shape would affect the claimed gain. If suc
- [§4.2, Table 1] The quantitative support for 'more precisely predict' is metric-dependent. For all observations, the raw MADs are similar or worse in Case 2 for bands B–D (0.34 vs 0.36, 0.39 vs 0.42, 0.61 vs 0.61); the improvement appears only after dividing each distribution by its median. For the 20 most variable sources the raw MAD does improve in bands B–D, but this is a small sample and the medians also differ substantially (e.g., 1.47 vs 1.67 in band D). The abstract should state explicitly that the improvement is in median-scaled dispersion, and the raw values should be reported alongside. If the practical scheduling metric is absolute S/N accuracy, the large Case 2 medians (1.26–1.49) represent a systematic overprediction that needs to be acknowledged as a limitation for direct scheduling use.
minor comments (5)
- [§4.1, Appendix E] The absolute S/N scale uses η_B = 0.92 measured from a single DBBC3 unit and applies it to all stations. The paper notes that some stations use RDBE back ends. While this cancels in a fully relative comparison, the sample includes a mix of back ends; a sentence quantifying the sensitivity of the MAD comparison to η_B in the plausible 0.92–1.0 range would be helpful.
- [Table 1] The table layout is difficult to read: the paired Case 1/Case 2 columns are not visually separated, and the 'median-scaled' rows are easy to miss. Consider splitting into separate tables or using clearer column groupings.
- [§2.5] The description of the 3σ criterion says 'if the XX or YY amplitude was smaller than three times the corresponding uncertainty'; this should be 'smaller than three times' or 'less than 3σ' for clarity, though the meaning is clear from context.
- [§5.3] The statement that an S/N < 7 leads to an amplitude error > 1% via Eq. (9.65) of Thompson et al. (2017) would benefit from the explicit equation or a page reference, since this threshold is used to justify the amplitude-averaging approach.
- [Author affiliations] Minor typo: 'on the leave from Chalmers' should read 'on leave from Chalmers'.
Circularity Check
No significant circularity: flux densities are externally calibrated and S/N predictions are tested against independent observed S/Ns.
full rationale
The central flux densities are measured from OTT correlation amplitudes and placed on an absolute scale using Perley & Butler (2017) calibrator models (Section 2.4), not fitted to the S/N quantities later predicted. The S/N prediction comparison (Section 4) uses observed S/N from independent VGOS database files; Eq. (6) is the standard radiometer equation and contains no free parameter fitted to the data. The only internally estimated coefficient, eta_B = 0.92, is a measured DBBC3 bandpass factor (Appendix E) and cancels in the median-scaled MAD comparison. The Case 2 predictions do scale an external baseline-shape model (flux.cat.vgos) by the measured total flux densities, and the paper explicitly acknowledges the assumption that relative flux changes are identical on all spatial scales; this is a stated approximation, not an identity that makes the predicted S/N equal to the input by construction. The improvement claim is tested against observed S/Ns, so it is falsifiable rather than circular. The chi-square validation in Section 5.2 deliberately uses leave-one-out scaling to avoid calibrators validating themselves, and the pipeline self-citations (Varenius et al. 2022; Kinman et al. 2025a) are method descriptions with the code included, not load-bearing results. No equation or fitted parameter reduces the catalog or its S/N prediction to its own inputs.
Axiom & Free-Parameter Ledger
free parameters (6)
- Systematic error term =
3% of flux density, added in quadrature
- Sub-band deviation threshold =
15% deviation from the sub-band median within a band
- Scan outlier threshold =
5 median absolute deviations (MAD) from the median
- Minimum surviving sub-bands =
4 sub-bands
- Bandpass efficiency eta_B =
0.92
- Amplitude detection threshold =
3σ (XX or YY amplitude below 3× uncertainty)
axioms (5)
- domain assumption The radiometer/S-N relation (Eq. 1/6) with η = 0.786 applies to VGOS observations.
- domain assumption The Perley & Butler (2017) flux density scale for 3C147, 3C286, and 3C295 is stable and accurate in the VGOS bands.
- ad hoc to paper A change in total flux density scales identically at all spatial scales / baseline lengths.
- domain assumption Flat gain curve and negligible atmospheric opacity for the OTT.
- domain assumption Phase interpolation between sparse fringe-fit solutions is valid, and residual 2-hour phase oscillations do not bias amplitude averaging.
read the original abstract
The VLBI Global Observing System (VGOS) is the next generation system for geodetic and astrometric Very Long Baseline Interferometry (VLBI). To optimize the observing time for each source in geodetic schedules, a flux density catalog is needed for the sources that are observed at the VGOS frequencies. The aim of this work is to monitor the flux densities of geodetic sources in the VGOS bands. The obtained flux density time series can be used for more effective scheduling of geodetic and astrometric VLBI experiments, as well as probing active galactic nuclei (AGN) physics. The Onsala Twin Telescopes have been used as a single baseline interferometer to measure flux densities of AGN that are part of the International Celestial Reference System (ICRF3). The telescopes observed at 3.2, 5.5, 6.6 and 10.4 GHz simultaneously. Both locally planned flux monitoring sessions and international geodetic experiments were analyzed. The data were calibrated using the Common Astronomy Software Applications (CASA). The possibility of predicting geodetic signal-to-noise ratios (S/N) using the measured flux densities was also tested. Simultaneous light curves in up to four frequencies have been obtained for 361 sources. The majority of the sources vary significantly in flux density during the measurement period. Most sources have a flat or inverted spectrum, with only 6 % having a steep spectrum. Furthermore, the flux densities from this work were shown to more precisely predict geodetic signal-to-noise ratios compared to the standard VGOS flux density catalog, especially for the most variable sources. Flux density variation needs to be taken into account to obtain the most optimal VGOS schedules. The flux density catalog presented here is expected to be of use for both astronomy and geodesy. We plan to continue the monitoring program.
Figures


Reference graph
Works this paper leans on
-
[1]
Time-Integrated Neutrino Source Searches with 10 Years of IceCube Data. , keywords =. doi:10.1103/PhysRevLett.124.051103 , archivePrefix =. 1910.08488 , primaryClass =
arXiv 1910
-
[2]
Evidence for Neutrino Emission from X-Ray-bright Active Galactic Nuclei with IceCube. , keywords =. doi:10.3847/2041-8213/ae4aad , archivePrefix =. 2510.13403 , primaryClass =
arXiv 2041
-
[3]
ITRF2020: an augmented reference frame refining the modeling of nonlinear station motions. , keywords =. doi:10.1007/s00190-023-01738-w , adsurl =
-
[4]
arXiv , Author =:1307.6212 , Journal =
doi:10.1051/0004-6361/201322068 , Eid =. arXiv , Author =:1307.6212 , Journal =
-
[5]
The Astropy Project: Building an Open-science Project and Status of the v2.0 Core Package. , keywords =. doi:10.3847/1538-3881/aabc4f , archivePrefix =. 1801.02634 , primaryClass =
-
[6]
The Astropy Project: Sustaining and Growing a Community-oriented Open-source Project and the Latest Major Release (v5.0) of the Core Package. , keywords =. doi:10.3847/1538-4357/ac7c74 , archivePrefix =. 2206.14220 , primaryClass =
-
[7]
Radio Variability of Radio-quiet and Radio-loud Quasars. , keywords =. doi:10.1086/425859 , archivePrefix =. astro-ph/0409554 , primaryClass =
-
[8]
Report on New VGOS Frequency Sequences Test Observations , author=. Proc. of the 27th EVGA Working Meeting , pages=. 2025 , editor=
2025
-
[9]
, keywords =
The absolute spectrum of Cas A: an accurate flux density scale and a set of secondary calibrators. , keywords =
-
[10]
Recent progress in the VLBI2010 development , booktitle=
Behrend, Dirk and B. Recent progress in the VLBI2010 development , booktitle=. 2009 , publisher=
2009
-
[11]
The VGOS High Road: From Inception and Prototyping to Operations to Maturation and Beyond. Proc. of the 26th EVGA Working Meeting , year = 2023, editor =. doi:10.14459/2023md1730292 , adsurl =
-
[12]
Relativistic Jets from Active Galactic Nuclei. , keywords =. doi:10.1146/annurev-astro-081817-051948 , archivePrefix =. 1812.06025 , primaryClass =
-
[13]
Precession-induced Variability in AGN Jets and OJ 287. , keywords =. doi:10.3847/1538-4357/accbbc , archivePrefix =. 2307.05838 , primaryClass =
-
[14]
CASA, the Common Astronomy Software Applications for Radio Astronomy. , keywords =. doi:10.1088/1538-3873/ac9642 , archivePrefix =. 2210.02276 , primaryClass =
-
[15]
2025 , doi =
Deriving a VGOS-band flux density catalog from real geodetic VLBI observations , booktitle =. 2025 , doi =
2025
-
[16]
The third realization of the International Celestial Reference Frame by very long baseline interferometry. , keywords =. doi:10.1051/0004-6361/202038368 , archivePrefix =. 2010.13625 , primaryClass =
arXiv 2010
-
[17]
VGOS band SNRs from channel fringe visibilities , journal =
-
[18]
DiFX: A Software Correlator for Very Long Baseline Interferometry Using Multiprocessor Computing Environments. , keywords =. doi:10.1086/513572 , archivePrefix =. astro-ph/0702141 , primaryClass =
-
[19]
Sked -- VLBI scheduling software , publisher =
-
[20]
Improvement of the IVS-INT01 sessions by source selection: development and evaluation of the maximal source strategy. , keywords =. doi:10.1007/s00190-015-0873-6 , adsurl =
-
[21]
AIPS Memo Series , year =
The FITS interferometry data interchange convention—Revised. AIPS Memo Series , year =
-
[22]
IVS 2022 General Meeting Proceedings , editor=
Alternative Frequency Setups for VGOS , author=. IVS 2022 General Meeting Proceedings , editor=
2022
-
[23]
Status of the Spectrum Management for VGOS , author=. Proc. of the 27th EVGA Working Meeting , editor=
-
[24]
CRATES: An All-Sky Survey of Flat-Spectrum Radio Sources. , keywords =. doi:10.1086/513742 , archivePrefix =. astro-ph/0702346 , primaryClass =
-
[25]
Long-term radio variability of AGN: flare characteristics. , keywords =. doi:10.1051/0004-6361:200809806 , archivePrefix =. 0805.1283 , primaryClass =
-
[26]
Relativistic Jets of Blazars , journal =
Talvikki Hovatta and Elina Lindfors , keywords =. Relativistic Jets of Blazars , journal =. 2019 , issn =. doi:https://doi.org/10.1016/j.newar.2020.101541 , url =
arXiv 2019
-
[27]
Milliarcsecond core size dependence of the radio variability of blazars. , keywords =. doi:10.1093/mnras/stad2525 , archivePrefix =. 2308.09626 , primaryClass =
-
[28]
Calibration and imaging of 7 mm VLBA observations of the AGN jet in M 87
rPICARD: A CASA-based calibration pipeline for VLBI data. Calibration and imaging of 7 mm VLBA observations of the AGN jet in M 87. , keywords =. doi:10.1051/0004-6361/201935181 , archivePrefix =. 1905.01905 , primaryClass =
Pith/arXiv arXiv 1905
-
[29]
Monitoring of 3C 286 with ALMA, IRAM, and SMA from 2006 to 2025: Stability, Synchrotron Ages, and Frequency-dependent Polarization Attributed to Core-shift. , keywords =. doi:10.3847/1538-4357/ae10b1 , archivePrefix =. 2510.05540 , primaryClass =
arXiv 2006
-
[30]
2025 , doi =
Triple-twin flux density monitoring at VGOS frequencies , booktitle =. 2025 , doi =
2025
-
[31]
Flux density monitoring at VGOS frequencies with the Onsala Twin Telescopes. Proc. of the 27th EVGA Working Meeting
-
[32]
A new method for estimating frequency-dependent core shifts in active galactic nucleus jets. , keywords =. doi:10.1111/j.1365-2966.2011.18808.x , archivePrefix =. 1106.0069 , primaryClass =
arXiv 2011
-
[33]
Multimessenger Picture of J1048+7143. , keywords =. doi:10.3847/1538-4357/ac9cce , archivePrefix =. 2209.05107 , primaryClass =
-
[34]
, year = 2019, volume =
Gravitational deformation of ring-focus antennas for VGOS: first investigations at the Onsala twin telescopes project. , year = 2019, volume =
2019
-
[35]
The Australian mixed-mode observing program. , keywords =. doi:10.1007/s00190-022-01657-2 , adsurl =
-
[36]
Superluminal Motion of the Radio Core of BL Lacertae: 1980.4-1988.3. , keywords =. doi:10.1086/168517 , adsurl =
-
[37]
International VLBI Service for Geodesy and Astrometry: Delivering high-quality products and embarking on observations of the next generation. , keywords =. doi:10.1007/s00190-016-0950-5 , adsurl =
-
[38]
Active galactic nuclei: what's in a name?. , keywords =. doi:10.1007/s00159-017-0102-9 , archivePrefix =. 1707.07134 , primaryClass =
-
[39]
Towards an astronomical use of new-generation geodetic observations. I. From the correlator to full-polarization images. , keywords =. doi:10.1051/0004-6361/202348633 , archivePrefix =. 2406.12509 , primaryClass =
-
[40]
An Accurate Flux Density Scale from 50 MHz to 50 GHz. , keywords =. doi:10.3847/1538-4365/aa6df9 , archivePrefix =. 1609.05940 , primaryClass =
-
[41]
Progress Report of the IVS VLBI2010 Committee, June 2009
Design Aspects of the VLBI2010 System. Progress Report of the IVS VLBI2010 Committee, June 2009
2009
-
[42]
The variability of blazars throughout the electromagnetic spectrum. , keywords =. doi:10.1007/s00159-025-00165-4 , archivePrefix =. 2511.18975 , primaryClass =
-
[43]
Blazars in the Fermi Era: The OVRO 40 m Telescope Monitoring Program. , keywords =. doi:10.1088/0067-0049/194/2/29 , archivePrefix =. 1011.3111 , primaryClass =
-
[44]
Structure of the nucleus of 1928+738. , keywords =. doi:10.1051/0004-6361/201425057 , archivePrefix =. 1412.4909 , primaryClass =
Pith/arXiv arXiv 1928
-
[45]
Connections between millimetre continuum variations and VLBI structure in 27 AGN. , keywords =. doi:10.1051/0004-6361:20021236 , adsurl =
-
[46]
, year = 2019, month = aug, volume =
VieSched++: A New VLBI Scheduling Software for Geodesy and Astrometry. , year = 2019, month = aug, volume =. doi:10.1088/1538-3873/ab1820 , adsurl =
-
[47]
, volume=
Bridging astronomical, astrometric and geodetic scheduling for VGOS , author=. , volume=. 2023 , publisher=
2023
-
[48]
Optimizing VGOS observations using an SNR-based scheduling approach. , keywords =. doi:10.1186/s40623-025-02158-0 , archivePrefix =. 2407.13323 , primaryClass =
-
[49]
, year = 2012, month = oct, volume =
VLBI: A fascinating technique for geodesy and astrometry. , year = 2012, month = oct, volume =. doi:10.1016/j.jog.2012.07.007 , adsurl =
-
[50]
The effects of frequency-dependent quasar variability on the celestial reference frame. , keywords =. doi:10.1007/s00190-014-0706-z , archivePrefix =. 1306.0696 , primaryClass =
-
[51]
The radio spectral turnover of radio-loud quasars at z > 5. , keywords =. doi:10.1051/0004-6361/202142489 , archivePrefix =. 2112.03133 , primaryClass =
-
[52]
OJ 287: Binary Pair of Supermassive Black Holes. , keywords =. doi:10.1086/166033 , adsurl =
-
[53]
Astronomische Nachrichten , keywords =
Characterization of variability in blazar light curves. Astronomische Nachrichten , keywords =. doi:10.1002/asna.202013731 , archivePrefix =. 2006.05166 , primaryClass =
Pith/arXiv arXiv 2006
-
[54]
Astrometry and geodesy with radio interferometry: experiments, models, results. , keywords =. doi:10.1103/RevModPhys.70.1393 , archivePrefix =. astro-ph/9712238 , primaryClass =
-
[55]
2017 , publisher=
Interferometry and synthesis in radio astronomy , author=. 2017 , publisher=
2017
-
[56]
An Investigation of Synchrotron Self-absorption and Free-Free Absorption Models in Explanation of the Gigahertz-peaked Spectrum of PKS 1718-649. , keywords =. doi:10.1086/376600 , adsurl =
-
[57]
Unified Schemes for Radio-Loud Active Galactic Nuclei. , keywords =. doi:10.1086/133630 , archivePrefix =. astro-ph/9506063 , primaryClass =
-
[58]
CASA on the Fringe-Development of VLBI Processing Capabilities for CASA. , keywords =. doi:10.1088/1538-3873/ac81ed , archivePrefix =. 2210.02275 , primaryClass =
-
[59]
NVI , author=
sked’s catalogs program reference manual. NVI , author=. Inc. NASA/Goddard Space Flight Center , year=
-
[60]
Broad band flux-density monitoring of radio sources with the Onsala twin telescopes. , keywords =. doi:10.1007/s10686-022-09867-4 , archivePrefix =. 2203.08590 , primaryClass =
-
[61]
Imaging VGOS Observations and Investigating Source Structure Effects. (Solid Earth) , keywords =. doi:10.1029/2020JB02123810.1002/essoar.10504599.1 , adsurl =
discussion (0)
Sign in with ORCID, Apple, or X to comment. Anyone can read and Pith papers without signing in.