REVIEW 3 major objections 4 minor 32 references
Using a consensus of four unsupervised detectors, the paper shows that Ghana's malaria anomalies concentrate in specific regions and that the districts with the most anomalous months are not the ones with the heaviest burden.
Reviewed by Pith at T0; open to challenge. T0 means a machine referee read the full paper against a public rubric. the ladder, T0–T4 →
T0 review · deepseek-v4-flash
2026-08-01 07:03 UTC pith:SK3P5A3K
load-bearing objection Useful regional malaria anomaly maps, but the burden-vs-frequency claim is unsupported by the documented pipeline and the statistical validation is circular—send it back for serious revision, don't desk-reject. the 3 major comments →
Unsupervised Consensus-Based Anomaly Detection for Spatiotemporal Malaria Incidence in Ghana
The pith
A machine-rendered reading of the paper's core claim, the machinery that carries it, and where it could break.
Core claim
On the paper's own terms, the central discovery is that anomaly burden and anomaly frequency are distinct spatial dimensions of malaria risk in Ghana. Over 2014–2023, 1908 region-month observations were scored by four unsupervised algorithms (isolation forest, local outlier factor, autoencoder, elliptic envelope); agreement by three or more defined an anomaly. Anomalous months formed a statistically distinct population with much higher total cases (Cohen's d = 3.252), larger seasonal residuals (d = 1.383), and larger region-standardised deviations (d = 1.245). Spatially, most recurrent anomalies concentrated in Ashanti and Northern regions, with Tamale, Kumasi and Accra as persistent distric
What carries the argument
The load-bearing object is a consensus anomaly score, S, equal to the number of four detectors—Isolation Forest, Local Outlier Factor, autoencoder, and Elliptic Envelope—that classify a region-month as anomalous; S ≥ 3 is called an anomaly. Each detector works on nine engineered features: total cases, previous-month cases, seasonal residual, region z-score, sine/cosine month encoding, trend year, and under-5/over-5 counts. The consensus vote avoids calibrating heterogeneous scores and gives an interpretable confidence level. For district-level maps, the anomaly months assigned to a region are inherited by all districts in that region; district burden during those months is then interpolated
Load-bearing premise
The load-bearing premise is that district-level anomaly frequency can be read from regional anomaly classifications: in the district analyses, every district in a region is assigned the same anomalous months as its region, so the claim that Tamale has high burden while Ashanti districts have high anomaly frequency is only demonstrated at the regional level.
What would settle it
Re-run the pipeline at district level: build the same features from each district's own time series, compute consensus anomaly flags per district, and then compare Tamale's anomaly-associated burden against Ashanti district anomaly rates. If the burden-frequency separation no longer appears—for example, if high-frequency districts are also the high-burden districts—the paper's key spatial claim is refuted.
If this is right
- Malaria burden alone is an incomplete picture: surveillance dashboards that add consensus anomaly flags gain a second, partially independent risk dimension.
- Persistent anomaly hotspots—Tamale, Kumasi, Accra—are stable enough across 2014–2023 to be treated as priority sites for investigation and resource planning.
- Because anomalous months are statistically separable with very large effect sizes, anomaly flags can be used as review triggers even in regions with low absolute case counts.
- The unsupervised consensus framework requires no outbreak labels and can be applied to other endemic diseases with routine surveillance panels.
- The spatial mismatch between burden and anomaly frequency implies that intervention targeting should consider transmission instability, not just caseload.
Where Pith is reading between the lines
- A district-level reanalysis, with anomalies computed per district rather than inherited from the region, is the direct test of the burden-frequency split; if the split disappears, the spatial claim reduces to a regional difference.
- If the split survives, anomaly frequency could be used as a routine indicator of transmission instability and combined with case counts to produce a two-axis risk classification for districts.
- Pairing the anomaly flags with rainfall, temperature, intervention and population data—factors the paper names but does not model—would let health authorities test whether the seasonal clustering has environmental drivers.
- The highlights list includes a stray sentence about 'insurance data'; it matches no analysis in the paper and should be set aside as an editorial artifact.
Editorial analysis
A structured set of objections, weighed in public.
Referee Report
Summary. The manuscript develops a consensus-based unsupervised anomaly detection framework for monthly malaria surveillance data in Ghana (2014-2023). District-level admissions are aggregated to 16 regions; nine features (total cases, lag, seasonal residual, regional z-score, calendar encoding, trend, age-specific counts) are used to run Isolation Forest, Local Outlier Factor, Autoencoder, and Elliptic Envelope. Region-month observations flagged by at least three of the four detectors are classified as anomalies. The paper reports that anomalies concentrate in Ashanti and Northern Regions, that Tamale carries the largest anomaly burden, and that high anomaly rates cluster in a set of Ashanti districts, leading to a claimed spatial distinction between burden and anomaly frequency. It also reports large and highly significant differences between anomalous and normal months on total cases, seasonal residual, and regional z-score.
Significance. If the findings were robust, the paper would offer a practical, interpretable anomaly-detection workflow for routine malaria surveillance and a descriptive atlas of where Ghanaian transmission departs from expected seasonality. The writing is clear, the four-detector consensus design is sensible, and the authors are explicit about many limitations, including the retrospective nature of the analysis and the lack of causal attribution. However, the two principal claims are not supported by the evidence as presented: the district-level burden-frequency distinction relies on a district-level anomaly map that cannot be derived from the documented region-level pipeline, and the statistical separation in Table 2 is an artefact of testing the same features that define the labels. As a result, the central public-health message of the paper is not established by the current analysis.
major comments (3)
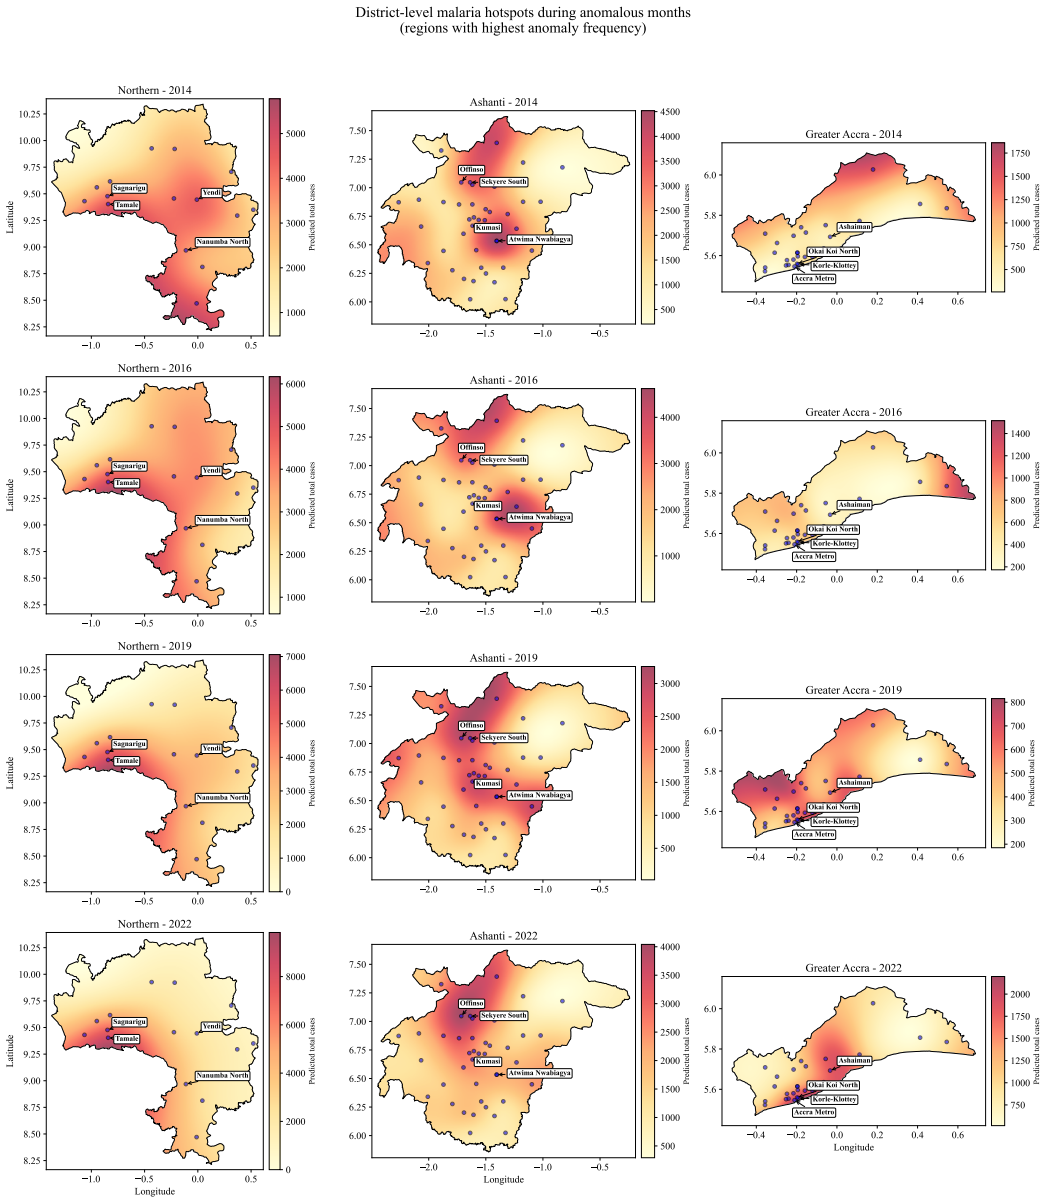
- [Section 3.3, Figs. 11 and 13] The district-level analysis is not supported by the methods. Section 2.1 aggregates districts to regions and Section 2.3 applies the four detectors to region-month observations. Figure 11 confirms that all districts in a given region share the same number of anomalous months (37 for Northern, 46 for Ashanti, 11 for Greater Accra). Under the documented pipeline, district anomaly rates are constant within each region: 30.8%, 38.3%, and 9.2%, respectively. Figure 13, however, shows per-district anomaly rates varying up to about 40% and labels Adansi/Afigya Kwabre as high-rate districts. No separate district-level detection is described in Methods, and the Limitations section explicitly states that detection is performed independently for each region. If a district-level run was performed, it is missing from Section 2.3; if not, Figure 13 cannot be produced from the stated methods. The centr
- [Section 3.4, Table 2] The statistical validation is circular. The features tested in Table 2 - total_cases, residual, and region_zscore - are inputs to the four anomaly detectors (Section 2.2, Eqs. (1)-(3)), and the anomalous/normal labels are defined by a consensus threshold on those detectors' outputs (Eq. (17)). Large Mann-Whitney statistics and Cohen's d values (e.g., d=3.252 for total cases) are therefore expected by construction and do not independently demonstrate that anomalous months form a distinct epidemiological population. The problem is compounded by the in-sample nature of the baselines: Eq. (2) uses the full-period seasonal mean and Eq. (3) uses the full-period regional mean and standard deviation, so the comparison is not out-of-sample. Validation against external information (e.g., outbreak records, intervention events, or a hold-out period) or against a simpler univariate threshold baseline
- [Section 4, Limitations] The paper's own limitations contradict a key element of the results. Section 4 states that 'anomaly detection is performed independently for each region and therefore does not explicitly model spatial dependence among neighbouring regions.' This is consistent with the Methods, but it makes the district-level anomaly-frequency map in Figure 13 impossible to reconcile with the text unless a separate district-level detection exists. The discussion also claims that the framework 'captures both spatial and temporal variation,' yet the detector uses no spatial features and no district-level anomaly output is documented. This internal inconsistency affects the main conclusion of the manuscript, not a peripheral detail.
minor comments (4)
- [Highlights] The bullet point 'Advocates for advanced tools to manage complex insurance data effectively' appears unrelated to malaria surveillance and is likely a template leftover. It should be removed.
- [Section 2.4.5] The subsection heading 'RBF Spatial Interpolation for Spatial' appears truncated; the final word is missing.
- [Figure 15 caption] The caption uses 'Predicted total cases' for surfaces generated by interpolation. 'Interpolated total cases' would be clearer and avoid implying a forecasting model.
- [Data availability] The raw data are not public and no code repository is provided. Given the reliance on hyperparameters (contamination 0.10, LOF k=20, AE architecture, consensus threshold), releasing code would materially improve reproducibility.
Circularity Check
Statistical separation and district-level burden–frequency claim reduce to the anomaly-defining inputs and region-level flags.
specific steps
-
self definitional
[Section 2.2 (Eqs. 1–6), Section 2.3 (Eqs. 16–17), Section 3.4 (Table 2)]
"To enable the detection of multivariate anomalies, a set of features was constructed ... Each region–month observation was described by nine variables derived from the raw surveillance data. ... The outputs of the four anomaly detectors were combined into a consensus anomaly score ... observations were categorised as follows: Strong anomaly, if S=4; Moderate anomaly, if S=3; Normal, if S≤2. ... Total malaria cases exhibited the strongest separation ... Cohen's d value of 3.252 ... residual ... Cohen's d reached 1.383 ... Region z-score ... d of 1.245."
The same variables used to build the feature matrix—total_cases, residual, region_zscore—are the variables tested in Table 2 after the consensus rule (S≥3) has been applied. IF/LOF/AE/EE were fit on that matrix with 0.10 contamination and/or 90th-percentile thresholds, so the 'anomalous' class is defined by extremity in this exact feature space. Comparing anomalous versus normal months on those features is therefore a restatement of the classification rule rather than an independent test; the Cohen's d values summarize the in-sample separation used to define the groups. Eqs. (2)–(3) also compute seasonal and regional means over all 120 months, so each tested month contributes to its own baseline.
-
self definitional
[Section 2.1, Section 3.3 (Figs. 11–13), Section 4 Limitations]
"data aggregated from the district level to the regional level to enable a coherent spatiotemporal analysis of anomaly patterns ... all ten districts experienced the same number of anomalous months (37 months) ... All ten districts experienced 46 anomalous months ... The uniform occurrence of 11 anomalous months across all ten districts ... Comparison of Figs. 11 and 13 demonstrates that anomaly burden and anomaly frequency were spatially distinct. ... anomaly detection is performed independently for each region."
With detection performed only at the region-month level, the 37/46/11 anomalous-month counts in Fig. 11 are regional flags copied to every district. Hence each district's anomaly frequency is constant within its region: Northern ≈30.8%, Ashanti ≈38.3%, Greater Accra ≈9.2%. The 'Ashanti cluster of high anomaly rates' is just Ashanti's higher regional anomaly-month count, and Tamale's 'largest burden during anomalies' is just its case volume during Northern's 37 flagged months. The burden-vs-frequency distinction is thus an artifact of assigning regional anomaly months to districts, not a district-level finding; Fig. 13's within-region variation cannot follow from the documented pipeline.
full rationale
The paper's central quantitative claim that anomalous months are a statistically distinct population is a within-sample comparison of the same engineered features used to define the anomaly labels: the detectors flagged extreme observations in a feature space containing total_cases, residual, and region_zscore, and Table 2 then 'confirms' separation on those very features. This is validation by construction rather than independent evidence. Similarly, the headline spatial claim of burden-frequency dissociation depends on district-level anomaly frequencies, but the methods only document region-level detection and the paper itself states that detection is performed independently for each region. Figure 11 shows every district in a region inheriting the same 37/46/11 anomalous months, so the district-level frequency map in Fig. 13 is either an undocumented separate analysis or an artifact of region-level flags. The paper's self-citation to prior work [7] is background context and not load-bearing. There is no machine-checked or externally held-out validation that would break the circularity. Score 7 reflects that the central statistical and spatial claims reduce to the anomaly-defining inputs and region-level flags, though the anomaly detection pipeline itself is a genuine unsupervised analysis.
Axiom & Free-Parameter Ledger
free parameters (5)
- contamination fraction / percentile thresholds =
0.10 for IF and EE; 90th percentile for LOF and AE
- consensus threshold S =
S ≥ 3 of 4 detectors
- LOF neighbor count k =
20
- Autoencoder architecture and training =
9-4-9; Adam; batch 32; 150 epochs; early stopping on 10% validation
- In-sample seasonal mean and regional z-score baselines =
Computed over the full 2014-2023 period, including the evaluated month
axioms (5)
- domain assumption Each detector's statistical notion of unusualness (isolation path length, local density, reconstruction error, robust Mahalanobis distance) corresponds to an epidemiologically meaningful transmission anomaly.
- domain assumption The nine engineered features capture all relevant dimensions of abnormal malaria transmission.
- domain assumption DHIMS2 monthly case counts are complete and accurate enough for anomaly detection.
- ad hoc to paper Consensus of at least three of four detectors increases reliability.
- ad hoc to paper District-level anomaly frequency can be represented by the region-level anomaly classification.
read the original abstract
A consensus anomaly detection framework was applied to monthly malaria surveillance data from Ghana (2014-2023) to identify atypical transmission patterns. Anomalies were highly structured in space and time. Ashanti and Northern Regions accounted for most recurrent anomalies, with persistent hotspots at Tamale, Kumasi, and Accra. A key finding was the spatial distinction between anomaly burden (cumulative cases during anomalous periods) and anomaly frequency (persistence of unusual behaviour). Tamale had the highest burden during anomalies, whereas the highest anomaly rates clustered in Ashanti districts, showing that high-burden areas are not necessarily those with the most frequent anomalous transmission. Anomalous months formed a statistically distinct group, with much higher case counts (Cohen's $d = 3.252$) and large seasonal deviations ($d > 1.2$) compared with normal months. Malaria burden alone provides an incomplete picture of transmission dynamics. By distinguishing where malaria is most prevalent from where transmission behaves most unusually, this framework can strengthen surveillance, prioritise investigations, and support targeted control strategies.
Figures


Reference graph
Works this paper leans on
-
[1]
E. Agbemafle, C. Kubio, D. Bandoh, M. Odikro, C. Aza- gba, R. Issahaku, S. Sackey, Evaluation of the malaria surveillance system – adaklu district, volta region, ghana, 2019, Public Health in Practice 6 (2023) 100414. doi:10. 1016/j.puhip.2023.100414
arXiv 2019
-
[2]
M. K. Savi, B. Pandey, A. Swain, J. Lim, D. Callo- Concha, G. R. Azondekon, M. Wahjib, C. Borgemeis- ter, Urbanization and malaria have a contextual relation- ship in endemic areas: A temporal and spatial study in ghana, PLOS Global Public Health 4 (2024) e0002871. doi:10.1371/journal.pgph.0002871
-
[3]
P. U. Eze, N. Geard, I. Mueller, I. Chades, Anomaly detection in endemic disease surveillance data using ma- chine learning techniques, Healthcare 11 (2023) 1896. doi:10.3390/healthcare11131896
-
[4]
K. L. Colborn, E. Giorgi, A. J. Monaghan, E. Gudo, B. Candrinho, T. J. Marrufo, J. M. Colborn, Spatio- temporal modelling of weekly malaria incidence in chil- dren under 5 for early epidemic detection in mozam- bique, Scientific Reports 8 (2018). doi:10.1038/ s41598-018-27537-4
2018
-
[5]
O. Srimokla, W. Pan-Ngum, A. Khamsiriwatchara, C. Padungtod, R. Tipmontree, N. Choosri, S. Saralamba, Early warning systems for malaria outbreaks in thailand: an anomaly detection approach, Malaria Journal 23 (2024). doi:10.1186/s12936-024-04837-x
-
[6]
A. S. Hashemi, M. M. Ghazani, M. Ohlsson, J. Björk, D. Dietler, Surveillance of disease outbreaks using un- supervised uni-multivariate anomaly detection of time- series symptoms, in: Digital Health and Informatics Inno- vations for Sustainable Health Care Systems: Proceedings of MIE 2024, SAGE Publications 1 Oliver’s Yard, 55 City Road, London, EC1Y 1SP,...
2024
-
[7]
T. Ansah-Narh, Y . A. Afrane, J. B. Tandoh, Bayesian in- ference of nonlinear malaria dynamics in ghana via an ensemble markov chain monte carlo sampler, Expert Systems with Applications 312 (2026) 131540. doi:10. 1016/j.eswa.2026.131540
arXiv 2026
-
[8]
Adu-Prah, E
S. Adu-Prah, E. K. Tetteh, Spatiotemporal analysis of cli- mate variability impacts on malaria prevalence in ghana, Applied Geography 60 (2015) 266–273
2015
-
[9]
D. de Souza, L. Kelly-Hope, B. Lawson, M. Wilson, D. Boakye, Environmental factors associated with the dis- tribution of anopheles gambiae s.s in ghana; an important vector of lymphatic filariasis and malaria, PLoS ONE 5 (2010) e9927. doi:10.1371/journal.pone.0009927
-
[10]
Awine, K
T. Awine, K. Malm, C. Bart-Plange, S. P. Silal, Towards malaria control and elimination in ghana: challenges and decision making tools to guide planning, Global health action 10 (2017) 1381471
2017
-
[11]
M. N. Adokiya, Perspectives of health workers on malaria case referral among pregnant women attending antenatal care in savelugu municipality, ghana: A qualitative de- scriptive study, PloS one 20 (2025) e0319567
2025
-
[12]
E. K. Aidoo, F. T. Aboagye, G. E. Agginie, F. A. Botch- way, G. Osei-Adjei, M. Appiah, R. D. Takyi, S. A. Sakyi, L. Amoah, G. Arthur, et al., Malaria elimination in ghana: recommendations for reactive case detection strategy im- plementation in a low endemic area of asutsuare, ghana, Malaria Journal 23 (2024) 5
2024
-
[13]
A. S. Kolekang, Y . Afrane, S. Apanga, D. Zurovac, A. Kwarteng, S. Afari-Asiedu, K. P. Asante, A. Danso- Appiah, Challenges with adherence to the ‘test, treat, and track’malaria case management guideline among pre- scribers in ghana, Malaria Journal 21 (2022) 332
2022
-
[14]
J. N. Fobil, A. Kraemer, C. G. Meyer, J. May, Neigh- borhood urban environmental quality conditions are likely to drive malaria and diarrhea mortality in accra, ghana, Journal of environmental and public health 2011 (2011) 484010
2011
-
[15]
F. T. Liu, K. M. Ting, Z.-H. Zhou, Isolation forest, in: 2008 Eighth IEEE International Conference on Data Min- ing, IEEE, 2008, p. 413–422. doi:10.1109/icdm.2008. 17
-
[16]
M. M. Breunig, H.-P. Kriegel, R. T. Ng, J. Sander, Lof: identifying density-based local outliers, ACM SIG- MOD Record 29 (2000) 93–104. doi:10.1145/335191. 335388
doi:10.1145/335191 2000
-
[17]
M. Sakurada, T. Yairi, Anomaly detection using autoen- coders with nonlinear dimensionality reduction, in: Pro- ceedings of the MLSDA 2014 2nd Workshop on Machine Learning for Sensory Data Analysis, MLSDA′14, ACM, 2014, p. 4–11. doi:10.1145/2689746.2689747. 30
arXiv 2014
-
[18]
P. J. Rousseeuw, K. V . Driessen, A fast algorithm for the minimum covariance determinant estimator, Technomet- rics 41 (1999) 212–223. doi:10.1080/00401706.1999. 10485670
arXiv 1999
-
[19]
A. Zimek, R. J. Campello, J. Sander, Ensembles for unsupervised outlier detection: challenges and research questions a position paper, ACM SIGKDD Explorations Newsletter 15 (2014) 11–22. doi:10.1145/2594473. 2594476
-
[20]
Kittler, M
J. Kittler, M. Hatef, R. Duin, J. Matas, On combining classifiers, IEEE Transactions on Pattern Analysis and Machine Intelligence 20 (1998) 226–239. doi:10.1109/ 34.667881
1998
-
[21]
Pedregosa, G
F. Pedregosa, G. Varoquaux, A. Gramfort, V . Michel, B. Thirion, O. Grisel, M. Blondel, P. Prettenhofer, R. Weiss, V . Dubourg, et al., Scikit-learn: Machine learn- ing in python, the Journal of machine Learning research 12 (2011) 2825–2830
2011
-
[22]
J. M. K. Aheto, Mapping under-five child malaria risk that accounts for environmental and climatic factors to aid malaria preventive and control efforts in ghana: Bayesian geospatial and interactive web-based mapping methods, Malaria Journal 21 (2022). doi:10.1186/ s12936-022-04409-x
2022
-
[23]
S. P. Kigozi, R. N. Kigozi, C. M. Sebuguzi, J. Cano, D. Rutazaana, J. Opigo, T. Bousema, A. Yeka, A. Gasasira, B. Sartorius, R. L. Pullan, Spatial-temporal patterns of malaria incidence in uganda using hmis data from 2015 to 2019, BMC Public Health 20 (2020). doi:10.1186/s12889-020-10007-w
-
[24]
T. V . Oheneba-Dornyo, S. Amuzu, A. Maccagnan, T. Tay- lor, Estimating the impact of temperature and rainfall on malaria incidence in ghana from 2012 to 2017, Envi- ronmental Modeling & Assessment 27 (2022) 473–489. doi:10.1007/s10666-022-09817-6
-
[25]
E. Asare, L. Amekudzi, Assessing climate driven malaria variability in ghana using a regional scale dynamical model, Climate 5 (2017) 20. doi:10.3390/cli5010020
-
[26]
L. McInnes, J. Healy, J. Melville, UMAP: Uniform Man- ifold Approximation and Projection for Dimension Re- duction, arXiv e-prints (2018) arXiv:1802.03426. doi:10. 48550/arXiv.1802.03426
-
[27]
U. N. Nakakana, I. A. Mohammed, B. Onankpa, R. M. Jega, N. M. Jiya, A validation of the malaria atlas project maps and development of a new map of malaria transmis- sion in sokoto, nigeria: a cross-sectional study using ge- ographic information systems, Malaria journal 19 (2020) 149
2020
-
[28]
P. W. Gething, D. L. Smith, A. P. Patil, A. J. Tatem, R. W. Snow, S. I. Hay, Climate change and the global malaria recession, Nature 465 (2010) 342–345. doi:10.1038/ nature09098
2010
-
[29]
C. C. Aggarwal, Outlier Analysis, Springer International Publishing, 2017. doi:10.1007/978-3-319-47578-3
-
[30]
V . Chandola, A. Banerjee, V . Kumar, Anomaly detec- tion: A survey, ACM Computing Surveys 41 (2009) 1–58. doi:10.1145/1541880.1541882
arXiv 2009
-
[31]
K. Asare, B. K. Nyarko, N. A. B. Klutse, T. Ansah- Narh, R. Damoah, H. A. Koffi, Quantifying the in- fluence of remote climate indices on key climate vari- ables in northern ghana: A comprehensive multivariate approach, Earth Systems and Environment 10 (2025) 577–603. doi:10.1007/s41748-025-00618-x
-
[32]
Owusu, P
K. Owusu, P. R. Waylen, The changing rainy season cli- matology of mid-ghana, Theoretical and applied clima- tology 112 (2013) 419–430. 31
2013
discussion (0)
Sign in with ORCID, Apple, or X to comment. Anyone can read and Pith papers without signing in.