REVIEW 3 major objections 4 minor 40 references
Farmland Extent and Visible Boundary Mapping from 1 m NAIP Imagery Using Residual U-Net and Text-Prompted SAM 3 Refinement
T0 review · 3 major / 4 minor · reviewed 2026-08-01 · deepseek-v4-flash
Pith's one-line read A compact residual U-Net, augmented by a frozen text-prompted segmenter, maps farmland extent from 1 m NAIP RGB with test Dice 0.9234, IoU 0.8605, and recall 0.9794.
desk verdict Honest, modest, reproducible NAIP farmland-extent paper; pooled test Dice is credible but needs per-scene stratification, and the SAM 3 gains are case-based. read the letter →
The pith
A machine-rendered reading of the paper's core claim, the machinery that carries it, and where it could break.
The reading
What carries the argument
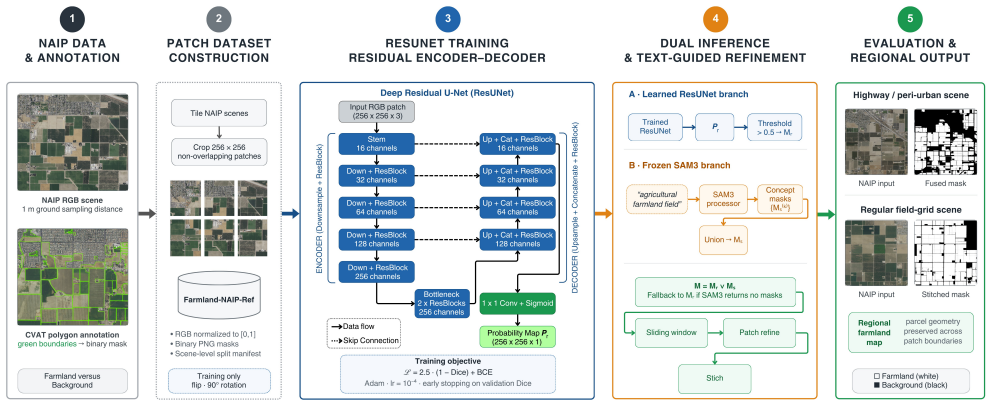
The load-bearing machinery is the residual encoder–decoder (ResUNet) with long skip connections, trained on scene-level split 256x256 patches under the loss L = 2.5(1 − Dice) + BCE, which makes overlap error dominant and pushes the model toward high recall. On top of that sits a frozen text-prompted Segment Anything Model 3 (SAM 3) that returns concept masks for the prompt 'agricultural farmland field'; its masks are unioned and combined with the thresholded ResUNet output by logical OR, with fallback to ResUNet when SAM 3 returns no mask. This two-stage cascade — efficient task-specific prediction plus broad open-vocabulary prior — is what carries the argument.
What would settle it
Take the same training setup and evaluate on a completely new set of NAIP scenes from different regions or acquisition years; if test Dice falls materially, the result does not transfer beyond the sampled landscapes. Also, re-annotate a subset of the patches with a second annotator; if the inter-annotator Dice is below the model's reported 0.9234, the ground truth itself is the bottleneck.
Extended reading notes
Core claim
The central discovery is that a deliberately simple division of labour works: a domain-trained ResUNet supplies stable, recall-oriented farmland probabilities, while a frozen SAM 3, prompted with the phrase 'agricultural farmland field', adds coherent concept masks where the local classifier under-segments. Fusing by pixelwise logical OR raises selected orchard-row Dice from 0.858 to 0.955 and fragmented-parcel Dice from 0.804 to 0.903, and sliding-window stitching yields coherent regional masks (example tile Dice 0.898 and 0.919). The result is an auditable semantic farmland-extent layer that omits little annotated farmland but retains commission errors at roads, exposed soil, and developed
Load-bearing premise
The paper's accuracy numbers rest on the assumption that the manually traced polygon boundaries are correct and consistent, and that the 1,078 test patches (from an unspecified number of the 37 scenes) represent the four landscape types; if either is off, the reported metrics inherit that error.
Editorial extensions
If this is right
- A reliable open farmland-extent layer can support crop-area accounting and farmland-conversion screening where proprietary parcel layers are unavailable.
- The recall-oriented operating point means the mask is suited to screening jobs that tolerate commission errors but cannot afford missed fields; downstream precision-sensitive uses need human review.
- Logical OR fusion can only add SAM 3 regions, never remove ResUNet positives, so false-positive concept masks from SAM 3 persist; confidence-weighted or selective fusion are natural corrections the paper identifies.
- Because the output is a binary extent without instance identities, a boundary head or distance-transform target would be needed to move toward parcel-level products.
Reading between the lines
- Inference: invoking SAM 3 only on low-confidence windows could retain most of the fusion benefit while controlling the extra compute of a large foundation model across large archives.
- Inference: adding near-infrared or multi-date imagery would likely sharpen the farmland/background separation the paper notes, especially for fallow or harvested fields; this is a testable extension the paper leaves open.
- Inference: if the manual labels are not consistent across annotators, the 0.9234 Dice is an upper bound on what the model can learn from those labels; an inter-annotator agreement study would put the number in context.
Signed reviews
Editorial analysis
A structured set of objections, weighed in public.
Referee Report
Summary. The manuscript presents a workflow for mapping farmland extent and visible boundaries from 1 m NAIP RGB imagery using a residual U-Net (ResUNet) trained on 5,698 scene-separated 256×256 patches from 37 manually annotated scenes, followed by a frozen, text-prompted SAM 3 branch whose concept masks are combined with the ResUNet output by logical OR. The ResUNet alone is reported to achieve test Dice 0.9234, IoU 0.8605, accuracy 0.8808, precision 0.8766, and recall 0.9794 on a held-out test partition of 1,078 patches. Selected SAM 3 refinements improve Dice from 0.858 to 0.955 (orchard rows) and from 0.804 to 0.903 (fragmented parcels), and two stitched regional examples achieve tile-level Dice 0.898 and 0.919. The paper explicitly distinguishes semantic farmland extent from cadastral or instance-level parcel maps and frames the contribution as a reproducible, audit-friendly baseline rather than a claim of universal superiority.
Significance. If the reported results hold, the paper provides a useful, reproducible baseline for NAIP farmland-extent mapping using a compact ResUNet and a standard scene-level split, with public code, annotations, and a split manifest. The strengths are the scene-level partitioning to reduce leakage, the clear separation of extent, visible-boundary, and cadastral semantics, the transparent logical-OR fusion rule, and the deliberate inclusion of difficult peri-urban and fragmented landscapes. The contribution is modest but potentially practical for crop-area screening. However, the headline ResUNet numbers are pooled point estimates with no per-scene or per-landscape stratification, and the SAM 3 refinement evidence is limited to selected examples; both are acknowledged in the text but remain load-bearing for the central claims.
major comments (3)
- [§3.4, Table 1, §4.2] The test metrics in Table 2 are pooled over the 1,078 test patches, but the number of contributing scenes is not reported and no per-scene or per-landscape-type metrics are given. Section 4.2 itself states that 'a scene-stratified error analysis is needed.' Because the abstract claims stable farmland segmentation across the four represented landscape contexts, this is load-bearing: the pooled Dice 0.9234 could be dominated by a few favorable regular-field scenes while difficult peri-urban or fragmented scenes perform much worse. Please report the number of test scenes, per-scene and per-landscape Dice/IoU/precision/recall (with confidence intervals or error bars where feasible), and ideally seed-wise variation.
- [§3.7, §4.4, Table 3] The SAM 3 refinement claim rests on two selected patches, and the fusion rule is logical OR, which can only add predicted farmland. The paper correctly labels this case-based in §5.6, but the contribution (iii) — a transparent SAM 3 refinement rule — is not evaluated as a finding. Without a paired ResUNet-only vs fused comparison on the full test collection, the abstract's statement that SAM 3 'complements' the ResUNet is an illustration rather than a measured result. Please report aggregate and per-scene Dice/IoU/precision/recall for ResUNet-only, SAM3-only, and fused outputs, with the number of patches improved vs degraded and an estimate of the additional compute cost.
- [§3.3, §4] The reference masks are manually digitized polygons with no reported inter-annotator agreement, independent verification, or quantitative quality control. All metrics in Table 2 and Figures 5–7 are computed against these masks, so annotator inconsistency or a biased 'visible crop area' policy would directly affect every headline number. Please document the annotation protocol in more detail and, at minimum, compute agreement on a double-annotated subset (e.g., IoU between annotators or area overlap against an independent source), or explicitly state the quality-control procedures used before rasterization.
minor comments (4)
- [§4.5, Figures 5–7] Figure 6 is presented without a tile-level Dice score while Figures 5 and 7 report 0.898 and 0.919; either provide the score for Figure 6 or label it as intentionally qualitative.
- [§3.6, Table 1] The values λ=2.5 and threshold 0.5 were selected on validation and are reported clearly, but no sensitivity analysis is given. A brief statement of how test Dice changes under nearby values (e.g., λ=1.5–3.5 or thresholds 0.4–0.6) would strengthen reproducibility.
- [§3.2, §4.1] The 37 source scenes are described by landscape context but not by state, acquisition year, or scene identifier in the text. A supplemental table of scene metadata, or a pointer to the Zenodo manifest, would make the scene-level split auditable.
- [§3.8] Runtime and memory for the sliding-window/SAM 3 pass are stated as not recorded. Given the operational claim in §5.5, a measured throughput figure for the ResUNet-only and fused pipelines would be useful, even if approximate.
Circularity Check
No significant circularity: the central ResUNet metrics are a genuine scene-level held-out evaluation, and the SAM 3 fusion is presented as case-based demonstration rather than a derived prediction.
full rationale
The paper's main claim is an empirical evaluation of a residual U-Net on a test partition separated by source scene (Section 3.4, Table 1). The loss (Eq. 2), threshold (Eq. 3), and metric definitions (Eqs. 6-7) do not encode the test labels; validation-Dice checkpointing is standard and does not make the test Dice self-referential. The SAM 3 refinement is not presented as a dataset-wide estimate: Section 4.4 explicitly states 'the examples were selected to examine difficult structures, they are interpreted as case-based evidence rather than a dataset-wide effect estimate,' and Section 5.6 calls for 'a comprehensive paired comparison' as future work, so no fitted parameter is renamed as a prediction. The only self-citations are contextual references in the introduction/related work (e.g., [2], [6], [11]-[13]) and are not load-bearing for the architecture, loss, or evaluation. The paper also flags its own limitations, including the need for 'a scene-stratified error analysis' (Section 4.2) and external validation (Section 5.4), which are external-validity concerns rather than circular reductions. Accordingly, no circular step meeting the required evidentiary standard was found.
Assumptions & free parameters
free parameters (3)
- Loss weight λ =
2.5
- ResUNet decision threshold τ =
0.5
- SAM 3 text prompt =
"agricultural farmland field"
assumptions (4)
- domain assumption Manual CVAT polygon tracing correctly captures farmland extent for the 37 scenes.
- domain assumption Scene-level partitioning prevents label leakage and yields independent test samples.
- domain assumption 37 purposively chosen scenes represent the four landscape contexts sufficiently to support the stated generalization.
- ad hoc to paper The text prompt 'agricultural farmland field' activates the intended concept in SAM 3.
Cite this review
Pith. "Pith review of Farmland Extent and Visible Boundary Mapping from 1 m NAIP Imagery Using Residual U-Net and Text-Prompted SAM 3 Refinement." pith.science (2026). https://pith.science/paper/ZYB5TC3M
@misc{pith2026260721881,
  author       = {Pith},
  title        = {Pith review of: Farmland Extent and Visible Boundary Mapping from 1 m NAIP Imagery Using Residual U-Net and Text-Prompted SAM 3 Refinement},
  year         = {2026},
  howpublished = {\url{https://pith.science/paper/ZYB5TC3M}},
  note         = {Machine review of arXiv:2607.21881}
}
read the original abstract
Agricultural field maps are often proprietary, incomplete, or outdated, yet they provide the spatial framework for crop monitoring, production accounting, and land-conversion analysis. This study presents a reproducible workflow for mapping farmland extent and visible boundaries from 1 m NAIP RGB imagery. Thirty-seven scenes spanning open cropland, peri-urban interfaces, semi-arid irrigation geometries, and fragmented mosaics were annotated in CVAT and converted to binary masks. Non-overlapping 256 x 256 patches yielded 5,698 samples, split by source scene into 3,850 training, 770 validation, and 1,078 test patches. A residual U-Net (ResUNet) trained with a Dice-dominant loss, L = 2.5(1 - Dice) + BCE, achieved test accuracy 0.8808, IoU 0.8605, Dice 0.9234, precision 0.8766, and recall 0.9794. A frozen SAM 3 branch prompted with "agricultural farmland field" was fused with ResUNet by logical OR. On selected difficult patches, Dice improved from 0.858 to 0.955 (orchard rows) and from 0.804 to 0.903 (fragmented parcels). Sliding-window stitching produced coherent regional masks (example tile Dice 0.898 and 0.919). The product is a semantic farmland-extent layer, not a cadastral parcel map, and supports agricultural monitoring where current field layers are unavailable.
Figures


Figures from the paper (4 more)


Reference graph
Works this paper leans on
-
[1]
PROSPECT: A model of leaf optical properties spectra,
S. Jacquemoud and F. Baret, “PROSPECT: A model of leaf optical properties spectra,”Remote Sensing of Environment, vol. 34, no. 2, pp. 75–91, 1990
1990
-
[2]
Multi-trait spectral modeling for estimating grapevine leaf traits and nutrients,
P. Farajpoor, A. Pourreza, M. Narimani, A. El-Kereamy, and M. W. Fidelibus, “Multi-trait spectral modeling for estimating grapevine leaf traits and nutrients,”Plant Phenomics, vol. 7, no. 4, p. 100142, 2025
2025
-
[3]
Leaf spectral reflectance prediction using multi-head attention neural networks,
P. Farajpoor, A. Pourreza, M. Narimani, A. El-Kereamy, and M. W. Fidelibus, “Leaf spectral reflectance prediction using multi-head attention neural networks,”arXiv preprint arXiv:2606.01432, 2026
arXiv 2026
-
[4]
Areviewofadvanced techniques for detecting plant diseases,
S.Sankaran,A.Mishra,R.Ehsani,andC.Davis,“Areviewofadvanced techniques for detecting plant diseases,”Computers and Electronics in Agriculture, vol. 72, no. 1, pp. 1–13, 2010
2010
-
[5]
Plantdiseasedetectionbyimagingsensors—parallels and specific demands for precision agriculture and plant phenotyping,
A.-K.Mahlein,“Plantdiseasedetectionbyimagingsensors—parallels and specific demands for precision agriculture and plant phenotyping,” Plant Disease, vol. 100, no. 2, pp. 241–251, 2016
2016
-
[6]
Earlydetectionofbranchedbroomrape(Phelipanche ramosa) infestation in tomato crops by using leaf spectral analysis and machine learning,
M.Narimani,A.Pourreza,A.Moghimi,P.Farajpoor,H.Jafarbiglu,and M.B.Mesgaran,“Earlydetectionofbranchedbroomrape(Phelipanche ramosa) infestation in tomato crops by using leaf spectral analysis and machine learning,”IFAC-PapersOnLine, vol. 59, no. 23, pp. 114–119, 2025
2025
-
[7]
Perspectives for remote sensing with unmanned aerial vehicles in precision agriculture,
W. H. Maes and K. Steppe, “Perspectives for remote sensing with unmanned aerial vehicles in precision agriculture,”Trends in Plant Science, vol. 24, no. 2, pp. 152–164, 2019
2019
-
[8]
Drone-based multispectral imaging and deep learning for timely detection of branched broomrape in tomato farms,
M. Narimani, A. Pourreza, A. Moghimi, M. Mesgaran, P. Farajpoor, and H. Jafarbiglu, “Drone-based multispectral imaging and deep learning for timely detection of branched broomrape in tomato farms,” inAutonomous Air and Ground Sensing Systems for Agricultural OptimizationandPhenotypingIX,vol.13053. SPIE,2024,pp.16–25
2024
Show all 40 references
-
[9]
Remotesensingforagricultural applications: A meta-review,
M.Weiss,F.Jacob,andG.Duveiller,“Remotesensingforagricultural applications: A meta-review,”Remote Sensing of Environment, vol. 236, p. 111402, 2020
2020
-
[10]
Remote sensing for precision agriculture: Sentinel-2 improved features and applications,
J. Segarra, M. L. Buchaillot, J. L. Araus, and S. C. Kefauver, “Remote sensing for precision agriculture: Sentinel-2 improved features and applications,”Agronomy, vol. 10, no. 5, p. 641, 2020
2020
-
[11]
Branched broomrape detection in tomato farms using satellite imagery and time-series analysis,
M. Narimani, A. Pourreza, A. Moghimi, P. Farajpoor, H. Jafarbiglu, and M. Mesgaran, “Branched broomrape detection in tomato farms using satellite imagery and time-series analysis,”arXiv preprint arXiv:2509.10804, 2025
2025 arXiv
-
[12]
Sentinel-2 for crop yield estimation: A systematic review,
M. Narimani, A. Pourreza, A. Moghimi, and P. Farajpoor, “Sentinel-2 for crop yield estimation: A systematic review,”Smart Agricultural Technology, p. 102405, 2026
2026
-
[13]
Mapping tomato crop- ping systems in California using AlphaEarth geospatial embeddings and deep learning analysis,
M. Narimani, A. Pourreza, and P. Farajpoor, “Mapping tomato crop- ping systems in California using AlphaEarth geospatial embeddings and deep learning analysis,”arXiv preprint arXiv:2605.21804, 2026
2026 arXiv
-
[14]
Twenty five years of remote sensing in precision agriculture:Keyadvancesandremainingknowledgegaps,
D. J. Mulla, “Twenty five years of remote sensing in precision agriculture:Keyadvancesandremainingknowledgegaps,”Biosystems Engineering, vol. 114, no. 4, pp. 358–371, 2013
2013
-
[15]
Applications of remote sensing in precision agriculture: A review,
R. P. Sishodia, R. L. Ray, and S. K. Singh, “Applications of remote sensing in precision agriculture: A review,”Remote Sensing, vol. 12, no. 19, p. 3136, 2020
2020
-
[16]
Fieldsoftheworld:Amachinelearningbenchmarkdataset for global agricultural field boundary segmentation,
H. Kerner, S. Chaudhari, A. Ghosh, C. Robinson, A. Ahmad, E. Choi, N. Jacobs, C. Holmes, M. Mohr, R. Dodhia, J. M. Lavista Ferres, and J.Marcus,“Fieldsoftheworld:Amachinelearningbenchmarkdataset for global agricultural field boundary segmentation,” inProceedings oftheAAAIConfe...
2025
-
[17]
The first global agricultural field boundary map at 10 m resolution,
C. Robinson, G. Muhawenayo, S. Khanal, Z. Fang, I. Corley, A. M. Tárano, L. Estes, J. Marcus, N. Jacobs, H. Kerner, I. Becker-Reshef, and J. M. Lavista Ferres, “The first global agricultural field boundary map at 10 m resolution,”arXiv preprint arXiv:2605.11055, 2026
2026 arXiv
-
[18]
USGS EROS Archive—Aerial Photography—National Agriculture Imagery Program (NAIP),
U.S. Geological Survey, “USGS EROS Archive—Aerial Photography—National Agriculture Imagery Program (NAIP),” https://doi.org/10.5066/F7QN651G, 2017
2017 doi
-
[19]
U-Net: Convolutional networks for biomedical image segmentation,
O. Ronneberger, P. Fischer, and T. Brox, “U-Net: Convolutional networks for biomedical image segmentation,” inMedical Image Computing and Computer-Assisted Intervention—MICCAI 2015, ser. Lecture Notes in Computer Science, vol. 9351. Springer, 2015, pp. Narimani et al.:Preprint...
2015
-
[20]
Deepresiduallearningforimage recognition,
K.He,X.Zhang,S.Ren,andJ.Sun,“Deepresiduallearningforimage recognition,” inProceedings of the IEEE Conference on Computer Vision and Pattern Recognition, 2016, pp. 770–778
2016
-
[21]
Road extraction by deep residual U-Net,
Z. Zhang, Q. Liu, and Y. Wang, “Road extraction by deep residual U-Net,”IEEE Geoscience and Remote Sensing Letters, vol. 15, no. 5, pp. 749–753, 2018
2018
-
[22]
Delineation of agri- cultural field boundaries from Sentinel-2 images using a novel super- resolution contour detector based on fully convolutional networks,
K. M. Masoud, C. Persello, and V. A. Tolpekin, “Delineation of agri- cultural field boundaries from Sentinel-2 images using a novel super- resolution contour detector based on fully convolutional networks,” Remote Sensing, vol. 12, no. 1, p. 59, 2019
2019
-
[23]
Deep learning on edge: Extracting field boundaries from satellite images with a convolutional neural network,
F. Waldner and F. I. Diakogiannis, “Deep learning on edge: Extracting field boundaries from satellite images with a convolutional neural network,”Remote Sensing of Environment, vol. 245, p. 111741, 2020
2020
-
[24]
Advanced fullyconvolutionalnetworksforagriculturalfieldboundarydetection,
A. Taravat, M. P. Wagner, R. Bonifacio, and D. Petit, “Advanced fullyconvolutionalnetworksforagriculturalfieldboundarydetection,” Remote Sensing, vol. 13, no. 4, p. 722, 2021
2021
-
[25]
Automated delineation of agricultural field boundaries from Sentinel- 2 images using recurrent residual U-Net,
H.Zhang,M.Liu,Y.Wang,J.Shang,X.Liu,B.Li,A.Song,andQ.Li, “Automated delineation of agricultural field boundaries from Sentinel- 2 images using recurrent residual U-Net,”International Journal of Applied Earth Observation and Geoinformation, vol. 105, p. 102557, 2021
2021
-
[26]
Segment anything,
A. Kirillov, E. Mintun, N. Ravi, H. Mao, C. Rolland, L. Gustafson, T.Xiao,S.Whitehead,A.C.Berg,W.-Y.Lo,P.Dollár,andR.Girshick, “Segment anything,” inProceedings of the IEEE/CVF International Conference on Computer Vision, 2023, pp. 4015–4026
2023
-
[27]
SAM 2: Segment anything in images and videos,
N. Ravi, V. Gabeur, Y.-T. Hu, R. Hu, C. Ryali, T. Ma, H. Khedr, R. Rädle, C. Rolland, L. Gustafson, E. Mintun, J. Pan, K. V. Alwala, N. Carion, C.-Y. Wu, R. Girshick, P. Dollár, and C. Feichtenhofer, “SAM 2: Segment anything in images and videos,” inInternational Conference on...
2025
-
[28]
SAM3:Segment anything with concepts,
N. Carion, L. Gustafson, Y.-T. Hu, S. Debnath, R. Hu, D. Suris, C. Ryali, K. V. Alwala, H. Khedr, A. Huang, J. Lei, T. Ma, B. Guo, A. Kalla, M. Marks, J. Greer, M. Wang, P. Sun, R. Rädle, T. Afouras, E.Mavroudi,K.Xu,T.-H.Wu,Y.Zhou,L.Momeni,R.Hazra,S.Ding, S. Vaze, F. Porcher, ...
2025 arXiv
-
[29]
The segment anything model (SAM) for remote sensing applications: From zero to one shot,
L. P. Osco, Q. Wu, E. L. de Lemos, W. N. Gonçalves, A. P. M. Ramos, J. Li, and J. Marcato Junior, “The segment anything model (SAM) for remote sensing applications: From zero to one shot,”International Journal of Applied Earth Observation and Geoinformation, vol. 124, p. 103540, 2023
2023
-
[30]
SEMPNet:Enhancingfew-shotremote sensing image semantic segmentation through the integration of the segmentanythingmodel,
W.Ao,S.Zheng,andY.Meng,“SEMPNet:Enhancingfew-shotremote sensing image semantic segmentation through the integration of the segmentanythingmodel,”GIScience&RemoteSensing,vol.61,no.1, p. 2426589, 2024
2024
-
[31]
Investigating the segment anything foundation model for mapping smallholder agriculture field boundaries without training labels,
P. Tripathy, K. Baylis, K. Wu, J. Watson, and R. Jiang, “Investigating the segment anything foundation model for mapping smallholder agriculture field boundaries without training labels,”arXiv preprint arXiv:2407.01846, 2024
2024 arXiv
-
[32]
Deeplearninginagriculture: A survey,
A.KamilarisandF.X.Prenafeta-Boldú,“Deeplearninginagriculture: A survey,”Computers and Electronics in Agriculture, vol. 147, pp. 70–90, 2018
2018
-
[33]
Automating field boundary de- lineation with multi-temporal Sentinel-2 imagery,
B. Watkins and A. van Niekerk, “Automating field boundary de- lineation with multi-temporal Sentinel-2 imagery,”Computers and Electronics in Agriculture, vol. 167, p. 105078, 2019
2019
-
[34]
Delin- eation of agricultural fields in smallholder farms from satellite images using fully convolutional networks and combinatorial grouping,
C. Persello, V. A. Tolpekin, J. R. Bergado, and R. A. de By, “Delin- eation of agricultural fields in smallholder farms from satellite images using fully convolutional networks and combinatorial grouping,” Remote Sensing of Environment, vol. 231, p. 111253, 2019
2019
-
[35]
Detect, consolidate, delineate: Scalable mapping of field boundaries using satellite images,
F. Waldner, F. I. Diakogiannis, K. Batchelor, M. Ciccotosto-Camp, E. Cooper-Williams, C. Herrmann, G. Mata, and A. Toovey, “Detect, consolidate, delineate: Scalable mapping of field boundaries using satellite images,”Remote Sensing, vol. 13, no. 11, p. 2197, 2021
2021
-
[36]
Unlocking large-scale crop field delineation in smallholder farming systems with transfer learning andweaksupervision,
S. Wang, F. Waldner, and D. B. Lobell, “Unlocking large-scale crop field delineation in smallholder farming systems with transfer learning andweaksupervision,”RemoteSensing,vol.14,no.22,p.5738,2022
2022
-
[37]
AI4Boundaries: An open AI-ready dataset to map field boundaries with Sentinel-2 and aerial photography,
R.d’Andrimont,M.Claverie,P.Kempeneers,D.Muraro,M.Yordanov, D. Peressutti, M. Batič, and F. Waldner, “AI4Boundaries: An open AI-ready dataset to map field boundaries with Sentinel-2 and aerial photography,”Earth System Science Data, vol. 15, no. 1, pp. 317–329, 2023
2023
-
[38]
A survey of farmland boundary extraction technology based on remote sensing images,
X.Wang,L.Shu,R.Han,F.Yang,T.Gordon,X.Wang,andH.Xu,“A survey of farmland boundary extraction technology based on remote sensing images,”Electronics, vol. 12, no. 5, p. 1156, 2023
2023
-
[39]
Encoder–decoder with atrous separable convolution for semantic image segmentation,
L.-C. Chen, Y. Zhu, G. Papandreou, F. Schroff, and H. Adam, “Encoder–decoder with atrous separable convolution for semantic image segmentation,” inComputer Vision—ECCV 2018. Springer, 2018, pp. 801–818
2018
-
[40]
Generalised dice overlap as a deep learning loss function for highly unbalanced segmentations,
C. H. Sudre, W. Li, T. Vercauteren, S. Ourselin, and M. J. Cardoso, “Generalised dice overlap as a deep learning loss function for highly unbalanced segmentations,” inDeep Learning in Medical Image Analysis and Multimodal Learning for Clinical Decision Support. Springer, 2017,...
2017
Reviewed August 1, 2026 · model on record in the stance chip above.
Discussion (0). Continue with ORCID to comment.