REVIEW 3 major objections 4 minor 38 references
AutoCause claims that recording expert decisions yields reproducible causal graphs, and that majority-supported links are more precise on synthetic benchmarks but not on real river topology.
Reviewed by Pith at T0; open to challenge. T0 means a machine referee read the full paper against a public rubric. the ladder, T0–T4 →
T0 review · deepseek-v4-flash
2026-08-04 01:01 UTC pith:RWFCKGDW
load-bearing objection Useful workflow integration, honestly documented; the headline CausalRivers claim rests on six and seven links and should be reframed. the 3 major comments →
AutoCause: A Python framework that automates expert decisions in environmental time-series causal discovery
The pith
A machine-rendered reading of the paper's core claim, the machinery that carries it, and where it could break.
Core claim
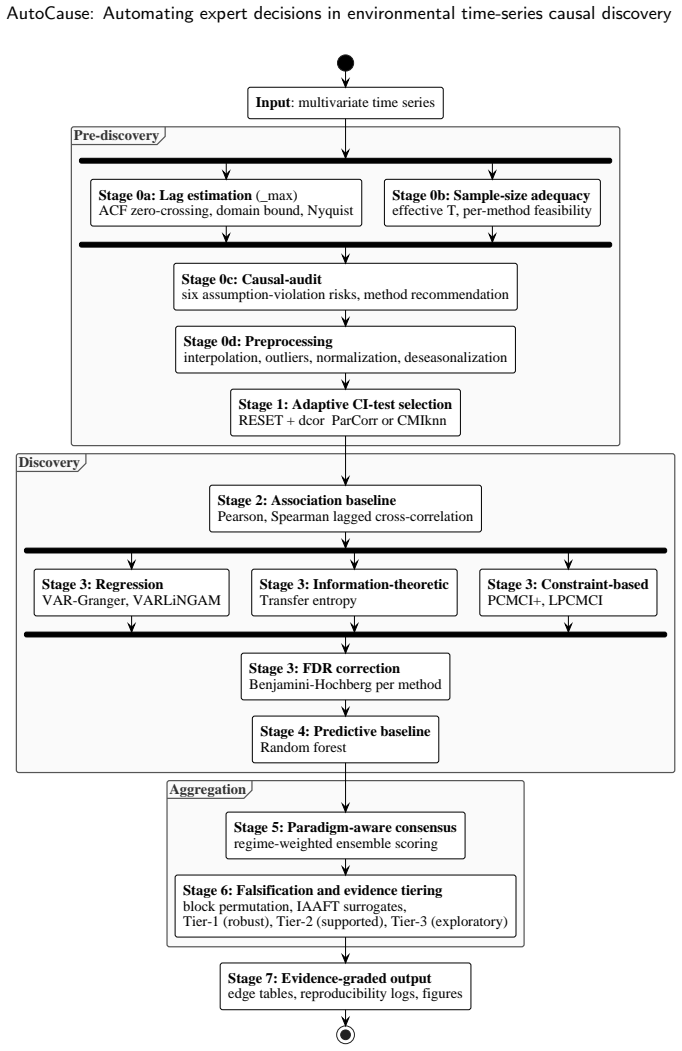
AutoCause formalizes six expert decisions—method choice, conditional-independence test, lag horizon, sample-size adequacy, multiple-testing control, and evidence interpretation—into a single Python workflow. On 145 datasets, links detected by at least three of four causal methods (Tier-1) have higher precision than single-method links on DGP-Atlas (0.848 vs 0.126) and TimeGraph (0.694 vs 0.300), but on CausalRivers Tier-1 precision is 0.425 while Tier-2 and Tier-3 are 0.667 and 0.571. The paper attributes this inversion to the reference graph: the river topology omits rainfall, snowmelt, reservoir operations, and tributary inflows that can create real statistical dependence. AutoCause theref
What carries the argument
The central mechanism is method-count consensus tiering combined with a pre-discovery causal-audit module. The audit converts six assumption-violation risks into method, preprocessing, and conditional-independence-test recommendations; the consensus step then counts how many of the four methods detect each link and assigns Tier-1 (≥3 methods), Tier-2 (exactly 2), or Tier-3 (exactly 1) support. The reference graph supplied for evaluation is the object that makes precision measurable and determines whether consensus support appears valuable.
Load-bearing premise
The CausalRivers evaluation counts any link not in the physical river topology as a false positive, even though the topology omits rainfall, snowmelt, reservoir operations, and tributary inflows that can create genuine statistical dependence between stations.
What would settle it
Add a measured common driver, such as catchment-wide precipitation, as an observable variable and rerun AutoCause on the same river subgraphs; if Tier-1 precision against a hydrologically expanded reference rises above the Tier-2 and Tier-3 estimates, the inversion is an artifact of the incomplete reference. Alternatively, on synthetic data with a hidden common cause, compare Tier-1 precision with and without the hidden variable; a similar drop would explain the river result as latent confounding.
If this is right
- A single logged workflow makes environmental causal-discovery analyses reproducible and comparable across datasets, since every configuration choice is recorded and can be overridden by domain knowledge.
- Majority-support tiering is a reliable precision filter only when the reference graph is complete; on real-world data with unobserved drivers, Tier-1 links should be read as repeated detection for further inspection, not as validated causal edges.
- Audit-triggered preprocessing can rescue methods: on irregular-sampling DGP-Atlas data, PCMCI+ rises from F1 0.00 to 0.78 after interpolation, and deseasonalization recovers all skeleton edges on a trend-seasonal TimeGraph case.
- No single method dominates across all regimes; a per-dataset oracle gains +0.104, +0.153, and +0.048 F1 over PCMCI+ alone on the three benchmarks, supporting multi-method ensembles as a robustness check.
- The support tiers are descriptive labels, not posterior probabilities or causal validity scores; they prioritize which links deserve further physical interpretation.
Where Pith is reading between the lines
- The CausalRivers inversion implies that consensus algorithms can share blind spots: if all methods detect a common forcing or an indirect path, agreement may reflect a shared error rather than a direct causal link. A synthetic test that adds a hidden common driver and measures Tier-1 precision collapse would directly probe this mechanism.
- The paper leaves open whether cross-family agreement carries information beyond vote count; an equal-vote comparison of same-family versus cross-family pairs would settle this, and the paper itself flags it as untested.
- The competitive performance of the lagged-correlation baseline on river data hints that for some environmental questions, association screening combined with strong domain constraints may be nearly as informative as causal discovery, especially when the reference graph is incomplete.
- The auditable-decision protocol could transfer to other application domains by adding new method families (e.g., continuous optimization, neural causal discovery) and new reference types, without changing the recorded-decision structure.
Editorial analysis
A structured set of objections, weighed in public.
Referee Report
Summary. The paper presents AutoCause, an open-source Python workflow for time-series causal discovery that wraps VAR-Granger, VARLiNGAM, transfer entropy, and PCMCI+, adds non-causal correlation and random-forest references, records six expert configuration decisions, and assigns consensus-support tiers by method count. It evaluates on 145 datasets from DGP-Atlas, TimeGraph, and a topology-derived CausalRivers reference, reporting method F1, complementarity, and tier-level precision. The headline empirical claim is that majority-supported (Tier-1) links are more precise than single-method links on the synthetic benchmarks (DGP-Atlas 0.848 vs 0.126; TimeGraph 0.694 vs 0.300), but that the ordering reverses on CausalRivers (Tier-1 0.425 vs Tier-2 0.667 and Tier-3 0.571).
Significance. If the results hold, the contribution is a valuable reproducibility and auditing layer around established causal-discovery methods, not a new discovery algorithm. The strengths of the manuscript are substantial: a released, versioned Python package with pinned dependencies, a file manifest tracing every reported number, machine-readable configuration logs, bootstrap intervals for method-level F1, inclusion of non-causal reference models, and unusually candid discussion of the limits of consensus tiering and of the CausalRivers topology reference. The paper also avoids overclaiming algorithmic novelty. However, the central consensus-precision claims need stronger statistical support and a clearer separation between development and independent evaluation before they can serve as the paper's main empirical message.
major comments (3)
- [§4.4, Fig. 9] The CausalRivers tier-precision inversion rests on Tier-2 and Tier-3 estimates computed from n=6 and n=7 links, with no confidence intervals or bootstrap. One true/false reclassification changes Tier-2 precision by 0.167 and Tier-3 by 0.143; Wilson 95% intervals for the observed 4/6 and 4/7 counts overlap substantially with the Tier-1 interval (0.425, n=287). The paper acknowledges in §2.4 that the topology reference omits rainfall, snowmelt, reservoir operations, and tributary inflows, so links outside the topology may be genuine couplings scored as false. The abstract's 'but not against river topology' therefore overstates the support. I request uncertainty quantification on all tier-precision estimates and a softened or properly conditioned claim (e.g., 'inconclusive on this reference').
- [§3.4, §4.1, §4.4] DGP-Atlas is the development ground for the pre-discovery extensions and decision thresholds, yet its 97 datasets are used as primary evidence for the 'synthetic benchmarks' half of the headline claim. The paper states that the three extensions 'emerged during DGP-Atlas validation' (§3.4), that the thresholds are 'implementation defaults' informed by DGP-Atlas (§4.1), and that family-level agreement in Table A.2 is an 'internal consistency check rather than independent external validation.' Under these conditions, DGP-Atlas tier-precision numbers cannot serve as independent confirmation of the workflow. The only independent synthetic evidence is TimeGraph, with n=49, 31, 20 for the three tiers and no uncertainty intervals. I recommend separating development and evaluation sets, or explicitly recasting DGP-Atlas as an illustrative stress test and basing the synthetic claim on independentl
- [§4.4, Table 11] Even for the supported orderings, precision differences between tiers are reported as point estimates only. For TimeGraph, Tier-1 precision 0.694 (n=49) vs Tier-3 0.300 (n=20) is suggestive but not quantified; for DGP-Atlas, Tier-1 0.848 (n=1291) vs Tier-2 0.344 (n=209) is a large difference, but bootstrap intervals across datasets (as already used for method F1 in Fig. 3) would make the claim rigorous. I request dataset-level bootstrap or Wilson intervals for the consensus-support precision table, and the same for the vote-threshold comparison.
minor comments (4)
- [Fig. 1 vs §3.1/Table 6] Stage 5 in Figure 1 is labeled 'regime-weighted ensemble scoring,' but the text and Table 6 describe an unweighted method-count tier rule. Please align the figure with the implemented rule or explain the weighting if it exists.
- [§A.2] The sentence 'PCMCI+ has mean F1=0.814 on the same skeleton endpoint' appears twice in consecutive sentences. One repetition should be removed.
- [Fig. 9] The dashed 'chance' line is said to represent a 'common reference prevalence,' but the definition is not given. Please state explicitly how the reference prevalence is computed and whether it is the same quantity across the three benchmarks.
- [§4.1] The operational sample-size thresholds (50/200/75/120) are described as 'informed by published guidance and observed estimator behavior'; citing the specific sources in the text or appendix would help readers judge the safety margins.
Circularity Check
No load-bearing circularity; the central claims rest on external benchmarks and the in-sample DGP-Atlas development is explicitly labeled internal.
full rationale
AutoCause's central empirical claims are benchmark evaluations, not derivations that reduce to their inputs. The headline tier-precision ordering is shown on TimeGraph (Ferdous et al., 2025), an external benchmark, as well as on DGP-Atlas; the CausalRivers inversion uses an external topology-derived reference (Stein et al., 2025). Thus the main 'majority precision is reference-dependent' claim does not reduce to any fitted parameter or self-defined quantity. The closest issue is that three causal-audit changes 'emerged during DGP-Atlas validation' (Section 3.4) and the thresholds are 'implementation defaults rather than universally validated cutoffs' (Section 4.1), so DGP-Atlas results are partially in-sample. The paper explicitly confines DGP-Atlas recommendation accuracy to 'an internal consistency check rather than as independent external validation' (Section 3.4) and states the experiments 'do not independently validate' the automated decision rules (Section 4). This is transparent in-sample optimism, not a prediction forced by construction. The self-citations to Ruiz et al. (2026) for causal-audit and DGP-Atlas are code- and data-released and are not used to forbid alternatives or to define the target result. The small CausalRivers Tier-2/Tier-3 denominators (n=6, 7) and the incompleteness of the topology reference are statistical validity threats, not circularity. Accordingly, no circular step is identified.
Axiom & Free-Parameter Ledger
free parameters (4)
- tau_max = 5 =
5
- causal-audit risk thresholds =
low <0.30, moderate 0.30-0.60, high >=0.60
- sample-size adequacy thresholds =
ParCorr 50, CMIknn 200, VAR-Granger 75, VARLiNGAM 120
- consensus tier cutoffs =
Tier-1 >=3, Tier-2 =2, Tier-3 =1
axioms (6)
- domain assumption Causal Markov condition and faithfulness hold for the constraint-based output (PCMCI+).
- domain assumption Causal sufficiency: all relevant common drivers are observed for the evaluated methods; LPCMCI was excluded by wall-time.
- domain assumption DGP-Atlas VAR(1) coefficient matrix is the true causal graph.
- domain assumption CausalRivers directed topology is a valid reference for false-positive scoring.
- standard math Standard statistical diagnostics (RESET, distance correlation, Shapiro-Wilk, BH, IAAFT surrogates) have valid operating characteristics at T=500-1460.
- domain assumption TimeGraph ground-truth graphs correspond to the evaluated method outputs.
read the original abstract
Environmental time-series causal discovery requires expert decisions about method choice, conditional-independence tests, lag horizons, sample-size adequacy, multiple-testing control, and evidence interpretation. Applied inconsistently across datasets, these choices yield graphs that cannot be compared, reproduced, or audited. We present AutoCause, an open-source Python workflow that records each decision, derives defaults from an extended causal-audit module, and admits domain-informed overrides. The workflow wraps four established causal-discovery methods from three families, adds non-causal reference models, and grades links by method-count support. On 145 datasets from DGP-Atlas, TimeGraph, and a topology-derived CausalRivers reference, the methods recover complementary parts of the reference graphs. Majority-supported links are more precise than single-method links on the synthetic benchmarks but not against river topology. AutoCause converts inconsistent expert practice into an auditable, repeatable analysis; causal interpretation remains with the analyst. Available at https://github.com/marcoruizrueda/autocause.
Figures


Reference graph
Works this paper leans on
-
[1]
Learninghigh-dimensionaldirectedacyclicgraphswithmixeddata-types,in:ProceedingsofMachine Learning Research, PMLR
Andrews,B.,Ramsey,J.,Cooper,G.F.,2019. Learninghigh-dimensionaldirectedacyclicgraphswithmixeddata-types,in:ProceedingsofMachine Learning Research, PMLR. pp. 4–21. Arpit, D., Fernandez, M., Feigenbaum, I., Yao, W., Liu, C., Yang, W., Josel, P., Heinecke, S., Hu, E., Wang, H., Hoi, S., Xiong, C., Zhang, K., Niebles, J.C.,
2019
-
[7]
Datasets and Benchmarks Track, pp. 1–45. URL:https://openreview.net/forum?id=ck7euvU7V3. neurIPS 2025 Datasets and Benchmarks Track Poster. Hyvärinen, A., Zhang, K., Shimizu, S., Hoyer, P.O.,
2025
-
[8]
Journal of Machine Learning Research 24, 1–8
Python package for causal discovery based on LiNGAM. Journal of Machine Learning Research 24, 1–8. URL:https://jmlr.org/papers/v24/21-0321.html. Kraskov,A.,Stögbauer,H.,Grassberger,P.,2004. Estimatingmutualinformation. Phys.Rev.E69,066138. doi:10.1103/PhysRevE.69.066138. Krich, C., Runge, J., Miralles, D.G., Migliavacca, M., Perez-Priego, O., El-Madany, T...
-
[15]
doi:10.48550/arXiv.2407.13054,arXiv:2407.13054
Comprehensive review and empirical evaluation of causal discovery algorithms for numerical data. doi:10.48550/arXiv.2407.13054,arXiv:2407.13054. Nowack, P., Runge, J., Eyring, V., Haigh, J.D.,
-
[19]
Local projections and VARs estimate the same impulse responses. Econometrica 89, 955–980. doi:10.3982/ECTA17813. Ramsey,J.B.,1969. Testsforspecificationerrorsinclassicallinearleast-squaresregressionanalysis. JournaloftheRoyalStatisticalSociety:Series B (Methodological) 31, 350–371. doi:10.1111/j.2517-6161.1969.tb00796.x. Ramsey, J.D., Zhang, K., Glymour, ...
arXiv 1969
-
[22]
Nature Reviews Earth & Environment 4, 487–505
Causal inference for time series. Nature Reviews Earth & Environment 4, 487–505. doi:10.1038/s43017-023-00431-y. Marco Ruiz et al.:Preprint submitted to ElsevierPage 32 of 33 AutoCause: Automating expert decisions in environmental time-series causal discovery Runge, J., Nowack, P., Kretschmer, M., Flaxman, S., Sejdinovic, D., 2019b. Detecting and quantify...
-
[23]
(Eds.), Proceedings of the NeurIPS 2019 Competition and Demonstration Track, PMLR
The causality for climate competition, in: Escalante, H.J., Hadsell, R. (Eds.), Proceedings of the NeurIPS 2019 Competition and Demonstration Track, PMLR. pp. 110–120. URL:https://proceedings.mlr. press/v123/runge20a.html. Ryšavý, P., He, X., Mareček, J.,
2019
-
[24]
Causal protein-signaling networks derived from multiparameter single-cell data. Science 308, 523–529. doi:10.1126/science.1105809. Schreiber, T.,
-
[27]
To explain or to predict? Statistical Science 25, 289–310. doi:10.1214/10-STS330. Slote, K., Fish, J., Bollt, E.,
-
[28]
CausationEntropy: A Python library for causal discovery. URL:https://github.com/ Center-For-Complex-Systems-Science/causationentropy, doi:10.5281/zenodo.17047565. Smith, S.M., Miller, K.L., Salimi-Khorshidi, G., Webster, M., Beckmann, C.F., Nichols, T.E., Ramsey, J.D., Woolrich, M.W.,
-
[30]
2nd ed., MIT Press, Cambridge, MA
Causation, Prediction, and Search. 2nd ed., MIT Press, Cambridge, MA. doi:10.7551/mitpress/ 1754.001.0001. Stein, G., Shadaydeh, M., Blunk, J., Penzel, N., Denzler, J.,
-
[31]
CausalRivers - scaling up benchmarking of causal discovery for real-world time-series, in: The Thirteenth International Conference on Learning Representations, pp. 1–16. URL:https://openreview.net/forum? id=wmV4cIbgl6. iCLR 2025 Spotlight. Székely, G.J., Rizzo, M.L., Bakirov, N.K.,
2025
-
[35]
Coarse-to-fine learning of dynamic causal structures, in: The Fourteenth International Conference on Learning Representations, pp. 1–27. URL:https://openreview.net/forum?id=ooqnLFagKq. iCLR 2026 Poster. Yu, G., Guo, C., Luk, W., 2026a. Robust time series causal discovery for agent-based model validation. doi:10.48550/arXiv.2410.19412, arXiv:2410.19412. Yu...
-
[36]
LOCAL: Learning with Orientation Matrix to Infer Causal Structure from Time Series Data
LOCAL: Learning with orientation matrix to infer causal structure from time series data. doi:10.48550/arXiv.2410.19464,arXiv:2410.19464. Zhang, K., Zhu, S., Kalander, M., Ng, I., Ye, J., Chen, Z., Pan, L.,
work page internal anchor Pith review Pith/arXiv arXiv doi:10.48550/arxiv.2410.19464
-
[37]
gCastle: A Python toolbox for causal discovery. doi:10.48550/arXiv. 2111.15155,arXiv:2111.15155. Zheng, X., Aragam, B., Ravikumar, P., Xing, E.P.,
-
[38]
DAGs with NO TEARS: Continuous optimization for structure learning, in: Proceedings of the 32nd International Conference on Neural Information Processing Systems, Curran Associates Inc.. p. 9492–9503. Zheng,Y.,Huang,B.,Chen,W.,Ramsey,J.,Gong,M.,Cai,R.,Shimizu,S.,Spirtes,P.,Zhang,K.,2024. Causal-learn:CausaldiscoveryinPython. Journal of Machine Learning Re...
2024
-
[127]
Marbach, D., Prill, R.J., Schaffter, T., Mattiussi, C., Floreano, D., Stolovitzky, G.,
doi:10.1016/j.compenvurbsys.2026.102435. Marbach, D., Prill, R.J., Schaffter, T., Mattiussi, C., Floreano, D., Stolovitzky, G.,
arXiv 2026
-
[524]
doi:10.3389/fgene.2019.00524. Marco Ruiz et al.:Preprint submitted to ElsevierPage 31 of 33 AutoCause: Automating expert decisions in environmental time-series causal discovery Granger,C.W.J.,1969. Investigatingcausalrelationsbyeconometricmodelsandcross-spectralmethods. Econometrica:JournaloftheEconometric Society 37, 424–438. doi:10.2307/1912791. Günther...
arXiv 2019
-
[1415]
doi:10.1038/s41467-020-15195-y. Pamfil, R., Sriwattanaworachai, N., Desai, S., Pilgerstorfer, P., Georgatzis, K., Beaumont, P., Aragam, B.,
-
[1995]
Journal of Econometrics 66, 225–250
Statistical inference in vector autoregressions with possibly integrated processes. Journal of Econometrics 66, 225–250. doi:10.1016/0304-4076(94)01616-8. Yang, D., Tan, Q., Domeniconi, C., Wang, J., Cui, L., Yu, G.,
-
[2000]
Physical Review Letters 85, 461–464
Measuring information transfer. Physical Review Letters 85, 461–464. doi:10.1103/PhysRevLett.85.461. Schreiber,T.,Schmitz,A.,2000.Surrogatetimeseries.PhysicaD:NonlinearPhenomena142,346–382.doi:10.1016/S0167-2789(00)00043-9. Shimizu, S., Hoyer, P.O., Hyvärinen, A., Kerminen, A.,
-
[2005]
New Introduction to Multiple Time Series Analysis. Springer, Berlin, Heidelberg. doi:10.1007/3-540-27752-8. Lyu, W., Lei, Y., Yi, W., Song, Y., Li, X., Dai, S., Qin, Y., Zhao, W.,
-
[2006]
Journal of Machine Learning Research 7, 2003–2030
A linear non-Gaussian acyclic model for causal discovery. Journal of Machine Learning Research 7, 2003–2030. URL:http://jmlr.org/papers/v7/shimizu06a.html. Shmueli, G.,
2003
-
[2007]
The Annals of Statistics 35, 2769–2794
Measuring and testing dependence by correlation of distances. The Annals of Statistics 35, 2769–2794. doi:10.1214/009053607000000505. Thumm, D., Chen, Y.,
-
[2009]
2nd ed., Cambridge University Press
Causality: Models, Reasoning, and Inference. 2nd ed., Cambridge University Press. doi:10.1017/CBO9780511803161. Peters, J., Janzing, D., Schölkopf, B.,
-
[2010]
Proceedings of the National Academy of Sciences 107, 6286–6291
Revealing strengths and weaknesses of methods for gene network inference. Proceedings of the National Academy of Sciences 107, 6286–6291. doi:10.1073/pnas.0913357107. McKinsey & Company,
-
[2011]
Network modelling methods for FMRI. NeuroImage 54, 875–891. doi:10.1016/j.neuroimage.2010.08.063. Spirtes, P., Glymour, C., Scheines, R.,
-
[2015]
5th ed., John Wiley & Sons
Time Series Analysis: Forecasting and Control. 5th ed., John Wiley & Sons. Brouillard,P.,Squires,C.,Wahl,J.,Körding,K.,Sachs,K.,Drouin,A.,Sridhar,D.,2025. Thelandscapeofcausaldiscoverydata:Groundingcausal discoveryinreal-worldapplications,in:Huang,B.,Drton,M.(Eds.),ProceedingsoftheFourthConferenceonCausalLearningandReasoning, PMLR. pp. 834–873. URL:https:...
2025
-
[2017]
Elements of Causal Inference: Foundations and Learning Algorithms. The MIT Press. URL: https://lccn.loc.gov/2017020087. Petersen, A.H.,
-
[2018]
Tetrad— a toolbox for causal discovery, in: 8th International Workshop on Climate Informatics, National Center for Atmospheric Research, Boulder, Colorado. pp. 1–4. URL:https://www.atmos.colostate.edu/~iebert/PAPERS/CI2018_paper_35.pdf. Ruiz,M.,Arana-Catania,M.,Ardila,D.R.,Ventura,R.,2026. Causal-Audit:Aframeworkforriskassessmentofassumptionviolationsinti...
work page internal anchor Pith review Pith/arXiv arXiv doi:10.48550/arxiv.2604.02488 2026
-
[2020]
Estimating causal networks in biosphere-atmosphere interaction with the PCMCI approach. Biogeosciences 17, 1033–1061. doi:10.5194/bg-17-1033-2020. Lütkepohl, H.,
-
[2021]
Knowledge and Information Systems 63, 3041–3085
Causal inference for time series analysis: Problems, methods and evaluation. Knowledge and Information Systems 63, 3041–3085. doi:10.1007/s10115-021-01621-0. Niu, W., Gao, Z., Song, L., Li, L.,
-
[2022]
CIPCaD-Bench: Continuous industrial process datasets for benchmarking causal discovery methods, in: 2022 IEEE 18th International Conference on Automation Science and Engineering (CASE), IEEE Press. pp. 2124–2131. doi:10.1109/CASE49997.2022.9926420. Mogensen, S.W., Rathsman, K., Nilsson, P.,
arXiv 2022
-
[2023]
doi:10.48550/arXiv.2301.10859,arXiv:2301.10859
Salesforce CausalAI library: A fast and scalable framework for causal analysis of time series and tabular data. doi:10.48550/arXiv.2301.10859,arXiv:2301.10859. Assaad,C.K.,Devijver,E.,Gaussier,E.,2022. Surveyandevaluationofcausaldiscoverymethodsfortimeseries. JournalofArtificialIntelligence Research 73, 767–819. doi:10.1613/jair.1.13428. Benjamini,Y.,Hoch...
-
[2024]
(Eds.), Proceedings of the Third Conference on Causal Learning and Reasoning, PMLR
Bootstrap aggregation and confidence measures to improve time series causal discovery, in: Locatello, F., Didelez, V. (Eds.), Proceedings of the Third Conference on Causal Learning and Reasoning, PMLR. pp. 979–1007. URL: https://proceedings.mlr.press/v236/debeire24a.html. Delwiche,K.B.,Knox,S.H.,Malhotra,A.,Fluet-Chouinard,E.,McNicol,G.,Feron,S.,Ouyang,Z....
2021
-
[2025]
TimeGraph: Synthetic benchmark datasets for robust time-series causal discovery, in: Proceedings of the 31st ACM SIGKDD Conference on Knowledge Discovery and Data Mining V.2, Association for Computing Machinery, New York, NY, USA. pp. 5425–5435. doi:10.1145/3711896.3737439. Gerhardus,A.,Runge,J.,2020. High-recallcausaldiscoveryforautocorrelatedtimeseriesw...
arXiv 2020
-
[2026]
Interventional time series priors for causal foundation models, in: 1st ICLR Workshop on Time Series in the Age of Large Models, pp. 1–15. URL:https://openreview.net/forum?id=JbTgx2L9Z2. iCLR 2026 TSALM Workshop Poster. Toda, H.Y., Yamamoto, T.,
2026
-
[2553]
Runge, J., Gerhardus, A., Varando, G., Eyring, V., Camps-Valls, G.,
doi:10.1038/s41467-019-10105-3. Runge, J., Gerhardus, A., Varando, G., Eyring, V., Camps-Valls, G.,
discussion (0)
Sign in with ORCID, Apple, or X to comment. Anyone can read and Pith papers without signing in.