REVIEW 3 major objections 5 minor 46 references
Attribution rankings are architecture-dependent: what works on CNNs does not reliably transfer to vision transformers, and apparent successes often reflect metric saturation.
Reviewed by Pith at T0; open to challenge. T0 means a machine referee read the full paper against a public rubric. the ladder, T0–T4 →
2026-08-04 08:01 UTC pith:GKC4LGH4
load-bearing objection A solid, unusually self-aware XAI benchmark with a real architecture-dependence story; the headline Spearman figure is built on a saturated metric and needs rework. the 3 major comments →
Does Explainability Transfer? A Controlled Benchmark of Attribution Methods on Vision Transformers and CNNs
The pith
A machine-rendered reading of the paper's core claim, the machinery that carries it, and where it could break.
Core claim
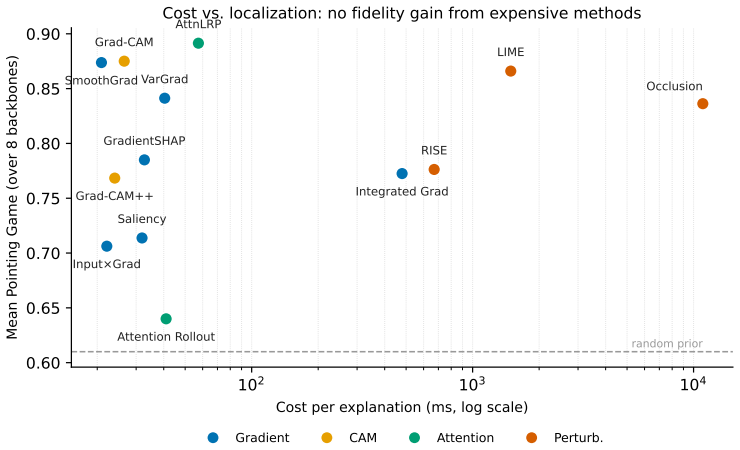
The paper's central claim is that attribution-method rankings are strongly architecture-dependent and do not transfer cleanly from CNNs to vision transformers. The evidence: mean pairwise Spearman correlation of method rankings across eight backbones is 0.35, far below the perfect-transfer value of 1.0 and barely above the permutation null, falling to 0.17 between ResNet-50 and the linear-attention EfficientViT-B2. Under the dense-mask Energy-Based Pointing Game, which the paper treats as the localization metric of record, no method exceeds 0.60 of attribution energy on the object; the bounding-box Pointing Game's near-perfect scores (several cells exactly 1.00) are shown to be metric satura
What carries the argument
The load-bearing instrument is a controlled benchmark grid: a fixed set of 1,000 images with dense segmentation masks, 13 attribution methods from four families, eight backbones spanning CNN, isotropic, hierarchical, multi-axis, hybrid, and linear-attention transformers, and five standardized metrics. The Energy-Based Pointing Game—the fraction of attribution energy inside the pixel-perfect object mask—is the non-saturating localization metric of record, and the mean pairwise Spearman rank correlation between backbone-specific method rankings is the transfer statistic. The paper also provides a mechanism-level explanation for one failure: Grad-CAM++ collapses under global attention because i
Load-bearing premise
The transfer-failure conclusion is measured with the bounding-box Pointing Game, a metric the paper itself shows is saturated on CNNs and most ViTs; if that compression drives the low rank correlations, the claim that rankings do not transfer is partly an artifact of the metric.
What would settle it
Run the full 13-method benchmark under the dense-mask Energy-Based Pointing Game on all eight backbones (currently EBPG is reported only for gradient and CAM families) and recompute the mean pairwise Spearman rank correlation across backbones; if it approaches 1.0, the transfer-failure claim collapses. A cheaper observation: compute that correlation from the EBPG columns already in Table 4; if the gradient/CAM rankings transfer strongly across architectures, metric saturation explains the 0.35 number.
If this is right
- Rankings from CNN-only XAI benchmarks cannot be used to choose explanation methods for transformer models without re-evaluation; the paper's Spearman correlations (0.35 overall, 0.17 for the CNN-to-linear-attention pair) quantify the mismatch.
- Grad-CAM is a low-cost, generally reliable localization default on CNNs and softmax-attention ViTs, but it should not be used on linear-attention architectures such as EfficientViT, where its spatial-map assumptions break.
- The standard faithfulness-correlation protocol (FC) does not discriminate between methods at this configuration (Friedman p=0.57); single-metric evaluations, and especially bounding-box localization alone, should be abandoned in favor of multi-axis reporting.
- Attention Rollout is the most stable explanation method but the least localized; it is appropriate only when robustness is the priority and spatial precision is not.
- Report dense-mask metrics such as the Energy-Based Pointing Game alongside, or instead of, the bounding-box Pointing Game, since the latter saturates and inflates apparent CAM performance.
Where Pith is reading between the lines
- If rankings are this architecture-dependent, XAI method choice should be conditioned on the target backbone, e.g., via a decision rule or model card that names the method verified for each architecture family; the benchmark's grid is the raw material for such a guide.
- The saturation diagnosis implies that many earlier CNN-era localization results near the 1.00 ceiling should be re-read as upper bounds on the metric, not evidence of near-perfect explanations; re-scoring those maps under a dense-mask metric is a cheap, direct check.
- The undefined cells for attention-native methods on modern attention variants (windowed, spatial-reduction, multi-axis, linear) mark a concrete research gap: deriving conservation-valid relevance-propagation rules for these attention mechanisms is a natural next step that would extend the benchmark.
- Because the paper's transfer-failure statistic is computed from bounding-box PG rankings, a strong test of its robustness is to recompute the Spearman correlation from the EBPG columns (Table 4) for the gradient and CAM families; if that correlation is high, metric compression, not architecture, may explain part of the transfer failure.
Editorial analysis
A structured set of objections, weighed in public.
Referee Report
Summary. The paper presents a controlled benchmark of 13 post-hoc attribution methods from four families (gradient, CAM, attention-native, perturbation) on eight backbones spanning ResNet-50, isotropic ViT-B/16, hierarchical Swin-B and PVT-v2-B2, multi-axis MaxViT-S, hybrid MobileViT-v2, and linear-attention EfficientViT-B1/B2, using 1,000 ImageNet-S images and a fixed Quantus-based evaluation protocol. The central claim is that attribution rankings established on CNNs do not transfer reliably to transformer-based models, with linear-attention architectures causing the most dramatic failures (e.g., Grad-CAM Pointing Game drops from 0.98 on ResNet-50 to 0.55 on EfficientViT-B2). The paper further argues that the apparent dominance of CAM methods under the bounding-box Pointing Game is largely metric saturation, that dense-mask Energy-Based Pointing Game (EBPG) is the more informative localization metric and no method exceeds 0.60 under it, and that the standard faithfulness-correlation protocol does not discriminate methods at the tested scale.
Significance. If the result holds, the paper is a useful contribution to XAI benchmarking: it broadens the architecture space beyond CNNs, applies a fixed protocol across backbones, and provides a cautionary example of metric saturation. The paper is unusually transparent for an empirical benchmark: it derives random baselines for both localization metrics (0.61 bounding-box prior and 0.18 EBPG floor), explicitly acknowledges the saturation of the Pointing Game, reports median-based reruns for heavy-tailed robustness values, discloses the reduced FC budget, and leaves attention-native cells undefined rather than filling them with incompatible fallback implementations. These strengths make the qualitative direction of the findings credible. However, the main quantitative summary of non-transfer — the pairwise Spearman correlation computed in Section 7.1.1 — is derived from exactly the bounding-box Pointing Game that the paper itself shows to be saturated, and the non-saturating EBPG metric is not used to re-test the rank-transfer claim. This gap is load-bearing for the headline statistic and needs to be addressed.
major comments (3)
- [Section 7.1.1 / Figure 5] The main quantitative evidence for 'rankings do not transfer' is the mean pairwise Spearman correlation of 0.35 (95% CI [0.21, 0.48]) and the CNN-EfficientViT value of 0.17, computed from bounding-box Pointing Game ranks. But the same section documents that this metric is saturated on CNNs and most ViTs: on ResNet-50 eight of eleven methods score at least 0.92, and several cells are exactly 1.00. Under ceiling compression, small rank differences among the top methods are close to the scale of single-seed noise, so the reported Spearman values may partly measure metric saturation rather than genuine transfer failure. Please recompute rank correlations on the non-saturating EBPG scores for the six methods available in Table 4, and report whether the 0.35 / 0.17 pattern persists; alternatively, explicitly re-frame the 0.35 statistic as a bounding-box-PG-specific finding and rely on the docu
- [Figure 4 versus Sections 5.3 and 7.1 / Table 3] Figure 4 displays AttnLRP Pointing Game values for Swin-B, PVT-v2, MaxViT-S, MobileViT, and EfficientViT-B1/B2 (0.99, 0.80, 0.86, 0.95, 0.87, 0.94), but Sections 5.3 and 7.1 state that AttnLRP is defined only for the isotropic ViT-B/16, and Table 3 marks those cells as n/a. This is an internal inconsistency in a key figure. Please correct the figure or explain the origin of those values; as presented, it directly contradicts the paper's own data-completeness policy, which is otherwise a strength of the manuscript.
- [Section 7.1.1 / Table 4] The paper declares EBPG the 'localization metric of record' and uses it to show that bounding-box PG overstates success. However, EBPG is computed for only six of the thirteen methods (Saliency, Input×Grad, SmoothGrad, VarGrad, Grad-CAM, Grad-CAM++), omitting IG and GradientSHAP as well as all perturbation methods. Consequently, the 13-method / 11-method transfer claim is not tested under the non-saturating metric. Please either extend EBPG to at least the remaining gradient methods and the cheaper perturbation methods, or explicitly restrict the quantified transfer conclusion to the six-method EBPG subset and treat the broader claim as supported by the qualitative and mechanistic evidence (rank reversals, linear-attention collapse, MS spikes). The current presentation uses the metric of record for local saturation but not for the headline transfer statistic, which weakens the internal c
minor comments (5)
- [Figure 5 caption] The caption states 'Pointing Game rank of the ten methods applicable to every backbone,' but the listed methods are eleven (Saliency, IG, Input×Grad, SmoothGrad, VarGrad, GradientSHAP, Grad-CAM, Grad-CAM++, Occlusion, RISE, LIME). Please correct the number.
- [Table 4 caption] The caption says EBPG is computed for the 'gradient and CAM families,' yet Integrated Grad and GradientSHAP are absent from the table. If these methods were omitted for computational or methodological reasons, state that explicitly; otherwise include them or adjust the caption.
- [Section 6.1 / 8.2] The backend- and target-layer sensitivity of plain Grad-CAM MS values (1.94 in Table 5 versus 0.27 in Table 11 on ViT-B/16) is disclosed late in Section 8.2. Consider moving a brief version of this caveat to Section 6.1 so readers of Table 5 are warned earlier that absolute robustness values depend on implementation choices.
- [Section 5.2] The paper explicitly acknowledges that backbones are matched by tier rather than parameter count and that architecture cannot be separated from model scale. This is appropriately disclosed, but the phrase 'controlled benchmark' in the title and abstract should be read with that caveat in mind; a sentence in the abstract noting that backbones differ in scale would preempt overstatement.
- [Section 6.3] The FC configuration (20 runs instead of the Quantus default of 100, subset size 224) is stated clearly, and the paper correctly limits the FC conclusion to that configuration. Consider reporting the FC result also with a small run-count sweep (e.g., 100 runs on a subset of methods) to increase confidence that the non-discrimination finding is not an artifact of the reduced budget.
Circularity Check
No significant circularity: benchmark conclusions are direct empirical measurements, with acknowledged metric-saturation caveats but no derivation-by-construction.
full rationale
This is an empirical benchmark, not a derivation. The claims (rank transfer, Grad-CAM collapse on linear attention, metric non-discrimination) are direct aggregations of measured attribution heatmaps against external ImageNet-S masks and ground-truth boxes; no fitted parameter is renamed a prediction, no equation defines X in terms of Y, and no load-bearing premise rests on a self-citation. The most plausible circularity-adjacent concern is that the transfer statistic (mean pairwise Spearman = 0.35, Section 7.1.1) is computed from bounding-box Pointing Game ranks that the paper itself shows to saturate on CNNs and several ViTs (eight of eleven methods ≥ 0.92 on ResNet-50). That is a validity threat: the statistic may partly encode metric compression or ceiling noise. But it is not circularity in the reduction sense: the rankings are not defined in terms of the transfer conclusion, and the paper explicitly identifies the saturation, reports the dense-mask EBPG as the metric of record, and shows Grad-CAM's apparent dominance halves under EBPG. Likewise, the negative FC conclusion is explicitly scoped to the tested Quantus budget (subset size 224, 20 runs) and the random baselines are computed from the same data, neither of which makes the result equivalent to its inputs. One internal inconsistency should be corrected — the Figure 4 heat-block shows AttnLRP values on seven backbones while Sections 5.3 and 7.1 declare those cells undefined — but this is a reporting error, not a circular step. External results from Quantus, Captum, pytorch-grad-cam, and timm checkpoints constitute independent support; no self-citation is load-bearing.
Axiom & Free-Parameter Ledger
free parameters (4)
- FC evaluation budget =
subset_size=224, run_count=20 (Quantus default is 100 runs)
- Stochastic seed =
0
- Max-Sensitivity perturbation budget =
nr_samples=3
- Faithfulness Estimate iteration size =
448 features per step
axioms (5)
- domain assumption Attribution quality is sufficiently captured by the five Quantus metric families (FC, FE, PG/EBPG, MS, SP)
- domain assumption The predicted class is a valid explanation target
- domain assumption Backbones are comparable enough to attribute score differences to architecture
- domain assumption Canonical CAM target layers are comparable across architectures
- domain assumption The reduced FC configuration represents the community-standard faithfulness protocol
Cite this review
Pith. "Pith review of Does Explainability Transfer? A Controlled Benchmark of Attribution Methods on Vision Transformers and CNNs." pith.science (2026). https://pith.science/paper/GKC4LGH4
@misc{pith2026260802396,
  author       = {Pith},
  title        = {Pith review of: Does Explainability Transfer? A Controlled Benchmark of Attribution Methods on Vision Transformers and CNNs},
  year         = {2026},
  howpublished = {\url{https://pith.science/paper/GKC4LGH4}},
  note         = {Machine review of arXiv:2608.02396}
}
read the original abstract
Most evidence on the effectiveness of explainable artificial intelligence (XAI) attribution methods has been established on convolutional neural networks (CNNs), with limited investigation into whether these conclusions generalize to the diverse Vision Transformer (ViT) architectures that now dominate computer vision. This paper presents a controlled benchmark that evaluates attribution quality across five dimensions: faithfulness, localization, robustness, complexity, and computational cost. A standardized framework assesses 13 attribution methods from four algorithmic families on eight representative backbones spanning CNNs, isotropic ViTs, hierarchical transformers, hybrid architectures, and linear-attention transformers. The results show that attribution performance is strongly architecture-dependent and that rankings established on CNNs do not reliably transfer to transformer-based models. CAM-based methods achieve the highest scores under the conventional bounding-box localization metric on CNNs and most ViTs but perform poorly on linear-attention architectures. Pixel-level dense-mask evaluation further reveals that these gains largely reflect metric saturation rather than accurate localization. CAM-based methods also exhibit limited robustness on global-attention transformers, whereas attention rollout provides consistently stable explanations with poor localization. Furthermore, faithfulness correlation offers limited discrimination between attribution methods, highlighting the limitations of single-metric evaluation. These findings challenge prevailing conclusions on attribution performance and demonstrate the need for architecture-aware, multi-dimensional evaluation. The open-source code for the evaluation framework and benchmark results is available at https://github.com/Nishan-Charlie/VIT_XAI_Bench.
Figures




Reference graph
Works this paper leans on
-
[1]
Russakovsky, J
O. Russakovsky, J. Deng, H. Su, J. Krause, S. Satheesh, S. Ma, Z. Huang, A. Karpathy, A. Khosla, M. Bernstein, A. C. Berg, L. Fei-Fei, Imagenet large scale visual recognition challenge, International Journal of Com- puter Vision (IJCV) 115 (3) (2015) 211–252
2015
-
[2]
K. He, X. Zhang, S. Ren, J. Sun, Deep residual learning for image recog- nition, in: IEEE Conference on Computer Vision and Pattern Recognition (CVPR), 2016, pp. 770–778
2016
-
[3]
Z. Liu, H. Mao, C.-Y . Wu, C. Feichtenhofer, T. Darrell, S. Xie, A con- vnet for the 2020s, in: IEEE Conference on Computer Vision and Pattern Recognition (CVPR), 2022
2022
-
[4]
Nauta, J
M. Nauta, J. Trienes, S. Pathak, E. Nguyen, M. Peters, Y . Schmitt, J. Schlötterer, M. Van Keulen, C. Seifert, From anecdotal evidence to quantitative evaluation methods: A systematic review on evaluating ex- plainable ai, ACM Computing Surveys 55 (13s) (2023) 1–42
2023
-
[5]
S. Bach, A. Binder, G. Montavon, F. Klauschen, K.-R. Müller, W. Samek, On pixel-wise explanations for non-linear classifier decisions by layer- wise relevance propagation, PLoS ONE 10 (7) (2015)
2015
-
[6]
Bodria, F
F. Bodria, F. Giannotti, R. Guidotti, F. Naretto, D. Pedreschi, S. Rinzivillo, Benchmarking and survey of explanation methods for black box models: F. bodria et al., Data Mining and Knowledge Discovery 37 (5) (2023) 1719–1778
2023
-
[7]
Dosovitskiy, L
A. Dosovitskiy, L. Beyer, A. Kolesnikov, D. Weissenborn, X. Zhai, T. Un- terthiner, M. Dehghani, M. Minderer, G. Heigold, S. Gelly, J. Uszkoreit, N. Houlsby, An image is worth 16x16 words: Transformers for image recognition at scale, in: International Conference on Learning Represen- tations (ICLR), 2021
2021
-
[8]
Raghu, T
M. Raghu, T. Unterthiner, S. Kornblith, C. Zhang, A. Dosovitskiy, Do vision transformers see like convolutional neural networks?, in: Advances in Neural Information Processing Systems (NeurIPS), V ol. 34, 2021, pp. 12116–12128
2021
-
[9]
Chefer, S
H. Chefer, S. Gur, L. Wolf, Transformer interpretability beyond atten- tion visualization, in: IEEE Conference on Computer Vision and Pattern Recognition (CVPR), 2021
2021
-
[10]
J. Wu, W. Kang, H. Tang, Y . Hong, Y . Yan, On the faithfulness of vision transformer explanations, in: Proceedings of the IEEE/CVF Conference on Computer Vision and Pattern Recognition, 2024, pp. 10936–10945
2024
-
[11]
Simonyan, A
K. Simonyan, A. Vedaldi, A. Zisserman, Deep inside convolutional net- works: Visualising image classification models and saliency maps, in: ICLR Workshop, 2014
2014
-
[12]
Sundararajan, A
M. Sundararajan, A. Taly, Q. Yan, Axiomatic attribution for deep net- works, in: International Conference on Machine Learning (ICML), 2017
2017
-
[13]
R. R. Selvaraju, M. Cogswell, A. Das, R. Vedantam, D. Parikh, D. Ba- tra, Grad-cam: Visual explanations from deep networks via gradient- based localization, in: IEEE International Conference on Computer Vi- sion (ICCV), 2017
2017
-
[14]
M. D. Zeiler, R. Fergus, Visualizing and understanding convolutional net- works, in: European Conference on Computer Vision (ECCV), 2014
2014
-
[15]
Petsiuk, A
V . Petsiuk, A. Das, K. Saenko, Rise: Randomized input sampling for explanation of black-box models, in: British Machine Vision Conference (BMVC), 2018
2018
-
[16]
Abnar, W
S. Abnar, W. Zuidema, Quantifying attention flow in transformers, in: Annual Meeting of the Association for Computational Linguistics (ACL), 2020
2020
-
[17]
Achtibat, S
R. Achtibat, S. M. V . Hatefi, M. Dreyer, A. Jain, T. Wiegand, S. La- puschkin, W. Samek, AttnLRP: Attention-aware layer-wise relevance propagation for transformers, in: Proceedings of the 41st International Conference on Machine Learning (ICML), 2024
2024
-
[18]
R. Brandt, D. Raatjens, G. Gaydadjiev, Precise benchmarking of explain- able ai attribution methods (2023).arXiv:2308.03161
Pith/arXiv arXiv 2023
-
[19]
Hedström, L
A. Hedström, L. Weber, D. Krakowczyk, D. Bareeva, F. Motzkus, W. Samek, S. Lapuschkin, M. M.-C. Höhne, Quantus: An explainable ai toolkit for responsible evaluation of neural network explanations and beyond, Journal of Machine Learning Research (JMLR) 24 (2023)
2023
-
[20]
Touvron, M
H. Touvron, M. Cord, M. Douze, F. Massa, A. Sablayrolles, H. Jégou, Training data-efficient image transformers & distillation through atten- tion, in: International Conference on Machine Learning (ICML), 2021
2021
-
[21]
Z. Liu, Y . Lin, Y . Cao, H. Hu, Y . Wei, Z. Zhang, S. Lin, B. Guo, Swin transformer: Hierarchical vision transformer using shifted windows, in: IEEE/CVF International Conference on Computer Vision (ICCV), 2021
2021
-
[22]
Mehta, M
S. Mehta, M. Rastegari, Mobilevit: Light-weight, general-purpose, and mobile-friendly vision transformer, in: International Conference on Learning Representations (ICLR), 2022
2022
-
[23]
H. Cai, J. Li, M. Hu, C. Gan, S. Han, Efficientvit: Lightweight multi- scale attention for high-resolution dense prediction, in: IEEE/CVF Inter- national Conference on Computer Vision (ICCV), 2023
2023
-
[24]
Shrikumar, P
A. Shrikumar, P. Greenside, A. Kundaje, Learning important features through propagating activation differences, in: International Conference on Machine Learning (ICML), 2017
2017
-
[25]
D. Smilkov, N. Thorat, B. Kim, F. Viégas, M. Wattenberg, Smooth- grad: Removing noise by adding noise, arXiv preprint arXiv:1706.03825 (2017)
Pith/arXiv arXiv 2017
-
[26]
Adebayo, J
J. Adebayo, J. Gilmer, M. Muelly, I. Goodfellow, M. Hardt, B. Kim, San- ity checks for saliency maps, in: Advances in Neural Information Pro- cessing Systems (NeurIPS), 2018
2018
-
[27]
S. M. Lundberg, S.-I. Lee, A unified approach to interpreting model predictions, in: Advances in Neural Information Processing Systems (NeurIPS), 2017
2017
-
[28]
Chattopadhay, A
A. Chattopadhay, A. Sarkar, P. Howlader, V . N. Balasubramanian, Grad- cam++: Generalized gradient-based visual explanations for deep convo- lutional networks, in: IEEE Winter Conference on Applications of Com- puter Vision (W ACV), 2018
2018
-
[29]
why should i trust you?
M. T. Ribeiro, S. Singh, C. Guestrin, “why should i trust you?”: Ex- plaining the predictions of any classifier, in: ACM SIGKDD International Conference on Knowledge Discovery and Data Mining (KDD), 2016
2016
-
[30]
Hesse, S
R. Hesse, S. Schaub-Meyer, S. Roth, Funnybirds: A synthetic vision dataset for a part-based analysis of explainable ai, in: IEEE International Conference on Computer Vision (ICCV), 2023
2023
-
[31]
Arras, A
L. Arras, A. Osman, W. Samek, Clevr-xai: A benchmark dataset for the ground truth evaluation of neural network explanations, Information Fu- sion 81 (2022) 14–40
2022
-
[32]
Hooker, D
S. Hooker, D. Erhan, P.-J. Kindermans, B. Kim, A benchmark for inter- pretability methods in deep neural networks, Advances in Neural Infor- mation Processing Systems (NeurIPS) (2019)
2019
-
[33]
S. Rao, M. Böhle, B. Schiele, Towards better understanding attribution 18 methods, in: Proceedings of the ieee/cvf conference on computer vision and pattern recognition, 2022, pp. 10223–10232
2022
-
[34]
Bhatt, A
U. Bhatt, A. Weller, J. M. F. Moura, Evaluating and aggregating feature- based model explanations, in: International Joint Conference on Artificial Intelligence (IJCAI), 2020
2020
-
[35]
Alvarez-Melis, T
D. Alvarez-Melis, T. S. Jaakkola, Towards robust interpretability with self-explaining neural networks, in: Advances in Neural Information Pro- cessing Systems (NeurIPS), 2018
2018
-
[36]
Zhang, S
J. Zhang, S. A. Bargal, Z. Lin, X. Shen, J. Brandt, S. Sclaroff, Top-down neural attention by excitation backprop, International Journal of Com- puter Vision (IJCV) 126 (10) (2018) 1084–1102
2018
-
[37]
Yeh, C.-Y
C.-K. Yeh, C.-Y . Hsieh, A. S. Suggala, D. I. Inouye, P. Ravikumar, On the (in)fidelity and sensitivity of explanations, in: Advances in Neural Information Processing Systems (NeurIPS), 2019
2019
-
[38]
Chalasani, J
P. Chalasani, J. Chen, A. R. Chowdhury, X. Wu, S. Jha, Concise expla- nations of neural networks using adversarial training, in: International Conference on Machine Learning (ICML), 2020
2020
-
[39]
Z. Tu, H. Talebi, H. Zhang, F. Yang, P. Milanfar, A. Bovik, Y . Li, Maxvit: Multi-axis vision transformer, in: European Conference on Computer Vi- sion (ECCV), 2022
2022
-
[40]
W. Wang, E. Xie, X. Li, D.-P. Fan, K. Song, D. Liang, T. Lu, P. Luo, L. Shao, Pyramid vision transformer: A versatile backbone for dense pre- diction without convolutions, in: Proceedings of the IEEE/CVF Interna- tional Conference on Computer Vision (ICCV), 2021
2021
-
[41]
Gao, Z.-Y
S. Gao, Z.-Y . Li, M.-H. Yang, M.-M. Cheng, J. Han, P. Torr, Large-scale unsupervised semantic segmentation, IEEE Transactions on Pattern Anal- ysis and Machine Intelligence (TPAMI) (2022)
2022
-
[42]
N. Kokhlikyan, V . Miglani, M. Martin, E. Wang, B. Alsallakh, J. Reynolds, A. Melnikov, N. Kliushkina, C. Araya, S. Yan, O. Reblitz- Richardson, Captum: A unified and generic model interpretability library for pytorch, arXiv preprint arXiv:2009.07896 (2020)
Pith/arXiv arXiv 2009
-
[43]
Gildenblat, contributors, Pytorch library for cam methods,https:// github.com/jacobgil/pytorch-grad-cam(2021)
J. Gildenblat, contributors, Pytorch library for cam methods,https:// github.com/jacobgil/pytorch-grad-cam(2021)
2021
-
[44]
Demšar, Statistical comparisons of classifiers over multiple data sets, Journal of Machine Learning Research (JMLR) 7 (2006) 1–30
J. Demšar, Statistical comparisons of classifiers over multiple data sets, Journal of Machine Learning Research (JMLR) 7 (2006) 1–30
2006
-
[45]
Oquab, T
M. Oquab, T. Darcet, T. Moutakanni, et al., Dinov2: Learning robust visual features without supervision, Transactions on Machine Learning Research (TMLR) (2024)
2024
-
[46]
K. He, X. Chen, S. Xie, Y . Li, P. Dollár, R. Girshick, Masked autoen- coders are scalable vision learners, in: IEEE Conference on Computer Vision and Pattern Recognition (CVPR), 2022. 19
2022
This paper was first reviewed by deepseek-v4-flash on August 4, 2026.
discussion (0)
Sign in with ORCID, Apple, or X to comment. Anyone can read and Pith papers without signing in.