REVIEW 2 major objections 3 minor 39 references
Walkable to Whom? Capturing Subjective Variability in Walkability Perception Using Multimodal Deep Learning
T0 review · 2 major / 3 minor · reviewed 2026-08-10 · deepseek-v4-flash
Pith's one-line read User-conditioned deep learning predicts walkability ratings better when it knows who is rating.
desk verdict Great dataset and a clean viewpoint comparison, but the headline user-conditioning gain is likely inflated by rater leakage; the paper needs a rater-disjoint split before the "who is evaluating" claim can stand. read the letter →
The pith
A machine-rendered reading of the paper's core claim, the machinery that carries it, and where it could break.
The reading
What carries the argument
The load-bearing mechanism is a multimodal fusion architecture that jointly encodes a sidewalk-view panorama and a respondent profile. The image encoder is a Swin-Tiny vision transformer pretrained on ImageNet-1K; the respondent encoder is an FT-Transformer that tokenises each categorical attribute (age, gender, residence, upbringing, walking frequency, disability, childhood country) into dedicated embeddings; a three-block Transformer fusion module combines the two 768-dimensional representations; and a CORAL ordinal head converts the joint embedding into a rank-consistent prediction on the five-point scale. The same framework is used to test the viewpoint hypothesis through a matched sidewalk-versus-street image comparison, and the dataset itself is constructed via Threshold-Constrained Stratified Sampling so that the sampled images preserve the real-world distribution of walkability-relevant street attributes.
What would settle it
Retrain the user-conditioned model on one disjoint set of respondents and evaluate it on a different set of respondents who rated the same images; if the quadratic weighted kappa gain over the image-only baseline shrinks to near zero, the reported 65% improvement does not represent a transferable attribute-conditioning effect.
Extended reading notes
Core claim
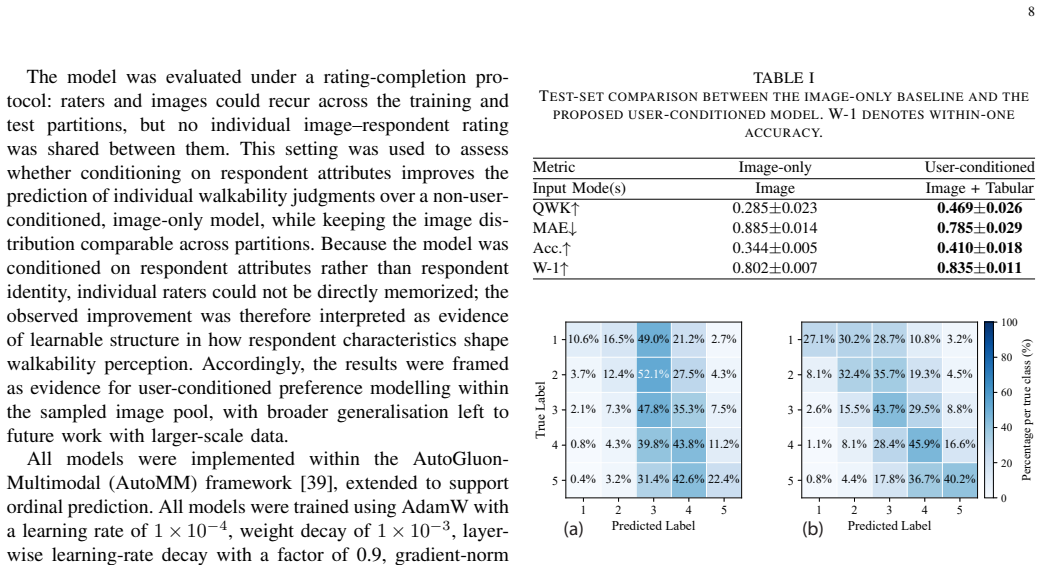
The paper's central discovery is that who is evaluating an environment carries predictive signal beyond what the pixels alone provide. The authors formulate visual walkability perception as a user-conditioned prediction task, where the target rating for an image is conditioned on an explicit respondent attribute vector rather than on a shared mean score. In their experiments, conditioning on respondent attributes improves quadratic weighted kappa from 0.285 to 0.469 on a held-out rating test, a relative improvement of roughly 65%, with the largest gains concentrated at the extremes of the five-point scale where the image-only model fails most. They interpret this as evidence that individual-level variation in perceived walkability is learnable and systematic, not merely noise to be averaged away, and they position the work as the first to apply user-conditioned prediction to walkability perception.
Load-bearing premise
The model is said to generalise to new raters because it conditions on attributes rather than on identity, yet the same raters appear in both training and test sets; if a rater's attribute combination is nearly unique, the model could be memorising that rater's average tendency rather than learning a general mapping from attributes to perception.
Editorial extensions
If this is right
- Aggregated walkability scores that ignore the evaluator will understate disagreement and may bias planning decisions toward the average user.
- Sidewalk-view imagery should be preferred over vehicle-mounted street-view imagery in walkability perception surveys, since the chosen viewpoint materially changes the ratings obtained.
- User-conditioned predictions can be inserted into route-choice cost functions, enabling personalised pedestrian routing that reflects an individual's own perception of walkability rather than a city-wide mean.
- The model's improved recall at the low and high ends of the rating scale suggests that respondent attributes help correct the central-tendency bias that plagues image-only predictors.
- Respondent attributes shape how people differentiate between environments (e.g., urban versus non-urban) more than they shift overall rating levels, so future models should capture attribute-by-image interactions rather than simple additive offsets.
Reading between the lines
- If the same attribute-conditional gains replicate on a held-out set of raters who never appear in training, the approach would generalise beyond the current sample; if not, the gain may partly reflect raters' idiosyncratic scale usage rather than generalisable demographic structure.
- The attribute set used here (demographics, residence, walking habits) is coarse relative to the full space of individual preferences, so true personalisation would likely require richer signals such as personality traits or direct per-user feedback.
- The viewpoint result suggests that any street-view-based walkability dataset, including large public benchmarks, carries an inherent bias that could be corrected by collecting matched sidewalk-view imagery.
- A practical extension would be to use the user-conditioned model to generate 'walkability maps for demographic profiles', giving planners a way to see where different populations would feel comfortable walking.
Editorial analysis
A structured set of objections, weighed in public.
Referee Report
Summary. The paper introduces a new sidewalk-view walkability perception dataset with 29,870 ratings from 1,196 respondents across Australian urban, suburban, and regional settings, links each rating to seven respondent attributes, and proposes a multimodal deep learning framework that conditions walkability prediction on both image content and respondent attributes. A supplementary viewpoint comparison shows that matched sidewalk-view images receive higher walkability ratings than street-view images. The user-conditioned model is reported to improve quadratic weighted kappa from 0.285 to 0.469 over an image-only baseline, and the paper argues that respondent attributes carry predictive signal beyond image content alone.
Significance. If the central claim is valid, this is a useful contribution: the dataset is novel in pairing sidewalk-view imagery with individual-level attributes and covers suburban and regional contexts that are rare in urban perception datasets. The viewpoint comparison is a clean demonstration that imagery source matters for perceptual ratings. The modeling framework is also, to my knowledge, a first for walkability perception and could inform personalized pedestrian routing. The paper reports five-seed runs, ablations, and clearly disclosed limitations, which are strengths. However, the headline claim that 'who is evaluating' matters beyond image content is not yet established because the evaluation protocol allows the same respondents to appear in both training and test partitions, so the attribute vector may act as a near-unique identifier rather than as a generalizable descriptor.
major comments (2)
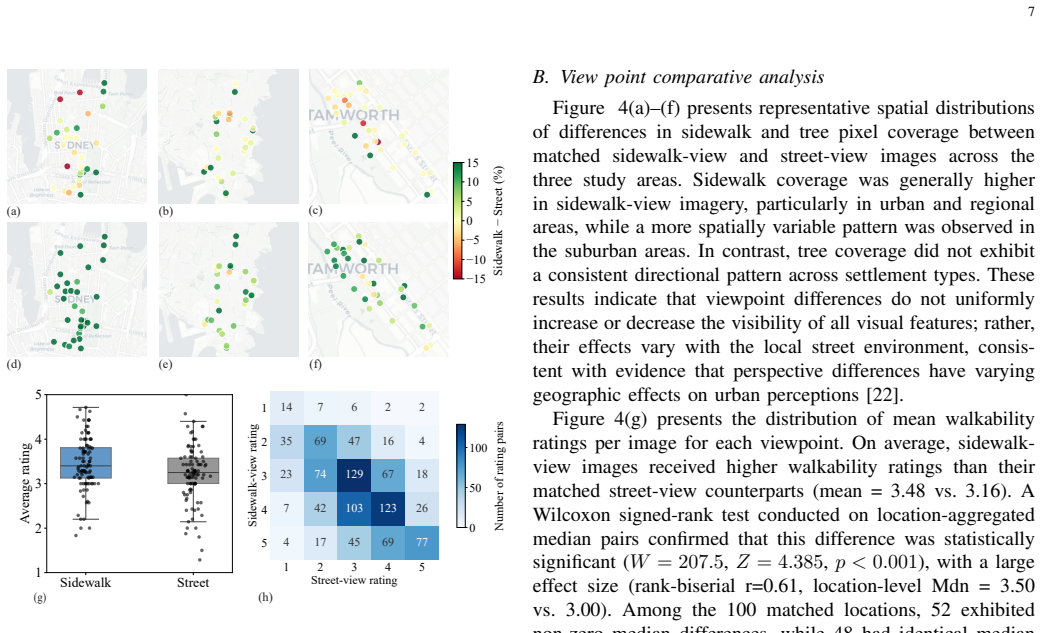
- [IV-C1] The rating-completion protocol explicitly allows raters and images to recur across training and test partitions, with only the individual image-respondent rating held out. The paper argues that because conditioning is on respondent attributes rather than respondent identity, 'individual raters could not be directly memorized.' This argument fails if attribute combinations are near-unique across the 1,196 respondents: with seven categorical attributes, many respondents may have rare or unique attribute profiles, and the model can use the attribute vector as a de facto rater ID to learn per-rater average rating tendencies. The 0.184 QWK gain in Table I could then reflect memorization of rater-specific offsets rather than generalizable attribute-driven perception. To support the abstract's claim that 'who is evaluating an environment carries predictive indication beyond image content alone,' the authors should report a rater-disjoint (or rater-grouped) split, where no respondent appears in both training and test, and also report the number of unique attribute profiles in the dataset. Without this experiment, the central claim is only established in-sample.
- [IV-D] The permutation-importance analysis is interpreted as a relative ranking of attribute influence, but under the same leakage concern, permuting any one attribute breaks the potential rater-identification mapping and can cause a large QWK drop regardless of the attribute's true psychological relevance. The paper acknowledges that permutation importance can be inflated for correlated predictors, yet it still frames the ranking as meaningful for understanding which respondent attributes matter. A more robust alternative would be conditional permutation importance or a model trained with a rater-disjoint split before computing importance. As written, Table IV is consistent with memorization of unique attribute combinations and does not provide independent evidence for the causal role of individual attributes.
minor comments (3)
- [IV-B] The heading 'View point comparative analysis' should be 'Viewpoint comparative analysis' for consistency and to avoid a typo.
- [III-C1] The phrase 'learning rate of1×10 −4' in the experimental setup is missing a space; it should read 'learning rate of 1 × 10⁻⁴'.
- [Fig. 4] The caption for Fig. 4 is slightly ambiguous: '(d–f) tree pixel coverage difference' can be read as applying to all three panels; consider clarifying that (a–c) show sidewalk coverage and (d–f) show tree coverage.
Circularity Check
No significant circularity: the main results are empirical comparisons on held-out rating pairs, and no load-bearing claim is defined in terms of its own outputs.
full rationale
The paper's central claim is an empirical comparison between an image-only baseline and a user-conditioned model on a held-out set of image–respondent rating pairs. The model is trained with the CORAL ordinal loss on training ratings, and test QWK is computed on ratings not used to set model constants; no test label enters the training objective or model selection. The user-conditioned improvement is therefore a measured outcome, not a fitted parameter renamed as a prediction. The viewpoint comparison is a separate matched-pair Wilcoxon test on independently collected ratings, and the dataset provenance is disclosed without entering the loss. The component ablations and permutation importance are post-hoc analyses; the paper itself flags the known inflation of permutation importance under correlated predictors and does not treat it as a decomposition. The principal threat is the rating-completion protocol, in which the same raters may appear in training and test, so near-unique attribute combinations could let the model memorize rater tendencies; however, this is a generalization and soundness concern about leakage, not a circularity in which the prediction is equivalent to the input by construction. The paper explicitly limits its generalization claim to the sampled image pool and leaves rater-disjoint evaluation to future work. There are no load-bearing self-citations or imported uniqueness theorems. Score 0.
Assumptions & free parameters
free parameters (3)
- TCSS distributional tolerance delta =
0.05
- CORAL decoding threshold =
0.5
- Training hyperparameters =
lr 1e-4, weight decay 1e-3, layer decay 0.9, batch 128, warmup 10%, patience 10
assumptions (6)
- domain assumption Self-reported respondent attributes are accurate and stable
- domain assumption Center 180 degree crop of the equirectangular panorama represents the pedestrian-relevant view
- domain assumption Matched street-view and sidewalk-view image pairs are comparable except for viewpoint
- standard math QWK is an appropriate agreement metric for ordinal Likert ratings
- standard math The null permutation distribution for inter-rater kappa is valid
- domain assumption The attribute vector does not function as a near-unique rater identifier
Cite this review
Pith. "Pith review of Walkable to Whom? Capturing Subjective Variability in Walkability Perception Using Multimodal Deep Learning." pith.science (2026). https://pith.science/paper/NZCC3WRH
@misc{pith2026260806934,
  author       = {Pith},
  title        = {Pith review of: Walkable to Whom? Capturing Subjective Variability in Walkability Perception Using Multimodal Deep Learning},
  year         = {2026},
  howpublished = {\url{https://pith.science/paper/NZCC3WRH}},
  note         = {Machine review of arXiv:2608.06934}
}
read the original abstract
Visual perception of walkability varies substantially across individuals, reflecting differences in personal characteristics, experiences, and preferences. Existing studies, however, often reduce these diverse judgements to aggregated scores, implicitly assuming uniform perception, and commonly rely on vehicle-mounted street-view imagery that does not reflect the pedestrian's visual experience. This paper introduces a dataset of 29,870 walkability ratings from 1,196 respondents, linking sidewalk-view imagery across urban, suburban, and regional Australian environments with individual rater attributes, and proposes the first user-conditioned multimodal deep learning framework for walkability perception, fusing visual features with respondent-level representations. A viewpoint-comparison study shows that sidewalk-view images receive significantly higher walkability ratings than matched street-view images, indicating that imagery source is a substantive design decision in perception surveys. The user-conditioned model improves rank agreement with observed ratings by 65% over an image-only baseline (quadratic weighted kappa 0.47 vs. 0.29), demonstrating that who is evaluating an environment carries predictive indication beyond image content alone. These findings support moving from aggregated, observer-independent walkability scores toward models that represent diverse users, enabling more inclusive assessment of pedestrian environments.
Figures


Figures from the paper (2 more)
Reference graph
Works this paper leans on
-
[1]
D. T. Duncan, J. Aldstadt, J. Whalen, S. J. Melly, and S. L. Gortmaker, “Validation of Walk Score for estimating neighborhood walkability: An analysis of four US metropolitan areas,”International Journal of Environmental Research and Public Health, vol. 8, no. 11, pp. 4160– 4179, 2011
work page 2011
-
[2]
H. Zhou, S. He, Y . Cai, M. Wang, and S. Su, “Social inequalities in neighborhood visual walkability: Using street view imagery and deep learning technologies to facilitate healthy city planning,”Sustainable Cities and Society, vol. 50, Art. no. 101605, 2019
work page 2019
-
[3]
U. Jehle, M. T. Baquero Larriva, M. BaghaiePoor, and B. B ¨uttner, “How does pedestrian accessibility vary for different people? Development of a perceived user-specific accessibility measure for walking (PAW),” Transportation Research Part A: Policy and Practice, vol. 189, p. 104203, 2024
work page 2024
-
[4]
Understanding urban perception with visual data: A systematic review,
K. Ito, Y . Kang, Y . Zhang, F. Zhang, and F. Biljecki, “Understanding urban perception with visual data: A systematic review,”Cities, vol. 152, Art. no. 105169, 2024
work page 2024
-
[5]
Y . Li, N. Yabuki, and T. Fukuda, “Measuring visual walkability perception using panoramic street view images, virtual reality, and deep learning,” Sustainable Cities and Society, vol. 86, p. 104140, 2022
work page 2022
-
[6]
Global urban visual perception varies across demograph- ics and personalities,
M. Quintana, Y . Gu, X. Liang, Y . Hou, K. Ito, Y . Zhu, M. Abdelrahman, and F. Biljecki, “Global urban visual perception varies across demograph- ics and personalities,”Nature Cities, pp. 1–15, 2025
work page 2025
-
[7]
Geographic identity and perceptions of walkable space,
C. Dickinson, K. Manaugh, P. Pathak, and R. Sengupta, “Geographic identity and perceptions of walkable space,”Travel Behaviour and Society, vol. 34, p. 100703, 2024
work page 2024
-
[8]
K. Ito, M. Quintana, X. Han, R. Zimmermann, and F. Biljecki, “Translat- ing street view imagery to correct perspectives to enhance bikeability and walkability studies,”International Journal of Geographical Information Science, 2024
work page 2024
Show all 39 references
-
[9]
Designing effective image-based surveys for urban visual perception,
Y . Gu, M. Quintana, X. Liang, K. Ito, W. Yap, and F. Biljecki, “Designing effective image-based surveys for urban visual perception,”Landscape and Urban Planning, vol. 260, p. 105368, 2025
2025
-
[10]
Measuring the unmeasurable: Urban design qualities related to walkability,
R. Ewing and S. Handy, “Measuring the unmeasurable: Urban design qualities related to walkability,”Journal of Urban Design, vol. 14, no. 1, pp. 65–84, 2009
2009
-
[11]
Deep learning the city: Quantifying urban perception at a global scale,
A. Dubey, N. Naik, D. Parikh, R. Raskar, and C. A. Hidalgo, “Deep learning the city: Quantifying urban perception at a global scale,” inProc. European Conf. Computer Vision (ECCV), 2016, pp. 196–212
2016
-
[12]
Practical multicriteria urban bicycle routing,
J. Hrn ˇc´ıˇr, P. ˇZileck´y, Q. Song, and M. Jakob, “Practical multicriteria urban bicycle routing,”IEEE Transactions on Intelligent Transportation Systems, vol. 18, no. 3, pp. 493–504, 2017
2017
-
[13]
Response quality checks,
Qualtrics, “Response quality checks,” 2024. [Online]. Avail- able:https://www.qualtrics.com/support/survey-platform/survey-module/ survey-checker/response-quality/. Accessed: Aug. 2, 2025
2024
-
[14]
Towards automatic assess- ment of perceived walkability,
I. Ble ˇci´c, A. Cecchini, and G. A. Trunfio, “Towards automatic assess- ment of perceived walkability,” inProc. Int. Conf. Computational Science and Its Applications (ICCSA), 2018, pp. 351–365
2018
-
[15]
Per- sonalized image aesthetics assessment with rich attributes,
Y . Yang, L. Xu, L. Li, N. Qie, Y . Li, P. Zhang, and Y . Guo, “Per- sonalized image aesthetics assessment with rich attributes,” inProc. IEEE/CVF Conf. Computer Vision and Pattern Recognition (CVPR), 2022, pp. 19861–19869. 11
2022
-
[16]
Lanistr: Multi- modal learning from structured and unstructured data,
S. Ebrahimi, S. O. Arik, Y . Dong, and T. Pfister, “Lanistr: Multi- modal learning from structured and unstructured data,”arXiv preprint arXiv:2305.16556, 2023
2023 arXiv
-
[17]
MetaFormer baselines for vision,
W. Yu, C. Si, P. Zhou, M. Luo, Y . Zhou, J. Feng, S. Yan, and X. Wang, “MetaFormer baselines for vision,”IEEE Transactions on Pattern Analysis and Machine Intelligence, vol. 46, no. 2, pp. 896–912, 2023
2023
-
[18]
Revisiting deep learning models for tabular data,
Y . Gorishniy, I. Rubachev, V . Khrulkov, and A. Babenko, “Revisiting deep learning models for tabular data,” inAdvances in Neural Information Processing Systems, vol. 34, 2021, pp. 18932–18943
2021
-
[19]
Rank consistent ordi- nal regression for neural networks with application to age estima- tion,
W. Cao, V . Mirjalili, and S. Raschka, “Rank consistent ordi- nal regression for neural networks with application to age estima- tion,”Pattern Recognition Letters, vol. 140, pp. 325–331, 2020, doi: 10.1016/j.patrec.2020.11.008
2020 doi
-
[20]
LAPIS: A novel dataset for personalized image aesthetic assessment,
A.-S. Maerten, L.-W. Chen, S. De Winter, C. Bossens, and J. Wagemans, “LAPIS: A novel dataset for personalized image aesthetic assessment,” in Proc. IEEE/CVF Conf. Computer Vision and Pattern Recognition (CVPR), 2025, pp. 6302–6311
2025
-
[21]
How rating scales influence responses’ reliability, extreme points, middle point and respondent’s preferences,
N. A. de Rezende and D. D. de Medeiros, “How rating scales influence responses’ reliability, extreme points, middle point and respondent’s preferences,”Journal of Business Research, vol. 138, pp. 266–274, 2022
2022
-
[22]
Measuring streetscape perceptions from driveways and side- walks to inform pedestrian-oriented street renewal in D ¨usseldorf,
J. Rui, “Measuring streetscape perceptions from driveways and side- walks to inform pedestrian-oriented street renewal in D ¨usseldorf,”Cities, vol. 141, p. 104472, 2023
2023
-
[23]
Bag of tricks for multimodal AutoML with image, text, and tabular data,
Z. Tang, Z. Zhong, T. He, and G. Friedland, “Bag of tricks for multimodal AutoML with image, text, and tabular data,”arXiv preprint arXiv:2412.16243, 2024
2024 arXiv
-
[24]
A neural approach to automated essay scor- ing,
K. Taghipour and H. T. Ng, “A neural approach to automated essay scor- ing,” inProc. Conf. Empirical Methods in Natural Language Processing (EMNLP), 2016, pp. 1882–1891
2016
-
[25]
Deep learning fundus image analysis for diabetic retinopathy and macular edema grading,
J. Sahlsten, J. Jaskari, J. Kivinen, L. Turunen, E. Jaanio, K. Hietala, and K. Kaski, “Deep learning fundus image analysis for diabetic retinopathy and macular edema grading,”Scientific Reports, vol. 9, no. 1, p. 10750, 2019
2019
-
[26]
Random forests,
L. Breiman, “Random forests,”Machine Learning, vol. 45, no. 1, pp. 5– 32, 2001
2001
-
[27]
Which cycling environment appears safer? Learning cycling safety perceptions from pairwise image comparisons,
M. Costa, M. Marques, C. L. Azevedo, F. W. Siebert, and F. Moura, “Which cycling environment appears safer? Learning cycling safety perceptions from pairwise image comparisons,”IEEE Transactions on Intelligent Transportation Systems, vol. 26, no. 2, pp. 1689–1700, 2025
2025
-
[28]
Personalized image aesthetics,
J. Ren, X. Shen, Z. Lin, R. Mech, and D. J. Foran, “Personalized image aesthetics,” inProc. IEEE Int. Conf. Computer Vision (ICCV), 2017, pp. 638–647
2017
-
[29]
Street view imagery in urban analytics and GIS: A review,
F. Biljecki and K. Ito, “Street view imagery in urban analytics and GIS: A review,”Landscape and Urban Planning, vol. 215, p. 104217, 2021
2021
-
[30]
Deep residual learning for image recognition,
K. He, X. Zhang, S. Ren, and J. Sun, “Deep residual learning for image recognition,” inProc. IEEE Conf. Computer Vision and Pattern Recognition (CVPR), 2016, pp. 770–778
2016
-
[31]
Swin Transformer: Hierarchical vision transformer using shifted windows,
Z. Liu, Y . Lin, Y . Cao, H. Hu, Y . Wei, Z. Zhang, S. Lin, and B. Guo, “Swin Transformer: Hierarchical vision transformer using shifted windows,” inProc. IEEE/CVF Int. Conf. Computer Vision (ICCV), 2021, pp. 10012–10022
2021
-
[32]
A ConvNet for the 2020s,
Z. Liu, H. Mao, C.-Y . Wu, C. Feichtenhofer, T. Darrell, and S. Xie, “A ConvNet for the 2020s,” inProc. IEEE/CVF Conf. Computer Vision and Pattern Recognition (CVPR), 2022, pp. 11976–11986
2022
-
[33]
Deep neural networks for rank- consistent ordinal regression based on conditional probabilities,
X. Shi, W. Cao, and S. Raschka, “Deep neural networks for rank- consistent ordinal regression based on conditional probabilities,”Pattern Analysis and Applications, vol. 26, no. 3, pp. 941–955, 2023
2023
-
[34]
Attention is all you need,
A. Vaswani, N. Shazeer, N. Parmar, J. Uszkoreit, L. Jones, A. N. Gomez, L. Kaiser, and I. Polosukhin, “Attention is all you need,” inProc. Advances in Neural Information Processing Systems (NeurIPS), 2017
2017
-
[35]
Crowd- sourced NeRF: Collecting data from production vehicles for 3D street view reconstruction,
T. Qin, C. Li, H. Ye, S. Wan, M. Li, H. Liu, and M. Yang, “Crowd- sourced NeRF: Collecting data from production vehicles for 3D street view reconstruction,”IEEE Transactions on Intelligent Transportation Systems, vol. 25, no. 11, pp. 16145–16156, 2024
2024
-
[36]
Please stop permuting features: An expla- nation and alternatives,
G. Hooker and L. Mentch, “Please stop permuting features: An expla- nation and alternatives,”arXiv preprint arXiv:1905.03151, 2019
1905 arXiv
-
[37]
Adaptive personalized travel information systems: A Bayesian method to learn users’ personal preferences in multimodal transport networks,
T. A. Arentze, “Adaptive personalized travel information systems: A Bayesian method to learn users’ personal preferences in multimodal transport networks,”IEEE Transactions on Intelligent Transportation Systems, vol. 14, no. 4, pp. 1957–1966, 2013
1957
-
[38]
Deep learning for intelligent transportation systems: A survey of emerging trends,
M. Veres and M. Moussa, “Deep learning for intelligent transportation systems: A survey of emerging trends,”IEEE Transactions on Intelligent Transportation Systems, vol. 21, no. 8, pp. 3152–3168, 2020
2020
-
[39]
AutoGluon-Multimodal (AutoMM): Supercharg- ing multimodal AutoML with foundation models,
Z. Tang, H. Fang, S. Zhou, T. Yang, Z. Zhong, T. Hu, K. Kirch- hoff, and G. Karypis, “AutoGluon-Multimodal (AutoMM): Supercharg- ing multimodal AutoML with foundation models,”arXiv preprint arXiv:2404.16233, 2024. Moloud Damandehreceived the B.Sc. and M.Sc. degrees in industri...
2024 arXiv
Reviewed August 10, 2026 · model on record in the stance chip above.
Discussion (0). Continue with ORCID to comment.