REVIEW 5 major objections 5 minor 21 references
A Picture is Worth a Thousand Tokens: How Vision Language Models Cut AI Energy Costs While Improving Accuracy
T0 review · 5 major / 5 minor · reviewed 2026-08-10 · deepseek-v4-flash
Pith's one-line read The paper argues that rendering time-series data as 2-D plots instead of text tokens makes vision-language models both cheaper and more accurate for anomaly detection.
desk verdict Useful energy measurements undercut by a confounded accuracy claim and a hundredfold arithmetic error; worth peer review but needs major revision. read the letter →
The pith
A machine-rendered reading of the paper's core claim, the machinery that carries it, and where it could break.
The reading
What carries the argument
The mechanism is the token-energy mismatch: LLM inference energy scales with input token count, while raw numerical KPI windows tokenize into tens of thousands of floating-point tokens. The paper replaces that representation with 2-D plot images—univariate line charts and vertically stacked subplots sharing a common time axis—so the vision encoder compresses the same signal into 5,442–16,800 visual tokens depending on the architecture. The stacked-subplot composition is motivated as a visual cross-section of the d-dimensional manifold traced by a d-variate time series, preserving inter-variable alignment while allowing attention to co-occurring waveform morphologies. Structured prompts that name spike, hump, and oscillatory-deviation primitives steer the model's attention toward waveform geometry. The argument is carried by precise token accounting per model tokenizer and hardware-counter energy readings per query.
What would settle it
Run the same LoRA fine-tuning recipe on the text-only Llama-3.2-90B and compare precision/F1 on the same telecom test dates; if it matches or beats the SFT VLM (0.465 precision, 0.464 F1), the accuracy-superiority claim fails. Separately, an end-to-end energy measurement that includes image rendering and CPU-GPU transfer could shrink or reverse the 1.8–2.5x reduction if rendering overhead is large.
Extended reading notes
Core claim
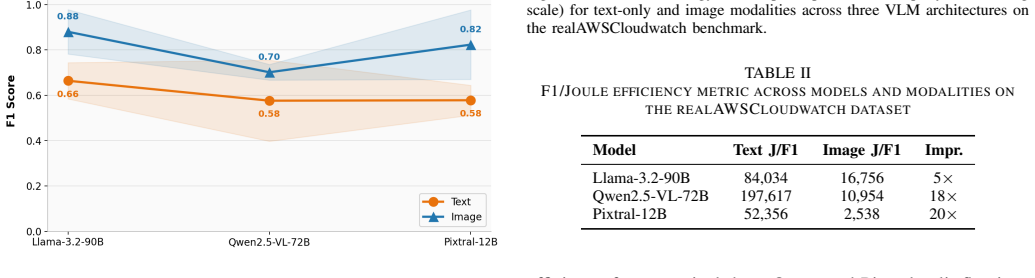
The paper's central claim is that for numerical time-series workloads, the visual modality dominates the text modality on both cost and accuracy. Across three vision-language architectures, encoding KPI windows as 2-D plots rather than serialized floating-point numbers reduces input tokens by 3.6–10.4x and measured inference energy by 1.8–2.5x per query, with energy savings measured by hardware counters on A6000/A100 GPUs. On the public realAWSCloudwatch benchmark, image inputs raise mean F1 from 0.58–0.66 (text) to 0.70–0.88 (image); on live 4G/5G telecom data, a fine-tuned Llama-3.2-90B-Vision reaches precision 0.465 versus 0.145 for text and F1 0.464 versus 0.185, while beating ARIMA and LSTM by over 144%. The paper further claims Pixtral-12B achieves a 20.6x improvement in energy-normalized efficiency (J/F1: 2,538 image vs 52,356 text), and that at 24 KPIs text inputs exceed typical 128K context windows while visual inputs remain within limits. Together these results are offered as empirical grounding for treating energy as a first-class constraint in AI inference systems.
Load-bearing premise
The load-bearing premise is that the accuracy gain is caused by the visual modality itself, because the main comparison pits a fine-tuned vision model against a zero-shot text model and un-fine-tuned ARIMA and LSTM baselines.
Editorial extensions
If this is right
- At 24 KPIs, text representations exceed the 128K context window of production LLMs, making visual input the only feasible modality without lossy truncation.
- Deploying the visual modality at 209 cells monitored every 15 minutes saves about 7.2 MJ/day per model, roughly the daily residential energy of 2.4 US households.
- Reducing rendering resolution from 150 to 75 DPI cuts vision tokens by 70% and inference energy by 24% with no measured F1 drop, adding a free tuning lever for edge hardware.
- Architecture choice tunes the trade: Llama's fixed 6,404-token budget gives predictable energy, Qwen's dynamic tiling gives maximum compression (10.4x), and Pixtral's patch tokenization gives the best energy-normalized accuracy (J/F1 2,538 vs 52,356).
Reading between the lines
- Because the token-compression ratio grows with window length and KPI count, the energy advantage should widen for longer histories; a scaling experiment across window sizes would test this directly.
- The accuracy comparison's confound suggests a same-recipe fine-tuned text LLM is the decisive follow-up; until that runs, the 'accuracy-superior' claim is only as strong as the modality-versus-tuning assumption.
- The same visual encoding could transfer to other high-dimensional monitoring domains such as financial tick data, industrial sensors, or power-grid telemetry, but the paper only measures telecom and cloudwatch data.
- Because the paper measures GPU inference only, full-system accounting including image rasterization, memory transfer, and CPU preprocessing could change the net savings; the reported 1.8–2.5x should be read as a GPU-bound upper bound.
Editorial analysis
A structured set of objections, weighed in public.
Referee Report
Summary. The paper argues that encoding numerical time-series as 2D plots and feeding them to vision-language models (VLMs) reduces input token counts by 3.6–10.4x and measured inference energy by 1.8–2.5x relative to text-only LLM inputs, while also improving anomaly-detection accuracy. Experiments cover Llama-3.2-90B-Vision, Qwen2.5-VL-72B, and Pixtral-12B on both a public AWS CloudWatch benchmark and a live telecom KPI dataset, with GPU energy measured via NVML counters. The paper also studies image-resolution compression as an additional energy lever and claims operational savings of about 7.2 MJ/day at a 209-cell monitoring scale.
Significance. If the central claims held, the paper would provide useful empirical evidence that modality choice, not just model size or quantization, is a practical lever for inference-energy reduction in time-series workloads. Strengths include direct per-query energy measurement with hardware energy counters, evaluation across three architecturally distinct VLMs, and the inclusion of both a public benchmark and a real operational telecom dataset. The energy-reduction direction is plausible and consistent with the reported token reductions. However, the paper's headline accuracy claim is weakened by a fine-tuning confound, the reported token and energy numbers contain internal inconsistencies, and the operational-savings arithmetic appears incorrect; these issues need resolution before the quantitative conclusions can be accepted.
major comments (5)
- [§IV.C, Table IV] The central accuracy claim confounds modality with fine-tuning. Table IV compares a LoRA fine-tuned Llama-3.2-90B-Vision model (precision 0.465, F1 0.464) against a zero-shot text-only LLM (precision 0.145, F1 0.185), and the abstract's 220.7% precision improvement is cited as evidence that VLMs are 'accuracy-superior.' Because fine-tuning and modality are varied simultaneously, this improvement cannot be attributed to the visual representation. The zero-shot VLM result (F1 0.360) partially mitigates the concern, but the paper must either add a text-only Llama fine-tuned with the same LoRA recipe and data, or explicitly restrict the accuracy-superiority claim to the zero-shot comparison.
- [§IV.B, Tables III, IV, V, VI] There are unresolved inconsistencies in the token and energy accounting. Table III reports 46,101 text tokens for the Llama 8-KPI, 381-time-point telecom input, while Table IV lists 42,565 tokens for the same experimental setting. More seriously, Table VI reports Qwen2.5-VL-72B using 17,303 vision tokens at 150 DPI, whereas Table III reports 5,442 vision tokens for the same model and the same 8-KPI input; the corresponding image-mode energies are 8,818 J in Table VI versus 2,397 J in Table V. These discrepancies affect both the token-reduction ratios and the energy-savings claims, and they must be reconciled or clearly explained as different configurations.
- [§VI.C, Abstract] The claimed operational saving of ~7.2 MJ/day does not match the reported per-query measurements. Using Table V's Llama numbers, the per-query saving is 59,751 J - 23,557 J = 36,194 J. With 209 cells and 96 intervals per day, the paper itself states there are ~20,064 queries/day, giving 36,194 × 20,064 ≈ 726 MJ/day, not 7.2 MJ/day. If a different query count or per-cell basis is intended, it should be stated explicitly; as written, the headline saving is off by two orders of magnitude.
- [§IV.A, §V.A (Figures 3–4, Table II)] The public-benchmark evaluation does not specify how the 17 candidate signals were reduced to 10 retained signals per model, and the text later refers to 'five signals' in Figure 3 and Table II. The retention rule appears nowhere in the methodology, making it impossible to assess selection bias or to reproduce the mean F1 and J/F1 numbers. The authors should state the exact selection criterion, list the retained signals, and report per-signal results for both modalities.
- [§IV.B, Table V and §V.C] The text-only comparison is further confounded by truncation: Table V states that text inputs were truncated to each model's maximum context length (40K for Llama, 32K for Qwen/Pixtral), while Table III shows the full text representation requires 46,101–59,803 tokens. Thus the accuracy comparison in Table IV and the energy comparison in Table V evaluate a truncated text input, not the full time series. A text-only model given the full series through chunking or a longer-context model should be evaluated, or the paper should clearly state that its conclusion applies only to the truncated-text regime.
minor comments (5)
- [Table V header] The table header 'NVIDIA A100/A6000' does not indicate which hardware was used for each model; the text gives deployment configurations in §IV, but the table itself should list the GPU per row.
- [§III.B] Energy values are reported as point estimates over three runs; the paper should report the spread (e.g., standard deviation or min–max) because the 1.8–2.5x savings ratios are central to the conclusions.
- [§V.A, Table II] The J/F1 metric excludes F1 = 0 cases, but the exclusion rule is only stated parenthetically; please specify how many signals were excluded and whether this affects the reported 20.6x improvement.
- [§VI.A] The statement 'mean F1 image 0.72 vs. text 0.49 on public data' is not directly traceable to Figures 3 or Table II; please clarify whether this is an average over all models or a specific configuration.
- [§V.F, Table VI] The compression experiment uses only Qwen2.5-VL-72B and zero-shot mode; the conclusion about resolution reduction should be framed as architecture-specific rather than general.
Circularity Check
No derivation reduces to its own inputs; minor self-citations support but do not determine the measured result.
full rationale
The paper's central claims are empirical measurements against external benchmarks and operational data, not derivations from fitted parameters or self-referential definitions. Token counts are measured with each model's native processor; inference energy is measured via NVML hardware counters; accuracy is evaluated on the public realAWSCloudwatch benchmark and on telecom data with ground-truth labels from an external causal detection system. No equation in the paper defines a predicted quantity in terms of the data used to fit it, and no fitted parameter is renamed as a prediction. The two self-citations, [15] for the edge memory ceiling and [20] for ground-truth labels, are supporting inputs: the memory ceiling is an independent hardware profile, and the labels are a data source, not a confirmation of the paper's measured energy or accuracy results. The accuracy comparison in Table IV does compare a fine-tuned VLM against a zero-shot text LLM, which is a methodological confound and a correctness risk, but it is not circularity because the comparison is not forced by definition or by a fitted parameter; it is an experimental design choice. The observed token-count inconsistencies between tables are internal-consistency concerns, not evidence that a result reduces to its inputs. The limitations section discloses the main scope restrictions, and none of these limitations indicate that the central result is circular. Overall, the derivation chain is self-contained and externally grounded, with only minor non-load-bearing self-citations.
Assumptions & free parameters
assumptions (4)
- domain assumption Inference energy scales linearly with input token count
- domain assumption VLMs have higher per-token power draw than text-only LLMs
- domain assumption Ground-truth telecom anomaly labels from the Causal Anomaly Detection system are correct
- domain assumption The 60,000-token edge GPU memory ceiling from ref [15] applies to these deployment scenarios
Cite this review
Pith. "Pith review of A Picture is Worth a Thousand Tokens: How Vision Language Models Cut AI Energy Costs While Improving Accuracy." pith.science (2026). https://pith.science/paper/H4NDJZ4N
@misc{pith2026260807427,
  author       = {Pith},
  title        = {Pith review of: A Picture is Worth a Thousand Tokens: How Vision Language Models Cut AI Energy Costs While Improving Accuracy},
  year         = {2026},
  howpublished = {\url{https://pith.science/paper/H4NDJZ4N}},
  note         = {Machine review of arXiv:2608.07427}
}
read the original abstract
LLM inference accounts for over 90% of AI operational energy, scaling directly with input token count---a critical inefficiency for telecom network analytics and numerical time-series data analysis (NTSDA), where raw multivariate KPI windows from 4G/5G cell sites expand into thousands of floating-point tokens. Vision-Language Models (VLMs) eliminate this mismatch by encoding time-series as 2D plots, achieving 3.6-10.4x input token reduction across Llama-3.2-90B, Qwen2.5-VL-72B, and Pixtral-12B architectures. This translates to 1.8-2.5x measured inference energy reduction, saving approximately 7.2 MJ/day at telecom edge deployments and CloudRAN that monitor 200 cells per 15-minute interval. Critically, efficiency gains do not sacrifice accuracy: a fine-tuned Llama-3.2-90B-Vision VLM achieves 220.7% higher precision than its text-only counterpart and outperforms LSTM and ARIMA baselines by over 144% on telecom anomaly detection. On public benchmarks, Pixtral-12B achieves a 20.6x improvement in J/F1 score at mean F1 = 0.82. At 24 KPIs, text representations exceed the 128K context window of most production LLMs, rendering text-only processing infeasible without truncation, while visual representations remain within standard limits. These results establish VLMs as an energy-efficient and accuracy-superior modality for numerical time-series workloads, providing empirical grounding for AI inference systems that treat energy consumption as a first-class engineering constraint.
Figures


Figures from the paper (2 more)

Reference graph
Works this paper leans on
-
[9]
Harnessing vision-language models for time series anomaly detection,
Z. He, A. Alnegheimish, and M. Reimherr, “Harnessing vision-language models for time series anomaly detection,”arXiv:2506.06836, 2025
arXiv 2025
-
[1]
Can US infrastructure keep up with AI economy?
M. Stansbury, K. Marchese, K. Hardin, and C. Amon, “Can US infrastructure keep up with AI economy?” Deloitte, June 2025. [Online]. Available: https://www.deloitte.com/us/en/insights/industry/ power-and-utilities/data-center-infrastructure-artificial-intelligence.html
work page 2025
-
[2]
N. T. Lee and D. M. West, “The future of datacenters,” Brookings Institution, Nov. 2025. [Online]. Available: https://www.brookings.edu/ articles/the-future-of-data-centers/
work page 2025
-
[3]
How hungry is AI? Benchmarking energy, water and carbon footprint of LLM inference,
N. Jegham, M. Abdelatti, C. Y . Koh, L. Elmoubarki, and A. Hendawi, “How hungry is AI? Benchmarking energy, water and carbon footprint of LLM inference,”arXiv:2505.09598, 2025
arXiv 2025
-
[4]
D. Crovato and J. Rosania, “Artificial intelligence and energy overcon- sumption: Data center electricity demand, cooling burdens, and regional sustainability constraints,”Energy and Power Engineering, vol. 18, no. 4, pp. 168–202, 2026
work page 2026
-
[5]
P. Gholap, “Comparative analysis on developed optimization techniques for reducing energy consumption in AI training and inference,”J. Information Systems Engineering and Management, vol. 10, no. 14s, pp. 111–116, 2025
work page 2025
-
[6]
From prompts to power: Measuring the energy footprints of LLM inference,
F. Caravaca, A. Cuevas, and R. Cuevas, “From prompts to power: Measuring the energy footprints of LLM inference,”arXiv:2511.05597, 2025
arXiv 2025
-
[7]
Tokenization counts: The impact of tokenization on arithmetic in frontier LLMs,
A. K. Singh and D. J. Strause, “Tokenization counts: The impact of tokenization on arithmetic in frontier LLMs,”arXiv:2402.14903, 2024
arXiv 2024
Show all 21 references
-
[8]
How different tokenization algo- rithm impact LLMs and transformer models for binary code analysis,
A. Mostafa, R. Arefin, and S. Mulder, “How different tokenization algo- rithm impact LLMs and transformer models for binary code analysis,” arXiv:2511.03825, 2025
2025
-
[10]
TokenPowerBench: Benchmarking the power consumption of LLM inference,
C. Niu, W. Zhang, J. Li, Y . Zhao, T. Wang, X. Wang, and Y . Chen, “TokenPowerBench: Benchmarking the power consumption of LLM inference,”arXiv:2512.03024, 2025
2025
-
[11]
The ML.ENERGY benchmark: Toward automated inference energy measurement and optimization,
J.-W. Chung, J. J. Ma, R. Wu, J. Liu, O. J. Kweon, Y . Xia, Z. Wu, and M. Chowdhury, “The ML.ENERGY benchmark: Toward automated inference energy measurement and optimization,”arXiv:2505.06371, 2025
2025
-
[12]
An energy-efficient vision language model inference with importance-aware token pruning,
Z. Kalzhan, S. Hong, and H.-J. Yoo, “An energy-efficient vision language model inference with importance-aware token pruning,” inProc. IEEE Asia Pacific Conf. Circuits and Systems, Oct. 2025
2025
-
[13]
Energy-driven adaptive visual token pruning for efficient vision-language models,
J. He and H. Chen, “Energy-driven adaptive visual token pruning for efficient vision-language models,”arXiv:2603.05950, 2026
2026 arXiv
-
[14]
A picture is worth a thousand words: Enabling LLMs reason about time series via visualization,
H. Liu, C. Liu, and B. A. Prakash, “A picture is worth a thousand words: Enabling LLMs reason about time series via visualization,” arXiv:2411.06018, 2024
2024 arXiv
-
[15]
Edge-deployable LLM fine-tuning on a single GPU for telecom net- work troubleshooting,
C. Shi, B. Jalli, J. Zou, G. Macdonald, W. Lei, M. Jain, and J. Philip, “Edge-deployable LLM fine-tuning on a single GPU for telecom net- work troubleshooting,”arXiv:2607.02523, 2026
2026 arXiv
-
[16]
Zeus: Understanding and optimizing GPU energy consumption of DNN training,
J. You, J. Chung, and M. Chowdhury, “Zeus: Understanding and optimizing GPU energy consumption of DNN training,” inProc. 20th USENIX Symp. Networked Systems Design and Implementation (NSDI), Boston, MA, 2023, pp. 119–139
2023
-
[17]
The Llama 3 herd of models,
A. Dubeyet al., “The Llama 3 herd of models,”arXiv:2407.21783, 2024
2024 arXiv
-
[18]
Qwen2.5-VL: Enhancing vision-language model’s perception of the world at any resolution,
P. Wanget al., “Qwen2.5-VL: Enhancing vision-language model’s perception of the world at any resolution,”arXiv:2409.12191, 2024
2024 arXiv
-
[19]
Pixtral 12B,
A. Agrawal, B. Barsotti, R. Nair, B. Nguyen, G. Pellat, A. Piktus, A. Sablayrolles, B. Rozi `ere, J. Music, H. Roux, and Mistral AI Team, “Pixtral 12B,” Mistral AI, Tech. Rep., 2024.arXiv:2410.07073
2024 arXiv
-
[20]
Causal inter- vention sequence analysis for fault tracking in radio access networks,
C. Shi, J. Philip, S. Bandyopadhyay, and J. Choudhury, “Causal inter- vention sequence analysis for fault tracking in radio access networks,” inProc. IEEE Int. Conf. Future Machine Learning and Data Science, Nov. 2025
2025
-
[21]
Cost efficient GPU cluster management for training and inference of deep learning,
D.-K. Kang, K.-B. Lee, and Y .-C. Kim, “Cost efficient GPU cluster management for training and inference of deep learning,”Energies, vol. 15, no. 2, art. 474, 2022
2022
Reviewed August 10, 2026 · model on record in the stance chip above.
Discussion (0). Continue with ORCID to comment.