REVIEW 3 major objections 6 minor 13 references
Conformal Prediction for Electricity Price Forecasting in the Day-Ahead and Real-Time Balancing Market
T0 review · 3 major / 6 minor · reviewed 2026-08-08 · deepseek-v4-flash
Pith's one-line read An equal-weight ensemble of quantile regression and two conformal prediction methods, Q-Ens, delivers narrow prediction intervals with high coverage and achieves the highest average simulated trading profit in both the day-ahead and…
desk verdict Useful applied benchmark for conformal electricity price forecasting, but the Q-Ens ensemble's coverage claim is not backed by a validity guarantee and is partly contradicted by the paper's own balancing-market results. read the letter →
The pith
A machine-rendered reading of the paper's core claim, the machinery that carries it, and where it could break.
The reading
What carries the argument
The carrying object is the Q-Ens interval from Eq. (17): each prediction interval is the arithmetic mean of the three components' quantile bounds, $\Gamma = [ (\mathrm{QR}_\alpha + \mathrm{EnbPI}_\alpha + \mathrm{SPCI}_\alpha)/3,\ (\mathrm{QR}_{1-\alpha} + \mathrm{EnbPI}_{1-\alpha} + \mathrm{SPCI}_{1-\alpha})/3 ]$. The idea is that quantile regression supplies efficient narrow intervals, EnbPI reduces epistemic uncertainty through bootstrap ensembling, and SPCI re-estimates residual quantiles online to maintain coverage under non-stationarity; averaging the bounds is intended to inherit the strengths of each component.
What would settle it
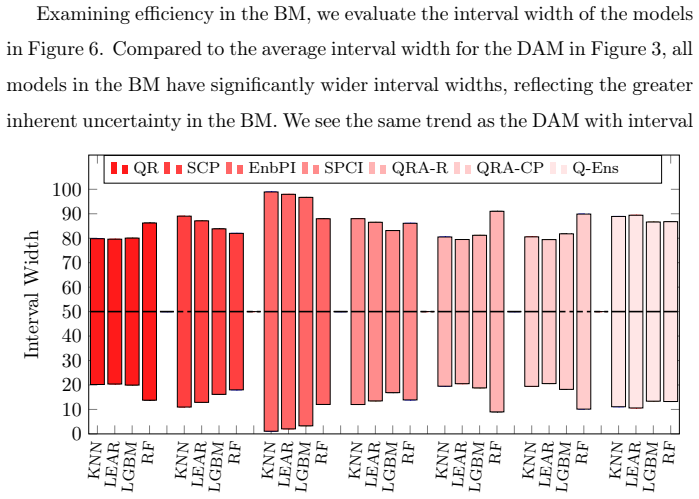
A reader could re-run the experiment on a hold-out year of Irish market data, or on another market, and compare Q-Ens empirical coverage to the nominal 80% level with a tolerance. If Q-Ens coverage falls several percentage points below nominal in a setting where each component individually stays near nominal, the central sharpness-coverage claim is refuted; the paper's own Figure 7 already shows Q-Ens below all conformal baselines in the balancing market.
Extended reading notes
Core claim
The central discovery is that the Q-Ens ensemble, defined as the equal-weight average of the lower and upper bounds of the prediction intervals produced by quantile regression, EnbPI, and SPCI, attains a better balance between sharpness and coverage than any of its components. In the day-ahead market, Q-Ens has the lowest average Winkler score and the two lowest aggregate pinball scores; in the balancing market, it has the lowest average pinball score and the second-lowest average Winkler score. In the simulated trading evaluation, Q-Ens achieves the highest average profit in both the day-ahead and balancing markets across the RF and LGBM base models.
Load-bearing premise
The load-bearing premise is that averaging the lower and upper bounds of three valid prediction intervals produces an interval that is still valid, meaning it keeps nominal coverage; the paper provides no proof or calibration for this, and its own balancing-market results show Q-Ens coverage below every conformal baseline.
Editorial extensions
If this is right
- EnbPI and SPCI improve coverage over plain quantile regression in both the day-ahead and balancing markets, and can be applied to any base regressor.
- Q-Ens achieves lower average Winkler scores than most components in both markets, indicating a better sharpness-coverage trade-off.
- In simulated trading with a battery storage system, Q-Ens yields the highest average profit in both the day-ahead and balancing markets among the methods evaluated.
- The improvement arises without any calibration of ensemble weights; equal weights suffice.
- Time-series-adapted conformal methods can serve as a practical layer on top of existing point forecasting models, improving reliability without redesigning the base model.
Reading between the lines
- If equal-weight averaging of intervals preserves coverage only when the component intervals are aligned, then calibrating the ensemble weights on a validation window or applying conformalized quantile averaging would likely close the balancing-market coverage gap where Q-Ens underperforms every conformal baseline.
- The simulated trading results omit transaction costs and liquidity constraints; testing the ensemble under a more realistic market microstructure could shrink or reverse the reported profit advantage.
- Because Q-Ens is model-agnostic and parameter-free, the same averaging trick may transfer to intraday markets or to renewable generation forecasting, where the component methods' coverage properties would need to be rechecked on those series.
- The paper's equal-weight ensemble could be extended to include more than three components; the marginal benefit of additional interval sources is an open empirical question that the paper does not address.
Editorial analysis
A structured set of objections, weighed in public.
Referee Report
Summary. The paper evaluates probabilistic electricity price forecasting in the Irish day-ahead and balancing markets, comparing quantile regression, quantile regression averaging, split conformal prediction, EnbPI, and SPCI. It proposes Q-Ens, an equal-weight ensemble that averages the lower and upper interval endpoints of QR, EnbPI, and SPCI, and claims that this ensemble delivers both narrow prediction intervals and high coverage. The methods are assessed through prediction-interval metrics (pinball score, interval width, coverage, Winkler score) and through a simulated battery-trading exercise with two trading strategies in both markets. The empirical results show Q-Ens achieving competitive or best average pinball and Winkler scores and the highest average simulated trading revenue, but also show Q-Ens coverage below the conformal baselines in the balancing market. The paper includes source code and data availability statements.
Significance. If the central claim were fully supported, the paper would make a useful applied contribution: it applies EnbPI and SPCI to electricity price forecasting in the balancing market, proposes a simple ensemble that appears to improve interval sharpness, and connects probabilistic validity to simulated trading outcomes. The authors provide code and data for reproducibility, and the financial evaluation is a constructive step toward evaluating probabilistic forecasts by economic value. However, the claimed 'high coverage' property of Q-Ens is not guaranteed by construction and is empirically violated in the balancing market, and the financial advantage over the next-best method is small and reported without uncertainty quantification. These gaps undermine the paper's headline conclusions as currently stated. The weaknesses are local rather than fatal; the paper could be revised by either calibrating Q-Ens, adding significance/uncertainty analysis, or substantially reframing the claims.
major comments (3)
- [Eq. (17), §5.2.2] The interval in Eq. (17) is formed by averaging the lower and upper bounds of three prediction intervals, but the finite-sample coverage guarantees of EnbPI and SPCI apply to those methods' own intervals, not to a pointwise average of three intervals. Without a calibration or conformal adjustment step, the averaged interval has no validity guarantee. This is not merely a theoretical concern: §5.2.2 and Figure 7 show Q-Ens coverage below every conformal baseline in the balancing market at the 0.1–0.9 level, and §5.1.2 concedes only 'slightly inferior' DAM coverage. Since the abstract and Section 5.4 claim 'high coverage' as a central benefit of Q-Ens, this empirical violation is load-bearing for the paper's main claim.
- [Table 6, §5.3] The financial comparison in Table 6 is presented without any uncertainty quantification: there are no error bars, confidence intervals, or statistical significance tests, and the reported margins are small (Q-Ens versus SPCI: EUR 299 average in the DAM and EUR 530 average in the BM). The claim that Q-Ens 'achieves the highest average result in both the DAM and BM' may reflect noise rather than a systematic advantage. Additionally, the table excludes KNN and LEAR 'to focus on top performers', so the comparison covers only four methods; the full-model claim in the abstract and Section 5.3 is therefore not supported by the presented table.
- [§5.4, §6] The limitations section does not flag the most serious issue identified in the results: the Q-Ens coverage shortfall in the balancing market. The conclusion states that Q-Ens 'demonstrated strong results in both efficiency and validity', but Figure 7 shows that its validity is systematically lower than each CP baseline at the nominal 0.8 level. A revised manuscript should either add a post-hoc calibration step and re-evaluate, or explicitly state that Q-Ens trades a coverage deficit for improved sharpness and financial performance, which would materially change the paper's claims.
minor comments (6)
- [Table 1 caption] The caption reads 'The ✓is the approach presented herein'; this is grammatically incomplete and should be rephrased to explain the checkmark notation.
- [§5.1.2] The text says 'we see a similar trend to Figure 4' when referring to the 0.3–0.7 quantile pair; the referenced figure should likely be Figure 5, not Figure 4.
- [Table 6] The column header 'A vg.' contains a stray space; it should read 'Avg.'.
- [§5.2] The price units are rendered as 'e54.772/MWh' and 'e53.77/MWh'; these should use the euro symbol consistently.
- [Throughout] There are several missing spaces and typographical errors, for example 'foritsability' in the Introduction and 'fromO'Connor' in the references section; a careful proofreading pass is needed.
- [§5.3] The trading strategies TS1 and TS2 are adopted from O'Connor et al. (2024b), but the battery parameters (efficiency, capacity, constraints) are not defined in this manuscript beyond a brief summary; since the financial claim depends on these parameters, they should be stated or explicitly referenced with the relevant equations.
Circularity Check
No circularity in the central Q-Ens derivation; one baseline (QRA-R) is explicitly trained on 'future datasets', so its reported 'forecasts' are partly constructed from the outcomes they claim to predict.
-
fitted input called prediction
[Section 3.2.5, QRA-R definition]
"QRA-R: Includes forecasts from models trained on different data contexts (full datasets, historical, and future datasets) to capture diverse trends and improve reliability."
A forecast for settlement period t may only use information available before t. This bullet explicitly includes 'future datasets' among the training contexts for the models whose outputs feed QRA-R. The evaluation period (DAM/BM, 2019-2022) is therefore inside the training window for at least one constituent model, so the QRA-R values reported in Tables 2/4/6 and Figures 3-8 are not out-of-sample predictions; they are in-sample fits to the very outcomes being 'forecast'. The APS, coverage, Winkler, and trading results for QRA-R are thus forced by construction and cannot be read as predictive evidence. This does not affect the Q-Ens ensemble itself, whose Eq. (17) components are trained on historical data, but it weakens the baseline comparison in which Q-Ens is declared best.
full rationale
The central Q-Ens claim is not circular: Eq. (17) is a fixed equal-weight average of three interval methods, no parameter is fitted to the test set, and the 'high coverage' claim is presented as an empirical result rather than derived from a guarantee. The paper does not invoke a uniqueness theorem or import its ensemble definition from a self-citation. The self-citations to O'Connor et al. (2024a,b) supply the dataset and trading strategies, which are external benchmarks and code, not the claimed conclusion; using them is normal and does not make the derivation circular. The main validity concern with Q-Ens, namely that averaging intervals does not preserve coverage and the BM results in Section 5.2.2 show undercoverage, is a statistical correctness gap rather than a circularity. The one genuine circular step found is the QRA-R baseline, which is explicitly trained on 'future datasets' and therefore reports fitted values as if they were predictions; this is a leakage that compromises one comparison but not the derivation of Q-Ens itself.
Assumptions & free parameters
free parameters (3)
- Q-Ens equal weights =
1/3, 1/3, 1/3
- Battery and trading parameters =
1 MWh capacity; 80% discharge; 98% charge; TS1/TS2 constraints
- Base model hyperparameters =
not reported
assumptions (4)
- standard math EnbPI and SPCI provide valid prediction intervals under their stated conditions
- domain assumption The O'Connor et al. (2024a) Irish market dataset is accurate and representative
- domain assumption Future information used for balancing-market forecasts is available at the time of prediction
- ad hoc to paper Equal-weight averaging of interval endpoints preserves approximate validity
Cite this review
Pith. "Pith review of Conformal Prediction for Electricity Price Forecasting in the Day-Ahead and Real-Time Balancing Market." pith.science (2026). https://pith.science/paper/2GW4O3UF
@misc{pith2026250204935,
  author       = {Pith},
  title        = {Pith review of: Conformal Prediction for Electricity Price Forecasting in the Day-Ahead and Real-Time Balancing Market},
  year         = {2026},
  howpublished = {\url{https://pith.science/paper/2GW4O3UF}},
  note         = {Machine review of arXiv:2502.04935}
}
read the original abstract
The integration of renewable energy into electricity markets poses significant challenges to price stability and increases the complexity of market operations. Accurate and reliable electricity price forecasting is crucial for effective market participation, where price dynamics can be significantly more challenging to predict. Probabilistic forecasting, through prediction intervals, efficiently quantifies the inherent uncertainties in electricity prices, supporting better decision-making for market participants. This study explores the enhancement of probabilistic price prediction using Conformal Prediction (CP) techniques, specifically Ensemble Batch Prediction Intervals and Sequential Predictive Conformal Inference. These methods provide precise and reliable prediction intervals, outperforming traditional models in validity metrics. We propose an ensemble approach that combines the efficiency of quantile regression models with the robust coverage properties of time series adapted CP techniques. This ensemble delivers both narrow prediction intervals and high coverage, leading to more reliable and accurate forecasts. We further evaluate the practical implications of CP techniques through a simulated trading algorithm applied to a battery storage system. The ensemble approach demonstrates improved financial returns in energy trading in both the Day-Ahead and Balancing Markets, highlighting its practical benefits for market participants.
Figures


Figures from the paper (5 more)




Reference graph
Works this paper leans on
-
[1]
Angelopoulos, A., Candes, E., & Tibshirani, R. J. (2024). Conformal pid control for time series prediction.Advances in neural information processing systems,
work page 2024
-
[8]
37 Mazzi, N., & Pinson, P. (2017). 10 - wind power in electricity markets and the value of forecasting. In G. Kariniotakis (Ed.),Renewable Energy Forecasting. Woodhead Publishing. Miraki, A., Parviainen, P., & Arghandeh, R. (2025). Probabilistic forecast- ing of renewable energy and electricity demand using graph-based denoising diffusion probabilistic mo...
work page 2017
-
[15]
Narajewski, M., & Ziel, F. (2020). Econometric modelling and forecasting of intraday electricity prices.Journal of Commodity Markets, 19, 100107. Newbery, D., Strbac, G., & Viehoff, I. (2016). The benefits of integrating euro- pean electricity markets.Energy Policy, 94, 253–263. Nowotarski, J., & Weron, R. (2015). Computing electricity spot price predicti...
work page 2020
-
[29]
Xu, C., Jiang, H., &Xie, Y.(2024a)
Springer. Xu, C., Jiang, H., &Xie, Y.(2024a). Conformalpredictionformulti-dimensional time series by ellipsoidal sets.arXiv preprint arXiv:2403.03850, . Xu, C., & Xie, Y. (2021). Conformal prediction interval for dynamic time-series. InInternational Conference on Machine Learning(pp. 11559–11569). PMLR. Xu, C., & Xie, Y. (2023). Sequential predictive conf...
arXiv 2024
-
[36]
Bhatnagar, M., Rozinaj, G., & Vargic, R. (2025). Using crafted features and polar bear optimization algorithm for short-term electric load forecast system. Energy and AI, (p. 100470). Birkeland, D., & AlSkaif, T. (2024). Research areas and methods of interest in european intraday electricity market research—a systematic literature review. Sustainable Ener...
work page 2025
-
[54]
38 O’Connor, C., Collins, J., Prestwich, S., & Visentin, A. (2024b). Optimizing quantile-based trading strategies in electricity arbitrage.arXiv:2406.13851. Ortner, A., & Totschnig, G. (2019). The future relevance of electricity balancing markets in europe.Energy Strategy Reviews, 24, 111–120. Piantadosi, G., Dutto, S., Galli, A., De Vito, S., Sansone, C....
work page Pith review arXiv 2024
-
[95]
Vahidinasab, V., & Jadid, S. (2010). Bayesian neural network model to predict day-ahead electricity prices.European Transactions on Electrical Power, 20, 231–246. Vovk, V., Gammerman, A., & Shafer, G. (2005). Algorithmic learning in a random worldvolume
work page 2010
-
[102]
Hu, J., Luo, Q., Tang, J., Heng, J., & Deng, Y. (2022). Conformalized temporal convolutionalquantileregressionnetworksforwindpowerintervalforecasting. Energy, 248, 123497. Ilea, V., Bovo, C. et al. (2018). European day-ahead electricity market coupling: Discussion, modeling, and case study.Electric Power Systems Research, 155, 80–92. Janczura, J. (2024). ...
work page Pith review arXiv 2022
Show all 13 references
-
[129]
S., & Nott, D
Klein, N., Smith, M. S., & Nott, D. J. (2023). Deep distributional time series models and the probabilistic forecasting of intraday electricity prices.Journal of Applied Econometrics, 38, 493–511. Koch, C., & Hirth, L. (2019). Short-term electricity trading for system bal- anc...
2023 arXiv
-
[1255]
Uniejewski, B. (2023). Smoothing quantile regression averaging: A new ap- proach to probabilistic forecasting of electricity prices. arXiv:2302.00411, . 39 Uniejewski, B., Marcjasz, G., & Weron, R. (2019a). On the importance of the long-term seasonal component in day-ahead ele...
2023 arXiv
-
[2241]
Cheng, H., Ding, X., Zhou, W., & Ding, R. (2019). A hybrid electricity price forecasting model with bayesian optimization for german energy exchange. International Journal of Electrical Power & Energy Systems, 110, 653–666. Cordier, T., Blot, V., Lacombe, L., Morzadec, T., Cap...
2019
-
[5152]
Liu, H., & Zhang, Z. (2025). Probabilistic forecasting of multiple plant day- ahead renewable power generation sequences with data privacy preserving. Energy and AI, 19, 100463. Lucas, A., Pegios, K., Kotsakis, E., & Clarke, D. (2020). Price forecasting for the balancing energ...
2025
-
[5420]
Maciejowska, K., & Nitka, W. (2024). Multiple split approach– multidimensional probabilistic forecasting of electricity markets. arXiv preprint arXiv:2407.07795, . Maciejowska, K., Nowotarski, J., & Weron, R. (2016). Probabilistic forecasting of electricity spot prices using f...
2024 arXiv
Reviewed August 8, 2026 · model on record in the stance chip above.
Discussion (0). Continue with ORCID to comment.