A Machine Learning-Based Framework for Discovering Huntington's Disease Stages: Integrating Graph Representation Learning and clustering to Uncover Progression Dynamics in Longitudinal Enroll-HD Dataset
Pith reviewed 2026-06-28 02:54 UTC · model grok-4.3
The pith
A graph representation learning framework identifies four distinct Huntington's disease stages from longitudinal clinical data.
A machine-rendered reading of the paper's core claim, the machinery that carries it, and where it could break.
Core claim
Using dynamic graph representation learning on 44 clinical variables from 302 Enroll-HD participants across 1,477 visits, the framework learns a four-dimensional latent space. K-means++ clustering combined with stability analysis then identifies four statistically distinct stages that correspond to well-defined clinical boundaries and show minimal overlap with existing clinical staging.
What carries the argument
Dynamic graph representation learning that encodes temporal relationships across longitudinal visits, followed by iterative K-means++ clustering and stability analysis to select the number of robust stages.
If this is right
- Four disease stages emerge with well-defined clinical measurement boundaries.
- The stages remain statistically distinct under clustering stability checks.
- Overlap with previously established clinical staging methods is minimal.
- The framework works despite the modest cohort size of 302 individuals.
- Stages reflect natural clinical progression captured from the data.
Where Pith is reading between the lines
- The same graph-plus-clustering pipeline could be tested on longitudinal datasets from other progressive neurological conditions.
- If the four stages prove reproducible, they could serve as stratification factors in future treatment trials.
- Incorporating additional data types such as genetic markers might further separate the identified stages.
- External validation on new cohorts would be the direct next step to check whether the four-stage structure holds.
Load-bearing premise
The 44 clinical variables collected in the Enroll-HD cohort and the graph construction from longitudinal visits are sufficient to capture true underlying progression dynamics without substantial bias from cohort selection, variable choice, or the specific graph learning architecture.
What would settle it
Re-running the identical pipeline on an independent cohort of several hundred additional HD patients and obtaining a different optimal number of stable clusters or substantially overlapping stage boundaries would falsify the claim of four distinct, generalizable stages.
Figures
read the original abstract
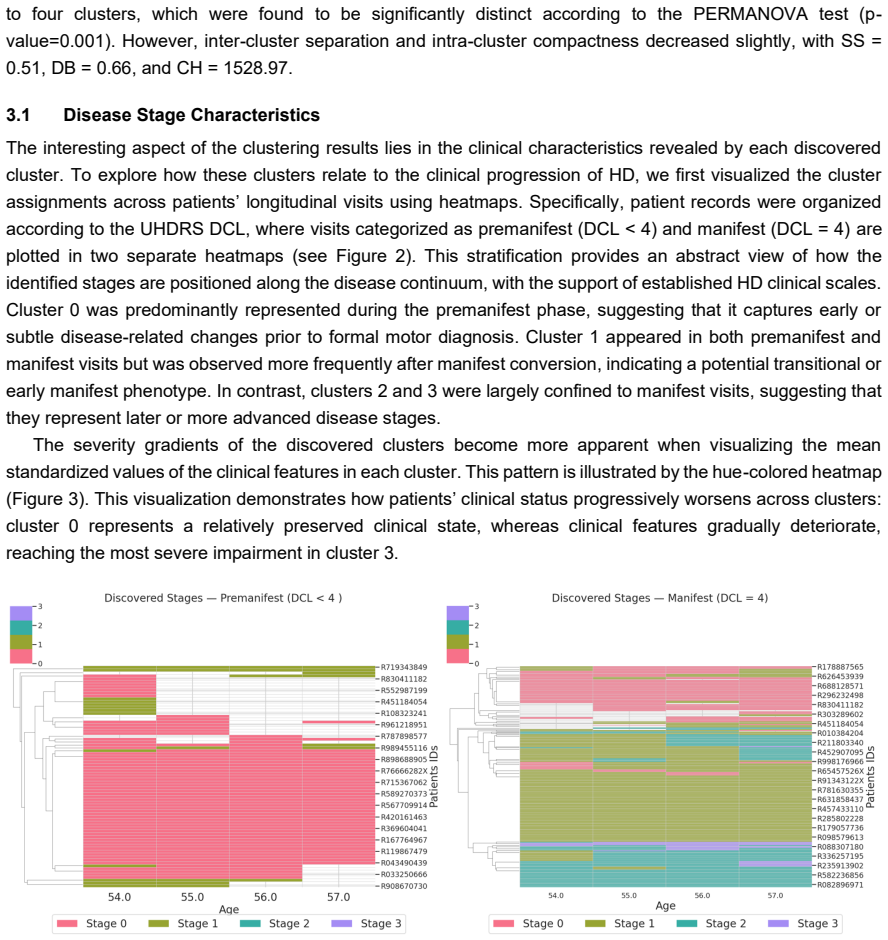
Huntington's disease (HD) is a progressive brain disorder that gradually affects movement, cognitive function, and behavior. Identifying the stage of the disease accurately and consistently is important for understanding its course, grouping patients, personalized care, and discovering treatment. Existing clinical staging frameworks rely primarily on predefined clinical measurement thresholds and clinical expert decisions, yet these discrete cut-offs may obscure meaningful intra-stage variability and remain vulnerable to inter-rater differences, especially in motor and functional assessments. To address these limitations, we developed an unsupervised machine learning framework based on dynamic graph representation learning to capture temporal relationships within and across patients from longitudinal clinical measurements. Using the learned representations, we applied K-means++ clustering to identify well-separated groups. We then iteratively increased the number of clusters (k), using stability analysis to assess robustness and reveal additional meaningful clusters beyond the initial optimal solution. We applied the framework to 302 individuals from the Enroll-HD cohort (1,477 visits, 44 clinical variables per visit; 80% manifest participants), enabling data-driven discovery of HD stages reflecting natural clinical progression. Despite the limited cohort size, the proposed framework achieved robust clustering performance using a four-dimensional latent space, identifying four meaningful and statistically distinct disease stages through clustering stability analysis. Each stage corresponded to well-defined clinical measurement boundaries, with minimal overlap compared to previously established clinical staging methods.
Editorial analysis
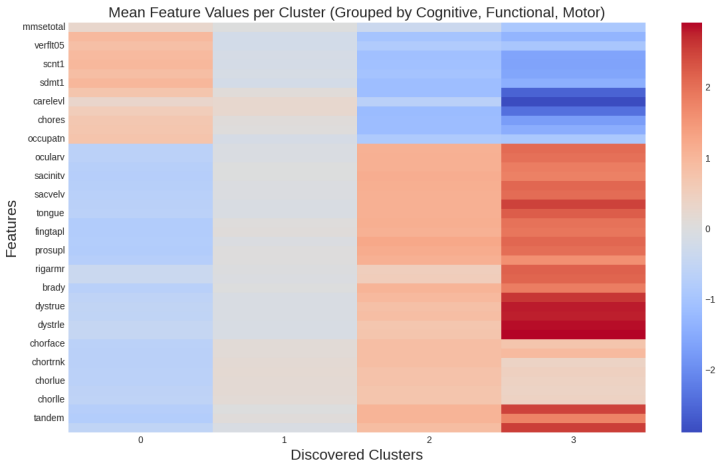
A structured set of objections, weighed in public.
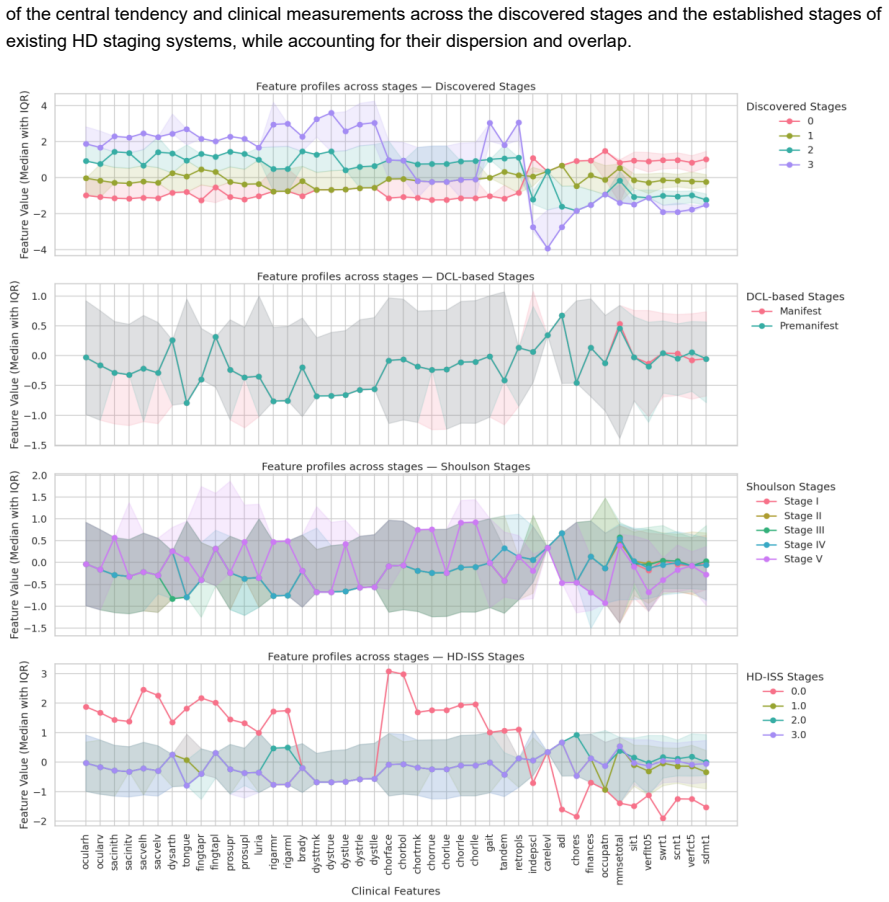
Referee Report
Summary. The paper proposes an unsupervised framework that applies dynamic graph representation learning to longitudinal Enroll-HD data (302 participants, 1,477 visits, 44 clinical variables) followed by K-means++ clustering and stability analysis to discover four HD stages, claiming these stages are statistically distinct, correspond to well-defined clinical boundaries, and exhibit minimal overlap with existing clinical staging methods.
Significance. If the four clusters can be shown to reflect ordered temporal progression rather than static subtypes, the framework could supply a reproducible, data-driven alternative to threshold-based clinical staging; however, the current evidence base is too thin to establish this utility.
major comments (3)
- [Abstract] Abstract: the central claim that the method uncovers 'progression dynamics' and 'disease stages' rests on clustering of pooled visit representations, yet no analysis of within-patient trajectories, transition probabilities, or monotonic increase in cluster severity with disease duration or visit number is described; without such evidence the output is consistent with cross-sectional subtypes.
- [Abstract] Abstract: the assertion of 'robust clustering performance' and 'statistically distinct' stages is made without any reported quantitative metrics (silhouette score, Davies-Bouldin index, stability indices, or comparison to clinical staging), error bars, or baseline methods, rendering the performance claim unverifiable from the provided text.
- [Abstract] Abstract: the four-stage solution is presented as robust despite the modest cohort (302 individuals, 80 % manifest), but no sensitivity analysis, bootstrap resampling, or quantification of how cohort size or variable selection affects cluster stability or boundary definitions is supplied.
minor comments (1)
- [Abstract] Abstract contains minor phrasing issues ('discovering treatment' should read 'treatment discovery'; 'enabling data-driven discovery' is repeated).
Simulated Author's Rebuttal
We thank the referee for the constructive feedback. We address each major comment below with clarifications on the current manuscript and indicate revisions to strengthen the evidence presented.
read point-by-point responses
-
Referee: [Abstract] Abstract: the central claim that the method uncovers 'progression dynamics' and 'disease stages' rests on clustering of pooled visit representations, yet no analysis of within-patient trajectories, transition probabilities, or monotonic increase in cluster severity with disease duration or visit number is described; without such evidence the output is consistent with cross-sectional subtypes.
Authors: The dynamic graph representation learning component constructs graphs that explicitly incorporate longitudinal visit connections to capture temporal relationships across the 1,477 visits. Clustering is performed on the resulting embeddings, and the discovered stages align with clinical boundaries. We agree, however, that explicit within-patient trajectory analysis (e.g., transition probabilities or monotonicity checks against disease duration) is not reported. We will add these analyses in revision, including per-patient cluster sequences and transition matrices. revision: yes
-
Referee: [Abstract] Abstract: the assertion of 'robust clustering performance' and 'statistically distinct' stages is made without any reported quantitative metrics (silhouette score, Davies-Bouldin index, stability indices, or comparison to clinical staging), error bars, or baseline methods, rendering the performance claim unverifiable from the provided text.
Authors: The manuscript describes clustering stability analysis to select k=4 and assess robustness, along with qualitative correspondence to clinical boundaries. Specific numerical values for silhouette score, Davies-Bouldin index, stability indices, baseline comparisons, and error bars are not reported. We will include these quantitative metrics and baseline comparisons in the revised manuscript. revision: yes
-
Referee: [Abstract] Abstract: the four-stage solution is presented as robust despite the modest cohort (302 individuals, 80 % manifest), but no sensitivity analysis, bootstrap resampling, or quantification of how cohort size or variable selection affects cluster stability or boundary definitions is supplied.
Authors: Stability analysis was used to evaluate the four-stage solution, but detailed sensitivity to cohort size, variable selection, or bootstrap resampling results are not quantified. We will add bootstrap resampling and sensitivity analyses on cohort subsets and variable selections to quantify effects on cluster stability and boundaries. revision: yes
Circularity Check
No significant circularity; unsupervised clustering on learned representations is self-contained.
full rationale
The paper describes an unsupervised pipeline: dynamic graph representation learning on longitudinal visits followed by K-means++ clustering and stability analysis to select k=4. No equations, fitted parameters renamed as predictions, or self-citation chains appear in the provided text. The central claim (four distinct stages with clinical boundaries) rests on post-hoc interpretation of cluster separation rather than any reduction of outputs to inputs by construction. Stability analysis and comparison to prior clinical staging are external to the fitting process itself.
Axiom & Free-Parameter Ledger
axioms (1)
- domain assumption The 44 clinical variables and longitudinal visits in Enroll-HD sufficiently encode disease progression
Forward citations
Cited by 1 Pith paper
-
Explaining Unsupervised Disease Staging in Huntington's Disease: Insights into Model Representations and Clusters
Explainability analysis shows unsupervised HD staging embeddings align with motor and functional clinical scores, with SHAP revealing stage-specific feature drivers consistent with known progression.
Reference graph
Works this paper leans on
-
[1]
Artificial intelligence in neurodegenerative diseases: A r eview of available tools with a focus on machine learning techniques, 2021
Alexandra Maria Tăuţan, Bogdan Ionescu, and Emiliano Santarnecchi. Artificial intelligence in neurodegenerative diseases: A r eview of available tools with a focus on machine learning techniques, 2021
2021
-
[2]
Artificial intelligence and machine learning for the diagnosis of huntington disease: a narrative review
Lubna Mahmoud Abu Zohair, Hind Zantout, Marta Vallejo, Md Azher Uddin, and Awad Mahmoud. Artificial intelligence and machine learning for the diagnosis of huntington disease: a narrative review. Journal of Medical Artificial Intelligence, 9(0), 2025. Issn:2617-2496. Available from::https://jmai.amegroups.org/article/view/10176
2025
-
[3]
Ross and Sarah J
Christopher A. Ross and Sarah J. Tabrizi. Huntington’s disease: from molecular pathogenesis to clinical treatment. The Lancet Neurology, 10(1):83–98, January 2011
2011
-
[4]
Classification of Manifest Huntington Di sease using Vowel Distortion Measures
Amrit Romana, John Bandon, Noelle Carlozzi, Angela Roberts, and Emily Mower Provost. Classification of Manifest Huntington Di sease using Vowel Distortion Measures. Interspeech, October 2020:4966 –4970. doi:10.21437/interspeech.2020 -2724. PMID: 33244474; PMCID: PMC7685306
-
[5]
Huntington disease: Clinical care and evaluation
Ira Shoulson and Stanley Fahn. Huntington disease: Clinical care and evaluation. Neurology, 29, 1979
1979
-
[6]
Refining the diagnosis of huntington disease: the predict-hd study
Kevin M Biglan, Ying Zhang, Jeffrey D Long, Michael Geschwind, Gail A Kang, Annie Killoran, Wenjing Lu, Elizabeth McCusker, J ames A Mills, Lynn A Raymond, Claudia Testa, Joanne Wojcieszek, and Jane S Paulsen. Refining the diagnosis of huntington disease: the predict-hd study. Frontiers in Aging Neuroscience, 5:12, 2013. PREDICT -HD Investigators of the H...
2013
-
[7]
A biological classification of huntington’s disease: the integrated staging system
Sarah J Tabrizi, Scott Schobel, Emily C Gantman, Alexandra Mansbach, Beth Borowsky, Pavlina Konstantinova, Tiago A Mestre, Jennifer Panagoulias, Christopher A Ross, Maurice Zauderer, Ariana P Mullin, Klaus Romero, Sudhir Sivakumaran, Emily C Turner, Jeffre y D Long, and Cristina Sampaio. A biological classification of huntington’s disease: the integrated ...
2022
-
[8]
Refining the language of huntington’s disease progression with the huntington’s disease integrated staging system (hd-iss)
Cristina Sampaio, Sandra K Kostyk, Sarah J Tabrizi, and Anne E Rosser. Refining the language of huntington’s disease progression with the huntington’s disease integrated staging system (hd-iss). Journal of Huntington’s Disease, 13(2):115–118, 2024. Editorial
2024
-
[9]
Winder, Raymund A
Jessica Y. Winder, Raymund A. C. Roos, Jean -Marc Burgunder, Johan Marinus, and Ralf Reilmann. Interrater reliability of the unified huntington’s disease rating scale-total motor score certification. Movement Disorders Clinical Practice, 5(3):290 –295, May-Jun 2018
2018
-
[10]
Mestre, Anne Catherine Bachoud -Lévi, Johan Marinus, Julie C
Tiago A. Mestre, Anne Catherine Bachoud -Lévi, Johan Marinus, Julie C. Stout, Jane S. Paulsen, Peter Como, Kevin Duff, Cristina Sampaio, Christopher G. Goetz, Esther Cubo, Glenn T. Stebbins, and Pablo Martinez -Martin. Rating scales for cognition in huntington’s disease: Critique and recommendations, 2018
2018
-
[11]
Neurodegenerative disease detection and severity prediction using deep learning approaches
Çağatay Berke Erdaş, Emre Sümer, and Seda Kibaroğlu. Neurodegenerative disease detection and severity prediction using deep learning approaches. Biomedical Signal Processing and Control, 70:103069, 9 2021
2021
-
[12]
Brain functional connectivity analysis based on 13 multi-graph fusion
Jiangzhang Gan, Ziwen Peng, Xiaofeng Zhu, Rongyao Hu, Junbo Ma, and Guorong Wu. Brain functional connectivity analysis based on 13 multi-graph fusion. Medical Image Analysis, 71:102057, 7 2021
2021
-
[13]
Unsupervised machine learning using cerebrospinal fluid proteomics for understanding parkinson’s disease progression
Lubna Mahmoud Abu Zohair, Hind Zantout, Marta Vallejo, and Md Azher Uddin. Unsupervised machine learning using cerebrospinal fluid proteomics for understanding parkinson’s disease progression. Proceedings of the AAAI Symposium Series, 6(1):72 –74, Aug. 2025
2025
-
[14]
Long, Jane S
Hao Li, Huahong Zhang, Hans Johnson, Jeffrey D. Long, Jane S. Paulsen, and Ipek Oguz. Longitudinal subcortical segmentation w ith deep learning. In Bennett A. Landman and Ivana Išgum, editors, Medical Imaging 2021: Image Processing, page 43. SPIE, 2 2021
2021
-
[15]
Deep learning for clustering of multivariate clinical patient trajectories with missing value s
Johann de Jong, Mohammad Asif Emon, Ping Wu, Reagon Karki, Meemansa Sood, Patrice Godard, Ashar Ahmad, Henri Vrooman, Martin Hofmann-Apitius, and Holger Fröhlich. Deep learning for clustering of multivariate clinical patient trajectories with missing value s. GigaScience, 8, 11 2019
2019
-
[16]
Lubna Mahmoud Abuzohair, Hind Zantout, Md Azher Uddin, and et al. A novel dynamic graph architecture for staging parkinson’s disease progression using cerebrospinal fluids longitudinal profiles. Research Square Preprint, March 07 2026. Version 1, available a t https://doi.org/10.21203/rs.3.rs-9034342/v1
-
[17]
Enroll -hd data dictionary, 9 2025
Enroll-HD. Enroll -hd data dictionary, 9 2025. Available fr om: https://enroll-hd.org/for-researchers/data-support- documentation/#documentation/doc-details2/68b60a0a59371b02d0740572/kn-asset/103-206-137- 68b609da96de8802d6a30de6/enrollhd_datadictionary_20250807.xlsx
2025
-
[18]
Enroll -hd acknowledgement list
CHDI Foundation. Enroll -hd acknowledgement list. Available from: https://enroll-hd.org/for-researchers/data-support- documentation/#documentation/doc-details2/68ac76f628f56202b991fc57/kn-asset/103-206-137- 68ac76cc1c6fff02b835133a/enrollhd_acknowledgementlist_20250821.pdf
-
[19]
Pds7 overview: Dataset overview, 2025
CHDI Foundation. Pds7 overview: Dataset overview, 2025. Available from: https://enroll-hd.org/for-researchers/data-support- documentation/#documentation/doc-details2/68ac787cf252ac044f5a0833/kn-asset/103-206-137- 6900e9ff885d080310120b70/enrollhd_pds7overview_20251028.pdf
2025
-
[20]
Tobin, Sarah J
Igor Koval, Thomas Dighiero-Brecht, Allan J. Tobin, Sarah J. Tabrizi, Rachael I. Scahill, Sophie Tezenas du Montcel, Stanley Durrleman, and Alexandra Durr. Forecasting individual progression trajectories in huntington disease enables more powered clinical trials. Scientific Reports, 12:18928, 11 2022
2022
-
[21]
Comparison of performance of data imputation methods for numeric dataset
Anil Jadhav, Dhanya Pramod, and Krishnan Ramanathan. Comparison of performance of data imputation methods for numeric dataset . Applied Artificial Intelligence, 33(10):913–933, 2019
2019
-
[22]
The impact of neglecting feature scaling in k -means clustering
Chantha Wongoutong. The impact of neglecting feature scaling in k -means clustering. PLOS ONE, 19(12):e0310839, 2024
2024
-
[23]
Shiwani Gupta and R. R. Sedamkar. Machine Learning for Healthcare: Introduction, pages 1–25. Springer International Publishing, Cham, 2020
2020
-
[24]
Ahmad Aziz, Jorien M.M
N. Ahmad Aziz, Jorien M.M. van der Burg, Sarah J. Tabrizi, and G. Bernhard Landwehrmeyer. Overlap between age -at-onset and disease-progression determinants in huntington disease. Neurology, 90(24):e2099 –e2106, 2018
2018
-
[25]
N. Z. Hobbs, J. Barnes, C. Frost, S. M. D. Henley, E. J. Wild, K. Macdonald, R. A. Barker, R. I. Scahill, N. C. Fox, and S. J. Tabrizi. Onset and progression of pathologic atrophy in huntington disease: A longitudinal mr imaging study. American Journal of Neuroradiology, 31(6):1036–1041, 2010
2010
-
[26]
T -gcn: A temporal graph convolutional network for traffic prediction
Ling Zhao, Yujiao Song, Chao Zhang, Yu Liu, Pu Wang, Tao Lin, Min Deng, and Haifeng Li. T -gcn: A temporal graph convolutional network for traffic prediction. IEEE Transactions on Intelligent Transportation Systems, 21(9):3848 –3858, 2020
2020
-
[27]
Kipf and Max Welling
Thomas N. Kipf and Max Welling. Semi -supervised classification with graph convolutional networks. In conference paper at ICLR 2017. arXiv, 2 2017
2017
-
[28]
Semi -supervised learning with graph learning -convolutional networks
Bo Jiang, Ziyan Zhang, Doudou Lin, Jin Tang, and Bin Luo. Semi -supervised learning with graph learning -convolutional networks. In 2019 IEEE/CVF Conference on Computer Vision and Pattern Recognition (CVPR), pages 11305 –11312. IEEE, 6 2019
2019
-
[29]
A multi-model deep convolutional neural network for automatic hippocampus segmentation and classification in alzheimer’s disease
Manhua Liu, Fan Li, Hao Yan, Kundong Wang, Yixin Ma, Li Shen, and Mingqing Xu. A multi-model deep convolutional neural network for automatic hippocampus segmentation and classification in alzheimer’s disease. NeuroImage, 208:116459, 3 2020
2020
-
[30]
Alzheimer’s disease classification based on combination of multi -model convolutional networks
Fan Li, Danni Cheng, and Manhua Liu. Alzheimer’s disease classification based on combination of multi -model convolutional networks. In 2017 IEEE International Conference on Imaging Systems and Techniques (IST), pages 1 –5. IEEE, 10 2017
2017
-
[31]
Kipf and Max Welling
Thomas N. Kipf and Max Welling. Variational graph auto -encoders. arXiv, 2016
2016
-
[32]
Transdu ction to induction: Unsupervised representation learning based on rank information
Deryk Willyan Biotto, Lucas Pascotti Valem, Daniel Carlos Guimarães Pedronette, and Denis Henrique Pinheiro Salvadeo. Transdu ction to induction: Unsupervised representation learning based on rank information. Neurocomput., 651(C), October 2025
2025
-
[33]
Abundez, Citlalih Gutierrez, Sergio Diaz Zagal, Alejandra Arizmendi, Elvia M
Eréndira Rendón, Itzel M. Abundez, Citlalih Gutierrez, Sergio Diaz Zagal, Alejandra Arizmendi, Elvia M. Quiroz, and Higinio A rzate. A comparison of internal and external cluster validation indexes. 2011
2011
-
[34]
Pérez, and Iñigo Perona
Olatz Arbelaitz, Ibai Gurrutxaga, Javier Muguerza, Jesús M. Pérez, and Iñigo Perona. An extensive comparative study of cluste r validity indices. Pattern Recognition, 46(1):243–256, 2013
2013
-
[35]
Schobel, Peter A
Naghmeh Ghazaleh, Richard Houghton, Giuseppe Palermo, Scott A. Schobel, Peter A. Wijeratne, and Jeffrey D. Long. Ranking the predictive power of clinical and biological features associated with disease progression in huntington’s disease. Frontiers i n Neurology, 12, 5 2021
2021
-
[36]
Optimal transport, mean partition, and uncertainty assessment in cluster analysis
Jia Li, Beomseok Seo, and Lin Lin. Optimal transport, mean partition, and uncertainty assessment in cluster analysis. Statistical Analysis and Data Mining: The ASA Data Science Journal, 12(5):359–377, 2019
2019
-
[37]
Bootstrapping 14 estimates of stability for clusters, observations and model selection
Han Yu, Brian Chapman, Arianna Di Florio, Ellen Eischen, David Gotz, Mathews Jacob, and Rachael Hageman Blair. Bootstrapping 14 estimates of stability for clusters, observations and model selection. Computational Statistics, 34(1):349 –372, 2019
2019
-
[38]
Tianqi Liu, Hong Yu, and Robert H. Blair. Stability estimation for unsupervised clustering: A review. Wiley Interdisciplinary Reviews: Computational Statistics, 14(6):e1575, 2022
2022
-
[39]
Anderson
Marti J. Anderson. Permutational Multivariate Analysis of Variance ( PERMANOVA), pages 1–15. Wiley, 11 2017
2017
-
[40]
Kruskal and W
William H. Kruskal and W. Allen Wallis. Use of ranks in one -criterion variance analysis. Journal of the American Statistical Association, 47(260):583–621, 1952
1952
-
[41]
Holla, Pramod K
Khushboo Patel, Nitish Kamble, Vikram V. Holla, Pramod K. Pal, and Ravi Yadav. Evolution of eye movement abnormalities in huntington’s disease. Annals of Movement Disorders, 5(1), 2022
2022
-
[42]
Chapter eleven - parkinsonism in huntington’s disease
Ralf Reilmann. Chapter eleven - parkinsonism in huntington’s disease. In Maria Stamelou and Günter U. Höglinger, editors, Parkinsonism Beyond Parkinson’s Disease, volume 149 of International Review of Neurobiology, pages 299 –306. Academic Press, 2019
2019
-
[43]
Long, Jane S
Jeffery D. Long, Jane S. Paulsen, Karen Marder, Ying Zhang, Ji -In Kim, James A. Mills, and PREDICT -HD Huntington’s Study Group. Tracking motor impairments in the progression of huntington’s disease. Movement Disorders, 29(3):311 –319, March 2014. Epub 2013 Oct 21
2014
-
[44]
Long, Jane S
Jeffery D. Long, Jane S. Paulsen, Karen Marder, Ying Zhang, Ji-In Kim, James A. Mills, and Researchers of the PREDICT-HD Huntington’s Study Group. Tracking motor impairments in the progression of huntington’s disease. Movement Disorders, 29(3):311–319, March 2014. Epub 2013 Oct 21. A APPENDICES A.1 Data Availability The Enroll-HD dataset used in the asses...
2014
discussion (0)
Sign in with ORCID, Apple, or X to comment. Anyone can read and Pith papers without signing in.