REVIEW 3 major objections 3 minor 12 references
Improved MR to CT synthesis for PET/MR attenuation correction using Imitation Learning
T0 review · 3 major / 3 minor · reviewed 2026-08-14 · deepseek-v4-flash
Pith's one-line read Optimizing PET residuals, not CT similarity, improves MR-to-CT synthesis for PET/MR attenuation correction.
desk verdict A genuinely different MR-to-CT synthesis idea for PET/MR attenuation correction, but the slice-level split and unvalidated imitation network mean the headline PET improvement isn't established. read the letter →
The pith
A machine-rendered reading of the paper's core claim, the machinery that carries it, and where it could break.
The reading
What carries the argument
The central machinery is a three-phase training schedule. In phase one, a convolutional network is trained with a Winner-Takes-All loss to output several plausible pCTs from one MR, so each output head specialises in different anatomical features such as skull thickness or bone density. In phase two, a second network is trained, with the first network frozen, to take a CT and a pCT as input and predict the absolute residual between the true PET and the PET reconstructed using that pCT as the attenuation map; training data comes from a simulated PET acquisition and reconstruction pipeline. In phase three, the first network is retrained with a loss that is an equal combination of the CT L2 error and the learned PET-residual metric, which acts as a differentiable imitation of the reconstruction process. The multi-hypothesis Winner-Takes-All scheme is what allows the generator to maintain several plausible solutions rather than a single risk-minimising average.
What would settle it
Compute the imitation network's predicted PET residual maps on the retrained pCTs and compare them to the actual simulated PET residual maps; if the predictions are substantially inaccurate or biased, the improvement in pPET mean absolute error cannot be attributed to the learned metric.
Extended reading notes
Core claim
The paper's central discovery is that minimising the intensity-wise error between a synthetic CT and the true CT is not a good surrogate for minimising the error in the PET image that will be reconstructed from that synthetic CT. A small, localised difference in CT attenuation can produce a large error in the reconstructed PET. The authors therefore propose a differentiable proxy for PET reconstruction: a convolutional network trained on pairs of (CT, pCT) to predict the residual between the gold-standard PET and the pseudo-PET reconstructed with each pCT. When this proxy is used as a loss term in retraining the multi-hypothesis pCT generator, the generator learns pCTs that score worse on CT mean absolute error but better on PET mean absolute error by a statistically significant margin. The paper also reports that sampling multiple pCT hypotheses gives a more reliable estimate of PET uncertainty than Monte-Carlo dropout.
Load-bearing premise
The imitation network, trained on only 60 pCT/pPET pairs from 20 slices, remains accurate on the pCTs produced after the first network is retrained, even though those retrained pCTs were not part of its training distribution.
Editorial extensions
If this is right
- Evaluation of pCT synthesis should include downstream PET error, not just CT intensity metrics, because the two can disagree.
- A learned differentiable proxy for PET reconstruction can be used to optimise the pCT generator without needing to reconstruct every training sample.
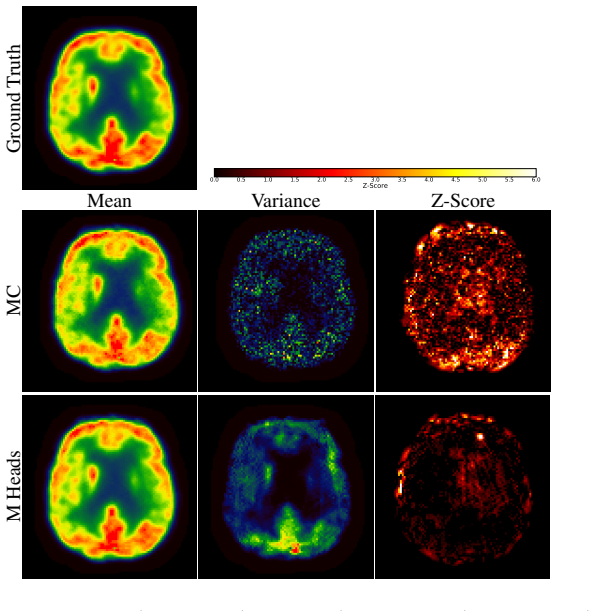
- Multi-hypothesis sampling gives a wider and more reliable distribution of pPET intensities than Monte-Carlo dropout when estimating PET uncertainty.
- The framework produces an average reduction in pPET mean absolute error from about 141 to about 115 arbitrary units on the held-out test data.
Reading between the lines
- The same imitation-loss idea could transfer to radiotherapy planning, where synthetic CTs are used for dose calculation and the real metric is dose error, not CT intensity error.
- Because the imitation network is trained on a specific PET reconstruction simulation, its benefit may shrink if the clinical reconstruction pipeline differs from the simulation; testing across reconstruction parameters would clarify this.
- The multi-hypothesis outputs could serve as a built-in uncertainty estimate for the pCT itself, potentially flagging slices where the downstream PET is unreliable.
Signed reviews
Editorial analysis
A structured set of objections, weighed in public.
Referee Report
Summary. The manuscript proposes a two-stage deep learning method for MR-to-CT synthesis in PET/MR attenuation correction. A multi-hypothesis HighResNet first generates M candidate pCTs; a second 'imitation' network learns to predict PET reconstruction residual maps from CT/pCT pairs; the first network is then retrained with a loss combining the CT L2 error and the imitation metric. The authors report on 400 slices from 20 patients that the proposed imitation learning yields a higher CT MAE (69.68 HU) than a baseline HighResNet (66.25 HU) but a significantly lower PET MAE (115.41 vs 140.76 arbitrary units; paired t-test p<10^-4). They also compare multi-hypothesis sampling with MC dropout for uncertainty estimation.
Significance. If the claimed downstream PET improvement were robustly demonstrated, the paper would make a useful contribution to MR-based attenuation correction by explicitly optimizing for PET-relevant error rather than CT fidelity, and by introducing a learned differentiable surrogate for the PET reconstruction process. The multi-hypothesis formulation and the comparison with MC dropout are also interesting. However, the current evidence is undermined by methodological concerns in the evaluation protocol and by the lack of validation of the surrogate metric network; the central claim that minimizing the learned metric improves final PET reconstruction remains to be established.
major comments (3)
- [Section 2.3 and Section 3] The 70/10/20 split is described as being performed on 'whole images', which in this paper are the 400 extracted 2D slices from 20 patients. The manuscript does not state that the split is patient-wise. Since the 20 central slices from a single patient are highly correlated in anatomy and intensity, a random slice-level split places slices from the same patient in both training and test sets. The reported paired t-test on the test slices then treats within-patient correlated observations as independent, which is pseudoreplication. Consequently, the central quantitative claim—that imitation learning significantly reduces pPET MAE (p<10^-4)—does not demonstrate cross-patient generalization. The authors should repeat the evaluation with a patient-level split or use a cluster-adjusted statistical test.
- [Section 2.2] The imitation network g_psi is trained on only 60 pCT/pPET pairs derived from 20 slices, and no validation of g_psi is reported (e.g., accuracy of its predicted PET residual maps on held-out patients). After the first network is retrained using g_psi as a loss term, the resulting pCTs are likely outside the distribution of the 60 training pairs. Without evidence that g_psi remains accurate on pCTs produced by the retrained network, the proposed mechanism for the PET improvement is unsupported. The authors should provide a quantitative evaluation of g_psi on an independent test set and demonstrate that minimizing the learned metric correlates with true PET residuals.
- [Section 2.2] The combined loss for the first network is written as L(x_i, y_i, z_i) = min_m [g_psi(f_phi(x_i), y_i), z_i]. This expression is not a well-defined scalar objective: g_psi outputs an error map, z_i is the ground-truth residual map, and the bracketed notation is ambiguous. The text later states that the first network is retrained using 'both the CT L2-loss and the metric loss in equal proportions', but the exact functional form and weighting are not specified. Since this loss is the core of the proposed method, the authors must define it precisely to make the method reproducible and the optimization objective unambiguous.
minor comments (3)
- [Section 3] The description of data extraction states that '20 central slices per volume' were used, resulting in 400 images, but it is unclear how these slices were selected across patients (e.g., whether the same anatomical locations were used). This matters for interpreting the slice-level split and the extent of correlation in the test set.
- [Section 4] The PET MAE values are reported in arbitrary units ('a.u.'), but the manuscript does not explain how these units are defined or normalized. Please clarify the scale of the PET intensities and whether the MAE is computed on absolute activity values or on some standardized scale.
- [Section 2.4] Several implementation details are missing, including the number of hypotheses M, the exact weighting between the CT L2 loss and the metric loss during retraining, and the convergence criteria. Reporting these would improve reproducibility.
Circularity Check
No constructional circularity: the claimed pPET improvement is assessed with actual PET reconstruction, not with the fitted surrogate loss.
full rationale
The paper's derivation chain is a three-stage training loop: (1) a multi-hypothesis HighResNet f is trained with an L2 winner-takes-all loss; (2) a second network g_psi is trained on pCTs produced by the frozen f to predict the PET residual between the true PET and the pPET reconstructed from each pCT; (3) f is retrained using a combination of the CT L2-loss and g_psi as a learned metric. The final quantitative claim is not obtained by evaluating g_psi on the retrained pCTs. Instead, the pCTs from the retrained network are used as mu-maps in a real PET forward-projection and reconstruction simulation, and the reported pPET MAE is computed against the true PET reconstructed from the CT. The predicted quantity is therefore not defined as the fitted metric output, and no equation in the paper reduces the final result to the training input by construction. The main weaknesses are correctness risks rather than circularity: the 70/10/20 split is performed on slices rather than patients, so the paired t-test may pseudoreplicate correlated slices from the same subject; and g_psi is trained on only 60 pCT/pPET pairs from 20 slices and is never validated, so the retrained f could shift outside the distribution where g_psi is accurate. These are empirical and statistical concerns, not definitional circularity. The self-citations (HighResNet [9], NiftyNet [10], NiftyPET [12]) are implementation tools or the baseline architecture and are not load-bearing to the central PET-improvement claim. No circular step can be exhibited with a specific reduction.
Assumptions & free parameters
free parameters (3)
- Loss weighting between CT L2 and metric loss =
0.5/0.5 (equal proportions)
- Number of hypotheses M =
not specified
- Train/validation/test split ratio =
70/10/20
assumptions (4)
- domain assumption CT Hounsfield units bi-linearly approximate linear attenuation coefficients (mu)
- domain assumption Simulated PET forward projection and reconstruction via NiftyPET faithfully models true PET acquisition
- domain assumption MR and CT images are correctly registered after rigid and low-DOF non-rigid alignment
- ad hoc to paper The 20 slices used to train the imitation network are representative of the full dataset
Cite this review
Pith. "Pith review of Improved MR to CT synthesis for PET/MR attenuation correction using Imitation Learning." pith.science (2026). https://pith.science/paper/2TIM4IE6
@misc{pith2026190808431,
  author       = {Pith},
  title        = {Pith review of: Improved MR to CT synthesis for PET/MR attenuation correction using Imitation Learning},
  year         = {2026},
  howpublished = {\url{https://pith.science/paper/2TIM4IE6}},
  note         = {Machine review of arXiv:1908.08431}
}
abstract
The ability to synthesise Computed Tomography images - commonly known as pseudo CT, or pCT - from MRI input data is commonly assessed using an intensity-wise similarity, such as an L2-norm between the ground truth CT and the pCT. However, given that the ultimate purpose is often to use the pCT as an attenuation map ($\mu$-map) in Positron Emission Tomography Magnetic Resonance Imaging (PET/MRI), minimising the error between pCT and CT is not necessarily optimal. The main objective should be to predict a pCT that, when used as $\mu$-map, reconstructs a pseudo PET (pPET) which is as close as possible to the gold standard PET. To this end, we propose a novel multi-hypothesis deep learning framework that generates pCTs by minimising a combination of the pixel-wise error between pCT and CT and a proposed metric-loss that itself is represented by a convolutional neural network (CNN) and aims to minimise subsequent PET residuals. The model is trained on a database of 400 paired MR/CT/PET image slices. Quantitative results show that the network generates pCTs that seem less accurate when evaluating the Mean Absolute Error on the pCT (69.68HU) compared to a baseline CNN (66.25HU), but lead to significant improvement in the PET reconstruction - 115a.u. compared to baseline 140a.u.
Figures


Figures from the paper (1 more)
Reference graph
Works this paper leans on
-
[1]
Volume 38., Elsevier (2008) 199–208
Pichler, B.J., et al.: Positron emission tomography/magnetic resonance imaging: the next generation of multimodality imaging? In: Seminars in nuclear medicine. Volume 38., Elsevier (2008) 199–208
work page 2008
-
[2]
Neu- roimage 147 (2017) 346–359
Ladefoged, C.N., et al.: A multi-centre evaluation of eleven clinically feasible brain pet/mri attenuation correction techniques using a large cohort of patients. Neu- roimage 147 (2017) 346–359
work page 2017
-
[3]
IEEE TMI 33(12) (2014) 2332–2341
Burgos, N., et al.: Attenuation correction synthesis for hybrid pet-mr scanners: application to brain studies. IEEE TMI 33(12) (2014) 2332–2341
work page 2014
-
[4]
arXiv preprint arXiv:1703.10593 (2017)
Zhu, J.Y., et al.: Unpaired image-to-image translation using cycle-consistent ad- versarial networks. arXiv preprint arXiv:1703.10593 (2017)
arXiv 2017
-
[5]
In: SASHIMI, Springer (2017) 14–23
Wolterink, J.M., et al.: Deep mr to ct synthesis using unpaired data. In: SASHIMI, Springer (2017) 14–23
work page 2017
-
[6]
Yang, H., et al.: Unpaired brain mr-to-ct synthesis using a structure-constrained cyclegan. In: Deep Learning in Medical Image Analysis and Multimodal Learning for Clinical Decision Support, Springer International Publishing (2018) 174–182
work page 2018
-
[7]
Jin, C.B., et al.: Deep ct to mr synthesis using paired and unpaired data. Sensors 19(10) (2019) 2361
work page 2019
-
[8]
In: Proceedings of the IEEE ICCV
Rupprecht, C., et al.: Learning in an uncertain world: Representing ambiguity through multiple hypotheses. In: Proceedings of the IEEE ICCV. (2017) 3591– 3600
work page 2017
Show all 12 references
-
[9]
In: IPMI, Springer (2017) 348–360
Li, W., et al.: On the compactness, efficiency, and representation of 3d convolu- tional networks: brain parcellation as a pretext task. In: IPMI, Springer (2017) 348–360
2017
-
[10]
CoRR abs/1709.03485 (2017)
Gibson, E., et al.: Niftynet: a deep-learning platform for medical imaging. CoRR abs/1709.03485 (2017)
2017 arXiv
-
[11]
Computer methods and programs in biomedicine 98(3) (2010) 278–284
Modat, M., et al.: Fast free-form deformation using graphics processing units. Computer methods and programs in biomedicine 98(3) (2010) 278–284
2010
-
[12]
Neuroinformatics 16(1) (2018) 95–115
Markiewicz, P.J., et al.: Niftypet: a high-throughput software platform for high quantitative accuracy and precision pet imaging and analysis. Neuroinformatics 16(1) (2018) 95–115
2018
Reviewed August 14, 2026 · model on record in the stance chip above.
Discussion (0). Continue with ORCID to comment.