REVIEW 3 major objections 6 minor 20 references
Expected performances of the Characterising Exoplanet Satellite (CHEOPS). I. Photometric performances from ground-based calibration
T0 review · 3 major / 6 minor · reviewed 2026-08-14 · deepseek-v4-flash
Pith's one-line read Pre-launch tests show CHEOPS can measure exoplanet radii to 2% and 5%.
desk verdict Honest, careful pre-launch calibration report; the instrument floor measurements are credible, but the abstract's 5% Earth-radius precision omits stellar granulation/activity and should be labeled an instrument-only bound. read the letter →
The pith
A machine-rendered reading of the paper's core claim, the machinery that carries it, and where it could break.
The reading
What carries the argument
The central mechanism is the pairing of a comprehensive ground calibration campaign with an end-to-end simulator, CHEOPSim, that turns measured instrument parameters into realistic synthetic science images. The calibration provides flat fields synthesized from narrowband measurements for any stellar spectrum, a gain model with temperature and voltage sensitivities, a measured PSF, and a long-duration stability sequence. CHEOPSim then injects these calibration products into simulated frames that include jitter, background stars, stray light, orbital interruptions, and the detector's readout chains. The photometric analysis extracts aperture photometry, corrects for background and centroid, and fits transits with a quadratic limb-darkening model using MCMC, producing the quoted radius precision.
What would settle it
Observe a known constant bright star with CHEOPS in orbit over 5 hours and measure the photometric noise: if the scatter exceeds the ground-calibrated 15 ppm floor (e.g., >20 ppm) on a star without detected variability, then the simulated transit precision and the 5% Earth-radius claim would not hold in practice.
Extended reading notes
Core claim
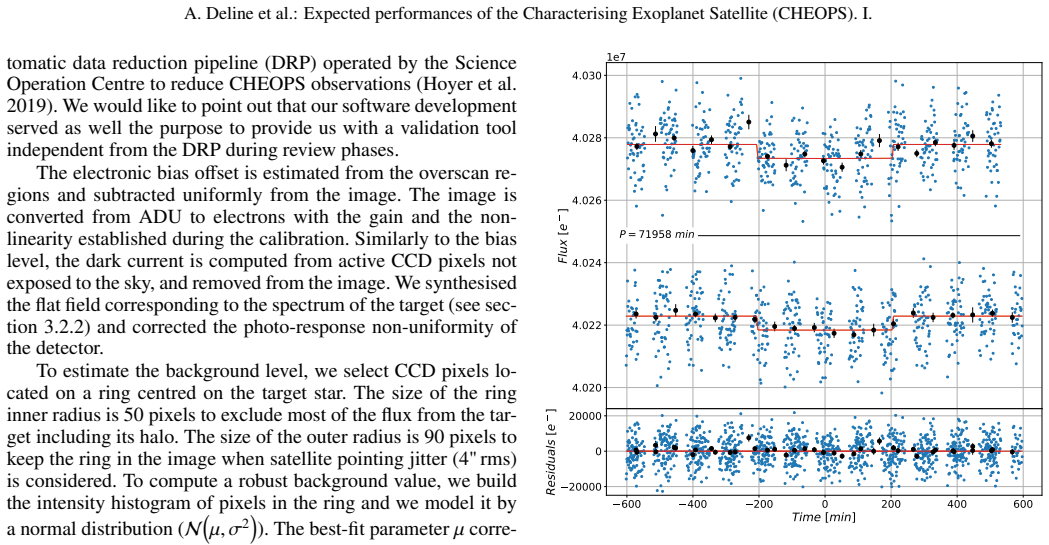
The central claim is that CHEOPS meets its pre-launch photometric requirements. Ground measurements using uniformly illuminated frames, corrected for a temperature-dependent calibration lamp drift, yield a residual noise floor of about 15 ppm over 5 hours, and a sub-aperture analysis reaches 20 ppm in 5 hours as required. Feeding the calibration products—flat fields, gain model, PSF, and noise—into the CHEOPSim end-to-end simulator, the authors generate synthetic transit light curves and fit them with a Markov chain Monte Carlo transit model. For a V=9 G2V star hosting an Earth-size planet (100 ppm transit depth), the recovered radius ratio has a 5% uncertainty; for a V=12 K5V star with a Neptune-size planet, the radius ratio is determined to 2%. These simulated residuals, 10.2 ppm and 51.7 ppm respectively, are close to the photon noise limit, and the authors conclude that the instrument is compliant with its design goal of detecting an Earth-size transit around a Sun-like star.
Load-bearing premise
The quoted precision numbers assume the target star is completely quiet, with no starspots or granulation noise; the simulations set stellar activity to 'none', so real stellar variability could add noise comparable to the planet's transit signal.
Editorial extensions
If this is right
- CHEOPS can achieve the mission requirement of detecting an Earth-size transit around a Sun-like star at V=9, since the 10.2 ppm residual is phonton-noise limited and below the 20 ppm budget.
- A single transit may be enough to detect an Earth-size planet around a bright Sun-like star, given the high signal-to-noise despite data gaps from orbital interruptions.
- Neptune-size planets around K-dwarfs can have their radii measured to 2% from one transit, with the precision limited more by degeneracies with impact parameter than by photon noise.
- The independent analysis pipeline produces results consistent with the official CHEOPS data reduction pipeline, indicating the performance does not depend on a particular reduction algorithm.
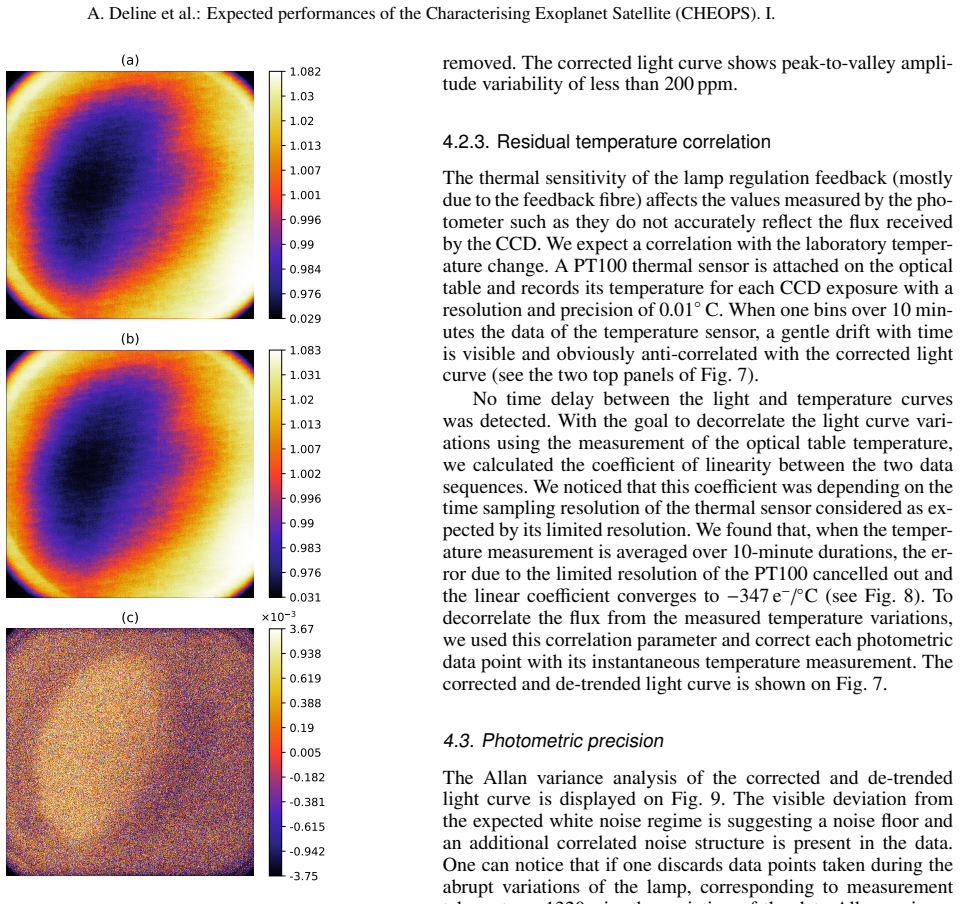
- The flat-field synthesis method allows correcting the detector response for any stellar spectrum to about 0.07% rms, which is sufficient for the required photometric precision.
Reading between the lines
- The quoted precision assumes a perfectly quiet star; real G2V stars exhibit granulation and starspot noise that can reach tens of ppm on hour timescales, comparable to the 100 ppm Earth transit depth, so the 5% radius precision may degrade when those sources are included.
- The temperature-correlated drift discovered in the calibration bench (a feedback-fibre index change) shows that even a grounded 'super-stable' source can introduce systematics; in flight, thermal variations of the telescope or optics could analogously require monitoring with onboard temperature sensors.
- If the in-orbit noise floor turns out to be higher than 15 ppm—due to unmodelled stray light, focusing changes in zero gravity, or cosmic-ray hits—the error budget would need revision, but the margin between measured stability and the 20 ppm requirement provides some headroom.
- The single-transit detection capability implies CHEOPS could confirm long-period TESS candidates that are observed only once, since the Earth-transit case reaches high signal-to-noise despite gaps.
Signed reviews
Editorial analysis
A structured set of objections, weighed in public.
Referee Report
Summary. The paper reports on ground-based calibration of the CHEOPS payload and uses those calibration products to predict in-flight photometric performance. From a 27.35-hour uniformly illuminated sequence, the authors derive a 15 ppm photometric stability floor over 5 hours after correcting for source variability and a temperature-dependent optical-table effect. They then use the CHEOPSim end-to-end simulator, fed with the measured calibration products, to simulate transits of an Earth-size planet around a V=9 G2V star and a Neptune-size planet around a V=12 K5V star. Aperture photometry, background estimation, centroiding, and MCMC transit fits yield quoted precisions on Rp/R* of 5% and 2%, respectively, with SNR on transit depth of 10 and 25. The analysis is compared to the independent CHEOPS data reduction pipeline and found consistent.
Significance. If the central claims hold, the paper demonstrates that CHEOPS meets its top-level photometric requirements: 15 ppm on-ground stability, 20 ppm in 6 hours for an Earth-size transit, and 85 ppm in 3 hours for a Neptune-size transit. These numbers are important for the exoplanet community because they set expectations for the precision of radii measurements from CHEOPS follow-up. The work has real strengths: the ground calibration is detailed (flat-field synthesis from narrow-band filters, gain/dark/bias stability, PSF characterization), the end-to-end simulation uses calibration-derived detector parameters rather than ad hoc values, and the comparison with an independent pipeline adds confidence. However, the headline precision numbers are presented without a prominent caveat that the simulated noise model omits stellar granulation and activity, and the 15 ppm floor is measured after fitting a temperature correction to the same dataset. The abstract's wording therefore overstates what is demonstrated.
major comments (3)
- [Section 5.1.2, Table 1] The end-to-end simulation sets 'Activity none' and explicitly excludes spots and granulation, and Section 5.1.2 also omits cosmic rays and smearing. The quoted 5% precision on Rp/R* for an Earth-size planet orbiting a V=9 G2V star is therefore an instrument-plus-photon-noise lower bound, not a predicted science precision. For a solar-type star, granulation contributes roughly 10-30 ppm rms on timescales from minutes to hours, which is comparable to the ~100 ppm Earth-transit depth. Adding only 20 ppm of stellar noise in quadrature to the reported 10.2 ppm residual raises the depth uncertainty to about 22 ppm, degrading the expected radius precision from 5% to roughly 10%. The abstract and Section 6 present the 5% as an expected in-flight performance without this caveat. The Neptune 2% claim is more robust because the 2550 ppm depth is much larger, but it is affected by the same omission. I recommend either adding stellar noise to the simulation or explicitly relabeling the quoted precisions as instrument-limited.
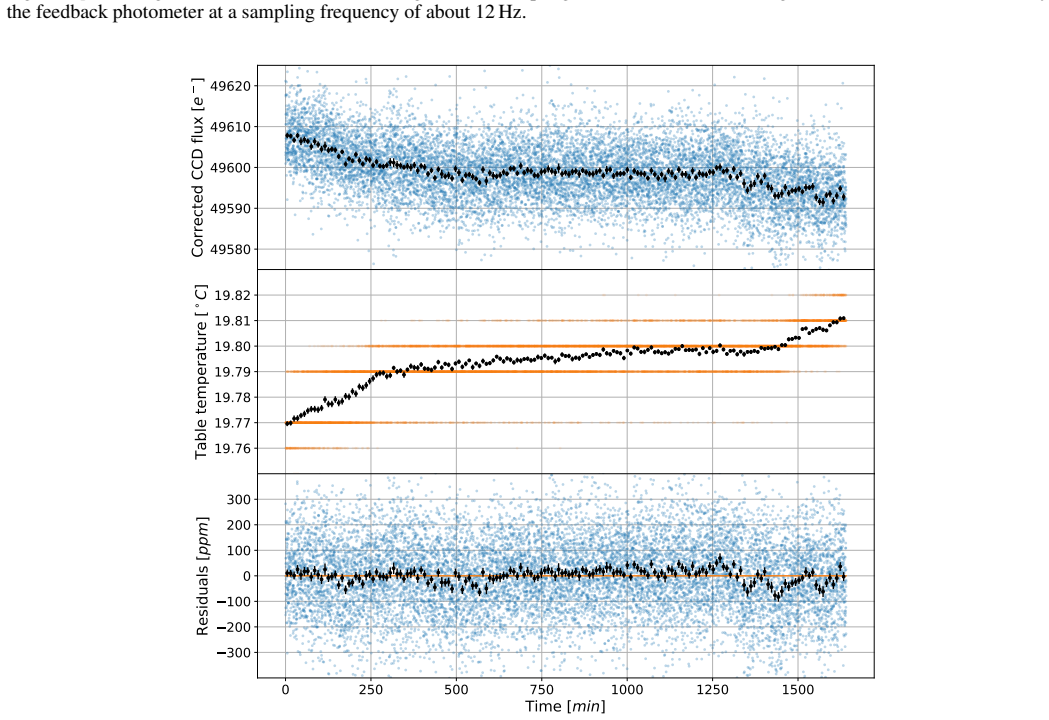
- [Sections 4.2.3 and 4.3] The temperature-flux decorrelation coefficient used to correct the light curve is fit to the same 27.35-hour dataset from which the 15 ppm stability is then measured, and Section 4.3 states that the assumption allowing the lamp-variation segments to be discarded could not be confirmed by a repeated measurement. This is an in-sample fit: the correction is not validated on independent data, so it may absorb part of the correlated noise and bias the reported floor low. The 15 ppm value should be presented as a conditional, bench-corrected lower limit with an explicit statement that no independent confirmation was obtained, or it should be supported by a validation subset left out of the fit. The current wording of the abstract ('on-ground photometric stability ... is found to be of the order of 15 parts per million') does not convey this caveat.
- [Section 5.3 vs Section 4.3] The simulated residual noise for the Earth-size case is 10.2 ppm over 6 h, which is below the ground-measured stability of 15 ppm over 5 h (full-frame, after discarding lamp variations) and 20 ppm in the 8x8 sub-aperture extraction. The paper does not explain how the in-flight simulation yields a lower noise than the ground-calibrated floor. If the ground floor is dominated by bench effects that are absent in orbit, that should be stated explicitly; otherwise the simulator appears to omit a correlated-noise component that the ground data show is present. This discrepancy is load-bearing for the credibility of the simulated precision numbers and should be addressed directly.
minor comments (6)
- [Abstract] The phrase 'by mean of end-to-end simulation' should read 'by means of end-to-end simulation.'
- [Table 1] In Case 2, the planet radius is typeset as '1 RÈ', which appears to be a LaTeX error; the text states a Neptune-size planet, so the value should be specified in Earth radii or equivalent.
- [Section 5.1.2] The sentence 'the three-dimension nature of the atmospheres has been taken into account' should read 'the three-dimensional nature of the atmospheres.'
- [Figure 10 caption] The caption contains a typo: 'obliqblack dashed line' should be 'oblique black dashed line.'
- [Section 4.3] The noise formula using 'ne−' is ambiguous; define the symbol as the total number of electrons in the photometric aperture, not the per-pixel electron count.
- [Section 6] The conclusion states that the results 'cover all the effects related to the instrument' but then lists in-orbit effects expected to have marginal impact; a sentence reconciling the simulated 10.2 ppm with the measured 15 ppm floor would help the reader interpret the headline numbers.
Circularity Check
No significant circularity: the central predicted precisions come from an independent end-to-end simulation; only the ground-calibration 15 ppm floor is an in-sample residual after a fitted temperature de-correlation.
-
fitted input called prediction
[Section 4.2.3 and Section 4.3 (Fig. 8 and Fig. 9)]
"We found that, when the temperature measurement is averaged over 10-minute durations, the error due to the limited resolution of the PT100 cancelled out and the linear coefficient converges to −347 e−/°C (see Fig. 8). To decorrelate the flux from the measured temperature variations, we used this correlation parameter and correct each photometric data point with its instantaneous temperature measurement. ... the variation of the data Allan variance may be modelled using a white noise model and a noise floor of 15 ppm."
The 15 ppm noise floor is reported after applying a temperature-correction coefficient that was estimated from the same 27.35 h calibration sequence. Fitting the coefficient to that dataset removes temperature-correlated signal in-sample, so the quoted Allan-variance floor is an in-sample residual rather than an out-of-sample prediction of instrument stability. This is a standard de-trending step and does not feed into the separate end-to-end simulation, so it is minor; the 15 ppm figure should be read as a calibrated characterization of that dataset, not as a fully independent measurement.
full rationale
The paper's central quantitative claims are the ground-calibration stability (~15 ppm over 5 h) and the end-to-end simulated precisions of 2% on Rp/R* for a Neptune-size planet transiting a K-dwarf and 5% for an Earth-size planet around a Sun-like star. The latter claims come from a forward model: CHEOPSim generates images using calibration-derived detector/optical parameters (bias, dark, gain, non-linearity, flat field, PSF, jitter, background) and an independent aperture-photometry plus MCMC transit fit recovers the parameters. The quoted residuals (10.2 ppm and 51.7 ppm) are compared with photon-noise expectations and are not obtained by inverting the simulation inputs, so there is no definitional circularity. The only mild in-sample element is the temperature de-correlation used before quoting the 15 ppm floor: the coefficient -347 e-/C is fit to the same 27.35 h sequence and applied to that same sequence. This is a common de-trending procedure and does not propagate into the simulated precision numbers; indeed the simulated Earth residual (10.2 ppm) is below the measured floor, so the 5% claim is not forced by the 15 ppm number. The omission of stellar spots/granulation (Table 1 and 'Stellar photosphere effects, like spots or granulation, were not considered' in Section 5.1.2) and of cosmic rays/smearing is a completeness or correctness limitation of the projection, not a circularity: it makes the quoted Earth-size precision an instrument-plus-photon-noise bound rather than a full astrophysical prediction, but the derivation chain itself is self-contained. No uniqueness theorem is invoked, and the CHEOPSim/DRP companion-paper citations are not used to forbid alternatives. Overall circularity is therefore low: score 2.
Assumptions & free parameters
free parameters (4)
- Temperature-flux correlation coefficient =
-347 e-/oC
- Time delay between CCD and photometer =
13.24 s
- Noise floor threshold =
15 ppm
- Photometric aperture radius =
33 pixels
assumptions (4)
- ad hoc to paper Linear relation between optical-table temperature and detected flux fully captures the bench-induced systematic after the feedback-fibre effect.
- domain assumption The ground-measured PSF and detector parameters are representative of in-flight behavior.
- domain assumption Stellar granulation, activity, cosmic rays, and smearing can be omitted from the simulation.
- standard math Standard statistical tools (Allan variance, MCMC/emcee, batman limb-darkening) are valid.
Cite this review
Pith. "Pith review of Expected performances of the Characterising Exoplanet Satellite (CHEOPS). I. Photometric performances from ground-based calibration." pith.science (2026). https://pith.science/paper/2UAJ6PVS
@misc{pith2026190801636,
  author       = {Pith},
  title        = {Pith review of: Expected performances of the Characterising Exoplanet Satellite (CHEOPS). I. Photometric performances from ground-based calibration},
  year         = {2026},
  howpublished = {\url{https://pith.science/paper/2UAJ6PVS}},
  note         = {Machine review of arXiv:1908.01636}
}
read the original abstract
The Characterising Exoplanet Satellite (CHEOPS) is a space mission designed to perform photometric observations of bright stars to obtain precise radii measurements of transiting planets. The high-precision photometry of CHEOPS relies on careful on-ground calibration of its payload. For that purpose, intensive pre-launch campaigns of measurements were carried out to calibrate the instrument and characterise its photometric performances. We report on main results of these campaigns, provide a complete analysis of data sets and estimate in-flight photometric performance by mean of end-to-end simulation. The on-ground photometric stability of the instrument is found to be of the order of 15 parts per million over 5 hours. Our end-to-end simulation shows that measurements of planet-to-star radii ratio with CHEOPS can be determined with a precision of 2% for a Neptune-size planet transiting a K-dwarf star and 5% for an Earth-size planet orbiting a Sun-like star. It corresponds to signal-to-noise ratios on the transit depths of 25 and 10 respectively, allowing the characterisation and detection of these planets. The pre-launch CHEOPS performances are shown to be compliant with the mission requirements.
Figures


Figures from the paper (9 more)





Reference graph
Works this paper leans on
-
[1]
J., Koch, D., Basri, G., et al
Borucki, W. J., Koch, D., Basri, G., et al. 2010, Science, 327, 977
2010
-
[2]
2013, in European Physical Journal Web of Conferences, V ol
Broeg, C., Fortier, A., Ehrenreich, D., et al. 2013, in European Physical Journal Web of Conferences, V ol. 47, 03005
work page 2013
-
[3]
Charbonneau, D., Brown, T. M., Latham, D. W., & Mayor, M. 2000, ApJ, 529, L45
work page 2000
-
[4]
2017, in Society of Photo- Optical Instrumentation Engineers (SPIE) Conference Series, V ol
Deline, A., Sordet, M., Wildi, F., & Chazelas, B. 2017, in Society of Photo- Optical Instrumentation Engineers (SPIE) Conference Series, V ol. 10562, 105624E
work page 2017
-
[5]
2016, The Journal of Open Source Software, 24
Foreman-Mackey, D. 2016, The Journal of Open Source Software, 24
2016
-
[6]
Foreman-Mackey, D., Hogg, D. W., Lang, D., & Goodman, J. 2013, PASP, 125, 306 Article number, page 11 of 12 A&A proofs: manuscript no. paper
work page 2013
-
[7]
2014, in Space Telescopes and Instrumen- tation 2014: Optical, Infrared, and Millimeter Wave, V ol
Fortier, A., Beck, T., Benz, W., et al. 2014, in Space Telescopes and Instrumen- tation 2014: Optical, Infrared, and Millimeter Wave, V ol. 9143, 91432J
work page 2014
-
[8]
2019, A&A, (in press) Gaia Collaboration, Prusti, T., de Bruijne, J
Futyan, D., Fortier, A., Beck, M., et al. 2019, A&A, (in press) Gaia Collaboration, Prusti, T., de Bruijne, J. H. J., et al. 2016, A&A, 595, A1 Gandolfi, D., Barragán, O., Livingston, J. H., et al. 2018, A&A, 619, L10
work page 2019
Show all 20 references
-
[9]
W., Marcy, G
Henry, G. W., Marcy, G. W., Butler, R. P., & V ogt, S. S. 2000, ApJ, 529, L41
2000
-
[10]
2019, A&A, (in press)
Hoyer, S., Guterman, P., Demangeon, O., et al. 2019, A&A, (in press)
2019
-
[11]
Kipping, D. M. 2013, MNRAS, 435, 2152
2013
-
[12]
G., Borucki, W., Webster, L., et al
Koch, D. G., Borucki, W., Webster, L., et al. 1998, in Space Telescopes and Instruments V , ed. P. Y . Bely & J. B. Breckinridge, V ol. 3356, 599–607
1998
-
[13]
2015, Publications of the Astronomical Society of the Pacific, 127, 1161 Maíz Apellániz, J
Kreidberg, L. 2015, Publications of the Astronomical Society of the Pacific, 127, 1161 Maíz Apellániz, J. & Weiler, M. 2018, A&A, 619, A180
2015
-
[14]
T., García, C
Moraleda, A. T., García, C. V ., Zaballa, J. Z., & Arrue, J. 2013, Sensors (Basel), 13, 13076
2013
-
[15]
L., Skillen, I., Collier Cameron, A., et al
Pollacco, D. L., Skillen, I., Collier Cameron, A., et al. 2006, PASP, 118, 1407
2006
-
[16]
R., Winn, J
Ricker, G. R., Winn, J. N., Vanderspek, R., et al. 2015, Journal of Astronomical
2015
-
[17]
2019, A&A, 622, L7 Van Cleve, J
Trifonov, T., Rybizki, J., & Kürster, M. 2019, A&A, 622, L7 Van Cleve, J. E. & Caldwell, D. A. 2016, Kepler Instrument Handbook, Tech. rep
2019
-
[18]
2019, AJ, 157, 51
Wang, S., Jones, M., Shporer, A., et al. 2019, AJ, 157, 51
2019
-
[19]
2014, Chinese Physics B, 23, 034201
Wang, Z.-Y ., Qiu, Q., & Shi, S.-J. 2014, Chinese Physics B, 23, 034201
2014
-
[20]
Winn, J. N. 2010, Exoplanet Transits and Occultations, ed. S. Seager, 55–77 Article number, page 12 of 12
2010
Reviewed August 14, 2026 · model on record in the stance chip above.
Discussion (0). Continue with ORCID to comment.