REVIEW 4 major objections 6 minor 2 references
An Enhanced "Flux-Corrected Transport"-Based Plasmasphere Refilling Model
T0 review · 4 major / 6 minor · reviewed 2026-08-03 · deepseek-v4-flash
Pith's one-line read Replacing the constant-temperature assumption with self-consistent electron temperatures in a multi-ion plasmasphere refilling model produces the observed two-stage refilling behavior.
desk verdict A solid, clearly-written model extension that deserves referee time, but the central claim that temperature variability produces two-stage refilling is untested because the paper never runs a constant-temperature control in the same code. read the letter →
The pith
A machine-rendered reading of the paper's core claim, the machinery that carries it, and where it could break.
The reading
What carries the argument
The central mechanism is the coupled system of a one-dimensional electron heat conduction equation (with thermal conductivity depending on temperature and density) and the generalized ambipolar electric field E∥ = -(1/(e n_e)) ∂/∂s (n_e k T_e). The temperature from the energy equation is fed into the ambipolar field at each time step, so the pressure gradient that drives ion transport includes both density and temperature gradients. This is what lets the model capture the stage transition and the H+/He+ coupling that a density-only pressure gradient cannot produce.
What would settle it
Run the enhanced model with electron temperature held fixed at the initial uniform value (a constant-T control) and compare the equatorial H+ concentration time series; if a two-stage signature still appears, the paper's central attribution fails. Alternatively, a satellite pass through a refilling flux tube within the first hour should measure the predicted roughly 1500 K temperature difference between the equator and mid-latitudes; absence of such a gradient would contradict the mechanism.
Extended reading notes
Core claim
The central claim is that solving the electron heat conduction equation along the flux tube, rather than assuming a fixed temperature, is necessary to reproduce the observed two-stage refilling process. The new temperature-dependent ambipolar field E∥ = -(1/(e n_e)) ∂/∂s (n_e k T_e) couples density and thermal gradients, leading to stronger early-time ion acceleration and a transition between stages that hinges on the evolving temperature structure. The model shows H+ dominating throughout, an early peak in O+, and a simultaneous H+ minimum and He+ maximum at the transition, which the authors interpret as the ambipolar field compensating for the charge deficit from H+ loss. Refilling rates o
Load-bearing premise
The claim that self-consistent temperature is the cause of two-stage refilling assumes that the earlier constant-temperature model is a faithful comparison baseline; the paper does not run a constant-temperature control with the current code, so other numerical or coupling differences could also explain the new behavior.
Editorial extensions
If this is right
- Two-stage refilling, with a sharp transition from about 90 to 680 cm^-3 day^-1 at L=4, emerges only when temperature varies along the flux tube.
- The ambipolar field couples H+ and He+ at the stage transition: a dip in H+ coincides with a peak in He+ fraction, maintaining quasi-neutrality.
- Early-time O+ enhancement is explained by the pressure-gradient and electric-field forces outweighing gravity when refilling begins.
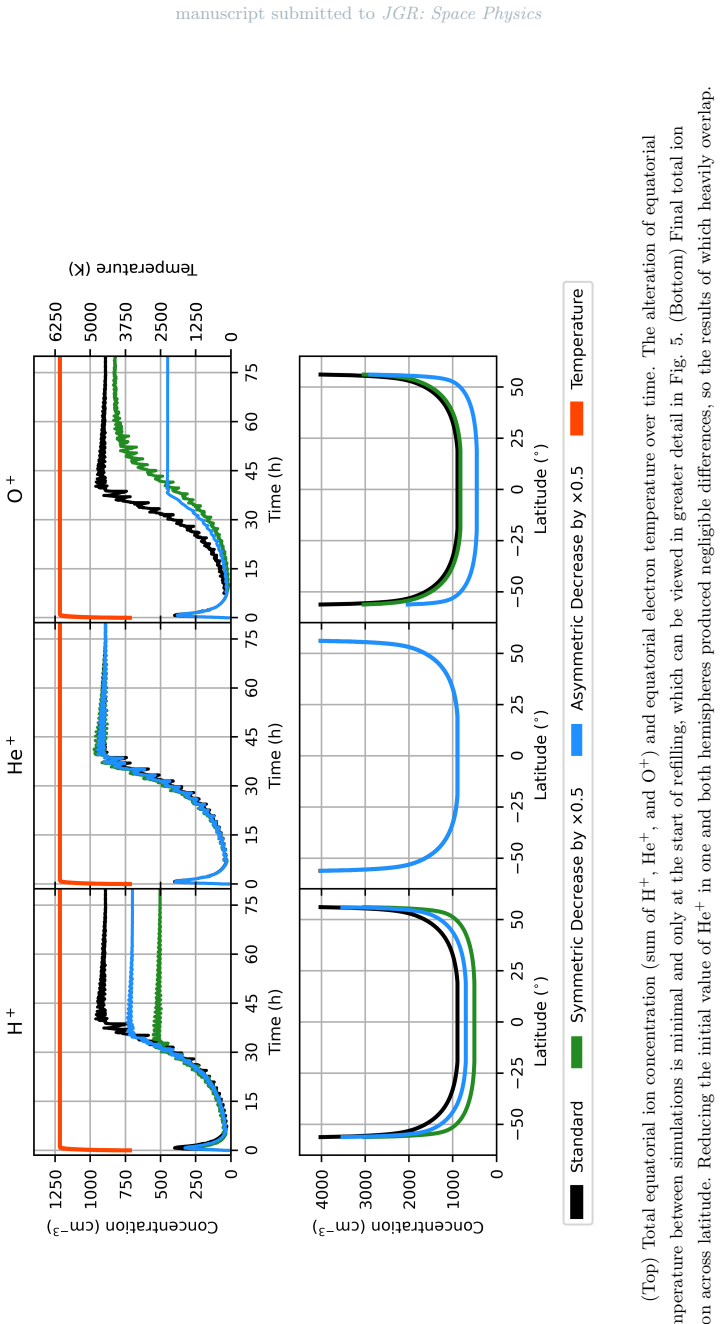
- Changing the initial H+ concentration controls the timing and saturation level of late-time refilling, while O+ asymmetries (seasonal) alter the late-stage trajectory.
- Shorter L-shells compress both refilling stages and raise equilibrium concentrations.
Reading between the lines
- Because the temperature reaches an approximate equilibrium within the first hour while refilling continues for over a day, a testable prediction is that the stage transition is set by the early thermal structure and later density evolution; observations of electron temperature early in refilling could confirm the predicted roughly 1500 K equator-to-midlatitude gradient.
- The paper's attribution to temperature variability could be isolated by running the same code with T_e held constant; if two-stage refilling disappears, the claim is verified.
- The asymmetric O+ sensitivity hints that seasonal hemispheric asymmetries in the topside ionosphere should modulate refilling rates; this could be tested against refilling events with known solstice conditions.
- If the ambipolar field mechanism is correct, electron temperature measurements along a refilling flux tube should show the gradient that drives the H+/He+ exchange; this is a direct observable for future missions.
Editorial analysis
A structured set of objections, weighed in public.
Referee Report
Summary. The manuscript extends the multi-ion, two-stream Flux-Corrected Transport (FCT) hydrodynamic plasmasphere refilling model of Chatterjee and Schunk (2019, 2020a) by solving the electron energy equation (Eq. 1) so that electron temperature varies self-consistently in space and time. The ambipolar electric field is generalized to include temperature gradients (Eq. 3). The paper reports that this extension produces two-stage refilling behavior (early slow refilling followed by a late rapid refilling phase), with H+ dominating the total density, an early O+ enhancement, and an H+/He+ anticorrelation at the stage transition. Sensitivity tests modify initial H+, He+, and O+ concentrations, and an L-shell comparison between L=4 and L=3 is presented. The central claim is that spatiotemporally varying temperature is necessary to reproduce two-stage refilling, which the earlier constant-temperature model could not capture.
Significance. If the central claim is substantiated, the paper offers a physically plausible mechanism — temperature-gradient-driven ambipolar fields — connecting electron thermal structure to the two-stage refilling phenomenology, and it provides a natural upgrade path for FCT-based plasmasphere models. The manuscript is clearly written, the model extension is straightforward, and the data are made publicly available. However, the article's novelty rests on a causal attribution that is not directly tested: no constant-temperature control is run within the present code. The qualitative comparison to an earlier separate code cannot exclude numerical or configurational differences as the source of the two-stage signature. Strengths of the paper include the self-consistent coupling procedure, the modular description of the energy equation, and the honest enumeration of model limitations in Section 4.5. The scientific value is contingent on closing the control-experiment gap and reporting the missing input parameters.
major comments (4)
- [§3.2, §4.2, Conclusions] The central claim — that two-stage refilling 'could not be captured under the assumption of a constant temperature along the flux tube' — is not supported by a control experiment. No simulation is shown in which the present code is run with Te held constant in space and time; the comparison is only to the separate model of Chatterjee and Schunk (2019). Differences in grid, boundary conditions, time stepping, or ionospheric inputs could produce the transition. Moreover, Fig. 2 shows that the temperature profile approaches equilibrium within ~60 min, while the stage transition occurs at ~7 h (Fig. 3). This timing makes it especially important to distinguish the effect of a persistent mean gradient from the effect of time variability. The manuscript should present a same-code constant-T run, or explicitly state why this control is not possible, before claiming causality.
- [§2.4, §3] The electron heating rate Qe is described as 'held constant in space and time for each simulation' but its numerical value is never reported. Similarly, the initial peak ion concentrations for H+, He+, and O+ are set 'manually' (Fig. 1 caption) but no values are given in the text or figure. These are free parameters of the model, and the reported refilling rates and temperature evolution depend directly on them. Without reporting Qe and the initial density peaks, the simulations cannot be reproduced or quantitatively compared with observations or other models. Please provide the exact values used in all figures.
- [§2.1] The model assumes ion temperature equals electron temperature for all ion species (Ti = Te) with no justification or sensitivity analysis. Since the ambipolar electric field and the ion pressure gradients enter the momentum equations, the choice of Ti directly affects the early-time acceleration of H+, He+, and O+. Early in refilling, the ion velocity distributions are likely non-Maxwellian (as acknowledged in §4.5), and the collisional energy exchange between ions and electrons is weak at low densities. The authors should either justify Ti = Te from the relevant time scales or run a sensitivity test with Ti treated separately or held at a different value.
- [§3.2, §4.1] The validation is qualitative: the manuscript states that the two-stage behavior is 'consistent with' prior models and observations, but it does not provide a quantitative comparison of the simulated equatorial density evolution or refilling rates against, e.g., LANL MPA or Van Allen Probe refilling-rate statistics. The paper reports early- and late-time refilling rates of 90.0 and 680 cm^-3 day^-1 (Fig. 3), yet no observational or prior-model numbers are quoted for comparison. A quantitative validation plot or table would substantially strengthen the claim that the model reproduces observed two-stage refilling.
minor comments (6)
- [§2.2, Eq. (3)] The equation E_parallel(s) is written with a three-dimensional gradient symbol ∇(n_e k T_e); since this is a field-aligned 1D model, use ∂/∂s consistently. Also, the notation 'k' for Boltzmann's constant should be defined or identified.
- [§2.1, Eq. (2)] The denominator of Ke, written as n_e * sum_j N_j Q_j, mixes units: define N_j (neutral density) and Q_j (momentum transfer cross section) explicitly. As written, the equation is dimensionally opaque.
- [Fig. 1] The x- and y-axes are not labeled with numeric values; 'initial concentrations' are described in relative terms only. Add a colorbar or axis annotations so the reader can see the actual density scales.
- [§3.1] Typo: 'dynamicism' should be 'dynamics' or 'dynamical behavior'.
- [Fig. 4] The overlapping He+ curves are difficult to distinguish, as the caption admits they 'heavily overlap.' Consider separate panels or an inset zoom for the relevant time interval.
- [Open Research] The data link is appreciated. It would be helpful to also provide the exact parameter file (Qe, grid spacing, time step, initial density profiles) so that the reported results are reproducible.
Circularity Check
Constant-temperature counterfactual not run in the present code; the causal claim that temperature variability is necessary for two-stage refilling rests on a self-authored prior result.
-
self citation load bearing
[Section 3.2 ('Influence of Temperature Variability on Refilling'); echoed in Conclusions]
"Comparing each ion's equatorial concentration over time in Fig. 3 reveals evidence of two-stage refilling ... which was not detectable when ignoring temperature fluctuations across space and time (Chatterjee & Schunk, 2019)."
The paper's central novelty claim—that spatiotemporally varying electron temperature is necessary to reproduce two-stage refilling—is supported only by contrasting the new simulation with a prior constant-temperature model (Chatterjee & Schunk, 2019), which shares an author and is not re-run as a control in the present code. No constant-T simulation is performed in the same numerical framework, so the causal attribution to temperature variability is not demonstrated within this paper; it reduces to the self-cited earlier result. The Conclusions repeat the claim as 'self-consistent temperatures are ... necessary to accurately reproduce the two-stage process,' but the in-paper evidence only shows that a variable-T run exhibits two-stage behavior, not that a constant-T run in the same code wo
full rationale
The mathematical core of the model is self-contained: Eq. (1) solves a standard electron-energy equation, Eq. (3) generalizes the ambipolar field to include temperature gradients, and the coupled system is advanced without fitting a parameter to the two-stage signature. The observed two-stage behavior is an emergent output of the variable-T model, not a fitted input. However, the load-bearing comparative claim—that constant temperature cannot capture two-stage refilling—relies entirely on the authors' earlier code and is not tested as a constant-T control here. That is a self-citation used to justify the paper's central causal claim, so a moderate circularity score is appropriate. Other potential weaknesses (e.g., temperature reaching near-equilibrium by 60 min while the stage transition occurs near 7 h) are scientific/causal concerns rather than circularity and are not scored here. No additional fitted-input or definitional circularity is present.
Assumptions & free parameters
free parameters (4)
- Initial peak ion concentrations (H+, He+, O+) per hemisphere =
Not stated numerically (set manually in Fig. 1)
- Electron heating rate Qe =
Not stated in text
- Initial/boundary electron temperature T0 =
3560 K
- Magnetic L-shell =
L=4 standard; L=3 for comparison
assumptions (6)
- domain assumption Quasi-neutrality: electron density n_e equals sum of ion densities
- domain assumption Electron heat conduction equation with no radiative or inelastic loss terms applies at plasmaspheric altitudes
- domain assumption All ion species have temperature equal to local electron temperature (T_i = T_e)
- domain assumption Hydrodynamic/Maxwellian velocity distributions hold throughout early refilling
- domain assumption Boundary electron temperatures are fixed at the initial value
- standard math FCT numerical scheme and Crank-Nicolson time stepping accurately solve the coupled equations
Cite this review
Pith. "Pith review of An Enhanced "Flux-Corrected Transport"-Based Plasmasphere Refilling Model." pith.science (2026). https://pith.science/paper/3BPK5OX5
@misc{pith2026251221342,
  author       = {Pith},
  title        = {Pith review of: An Enhanced "Flux-Corrected Transport"-Based Plasmasphere Refilling Model},
  year         = {2026},
  howpublished = {\url{https://pith.science/paper/3BPK5OX5}},
  note         = {Machine review of arXiv:2512.21342}
}
read the original abstract
A previously developed multi-ion, two-stream Flux-Corrected Transport (FCT) hydrodynamic model for plasmasphere refilling has been extended to incorporate self-consistent electron temperature evolution. The past assumption of a constant temperature along the modeled flux tube has been replaced by solving the electron energy equation, permitting spatially and temporally varying temperature. This improvement provides a more physically complete representation of the pressure and ambipolar electric-field gradients that influence ion transport. The extended model allows us to investigate two-stage refilling behavior established by prior observations and simulations. The model continues to reproduce the expected dominance of H+, enhanced early-time O+ contributions, and the coupling between H+ and He+ through the ambipolar electric field during the transition between stages. Sensitivity experiments with modified initial ion concentrations, including cases representing seasonal effects, highlight the distinct roles of each ion species in shaping the refilling trajectory. Comparisons across L-shells 3 and 4 further confirm the robustness of the model framework for future extension to three-dimensional geometries. Overall, by incorporating more realistic temperature variations, this enhanced model strengthens the physical understanding for interpreting complex multi-ion transport processes during plasmasphere recovery following geomagnetic storms.
Figures


Figures from the paper (3 more)


Reference graph
Works this paper leans on
-
[377]
doi: 10.1016/j.jastp.2006.06.019 Nos´ e, M., Matsuoka, A., Kumamoto, A., Kasahara, Y., Goldstein, J., Teramoto, M., . . . MacDowall, R. J. (2018, October). Longitudinal Structure of Oxygen Torus in the Inner Magnetosphere: Simultaneous Observations by Arase and Van Allen Probe A.Geophysical Research Letters,45(19). doi: 10.1029/2018GL080122 Pezzopane, M.,...
-
[1918]
doi: 10.1029/92GL01940 Krall, J., & Huba, J. D. (2013, June). SAMI3 simulation of plasmasphere refilling. Geophysical Research Letters,40(11), 2484–2488. doi: 10.1002/grl.50458 Lawrence, D. J., Thomsen, M. F., Borovsky, J. E., & McComas, D. J. (1999, July). Measurements of early and late time plasmasphere refilling as observed from geosynchronous orbit.Jo...
Reviewed August 3, 2026 · model on record in the stance chip above.
Discussion (0). Sign in to comment.