REVIEW 4 major objections 3 minor 1 cited by
Understanding GEMM Performance and Energy on NVIDIA Ada Lovelace: A Machine Learning-Based Analytical Approach
T0 review · 4 major / 3 minor · reviewed 2026-08-12 · deepseek-v4-flash
Pith's one-line read This paper claims that a single Random Forest multi-output model can predict GEMM runtime and power on an NVIDIA RTX 4070 from configuration features alone, reporting $R^2 = 0.98$ for runtime and $R^2 = 0.78$ for power on CUTLASS SGEMM…
desk verdict A useful profiling dataset and a plausible 16x16 tile-size result, but the headline R² numbers belong to an undefined stacking ensemble, not the Random Forest the paper describes. read the letter →
The pith
A machine-rendered reading of the paper's core claim, the machinery that carries it, and where it could break.
The reading
What carries the argument
The namable machinery is the stacked multi-output regression pipeline: numerical features are standardized and fed to a Random Forest regressor with 100 trees and maximum depth 6, wrapped to predict runtime, power, energy, and TFLOPS together from a single feature set. The second object is the hand-written tiled GEMM kernel, run with tile sizes 1 through 32, which isolates the shared-memory and occupancy effects that the CUTLASS sweep cannot vary independently. The features include matrix dimensions, derived arithmetic intensity, block sizes, layouts, and alpha-beta scalars, so the model sees the configuration knobs a developer can actually tune.
What would settle it
Run the same 16,128 CUTLASS SGEMM configurations on an idle, dedicated RTX 4070 with kernel-scoped power sampling (for example, NCU or an external power meter) and compare measured per-kernel power against the model's predictions; if the power $R^2$ does not stay near 0.78 or the runtime mean error exceeds the reported 15.57%, the central accuracy claim is refuted.
Extended reading notes
Core claim
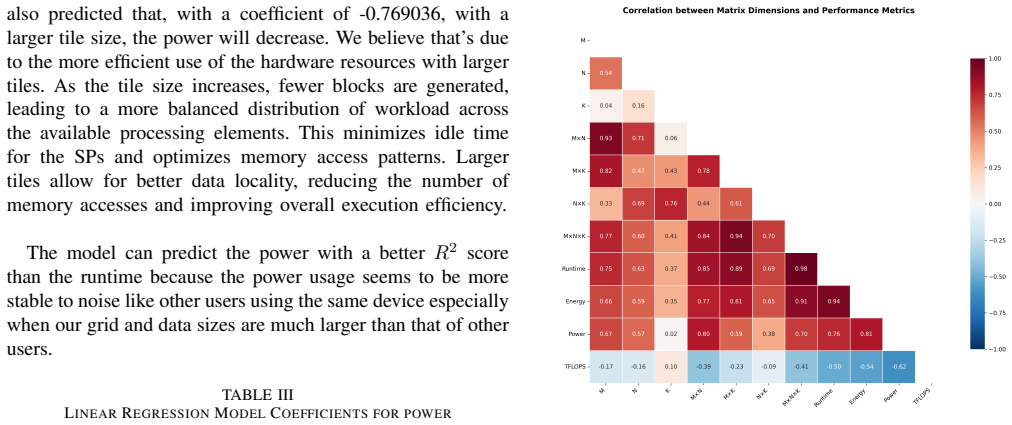
On its own terms, the paper establishes that a multi-output Random Forest regressor trained on CUTLASS profiler output can capture GEMM behavior on Ada Lovelace hardware: runtime tracks total computational volume ($r=0.98$ with $M \times N \times K$), power tracks the output matrix size more than the contraction dimension ($r=0.80$ with $M \times N$ versus $r=0.02$ with $K$), and a tile size of $16 \times 16$ gives the best shared-memory and occupancy trade-off. The measured model beats individual Random Forest and XGBoost baselines and a linear regression baseline on all targets, and the paper reports fitted relationships including $Runtime_{pred} = 0.97 \cdot Runtime_{actual} + 1.23$. The account also identifies the resource ceiling: moving from tile 16 to tile 32 drops active blocks per SM from 6 to 1 because shared-memory demand scales with tile area.
Load-bearing premise
The power labels are treated as accurate per-kernel readings even though they come from nvidia-smi on a shared machine, so activity from other users can contaminate the power measurements that the $R^2 = 0.78$ claim rests on.
Editorial extensions
If this is right
- On the paper's reported results, a developer on RTX 4070-class hardware can query the trained model for unseen GEMM shapes and get runtime predictions with mean error around 15.6% without running the kernel.
- Power-aware GEMM scheduling should weight output-matrix dimensions more heavily than contraction depth, since power correlates with $M \times N$ at 0.80 and with $K$ at only 0.02.
- A tile size of $16 \times 16$ is a practical default for SIMT SGEMM kernels on this architecture: it gives the best runtime and power balance before shared-memory occupancy collapses from 24 to 6 active blocks per SM.
- Ensemble stacking over Random Forest and XGBoost is worth the overhead, improving runtime $R^2$ from 0.9623 (XGBoost) to 0.9808.
- Energy predictions inherit error from both runtime and power targets, so energy-aware use of the model should not treat its 43% mean energy error as precise.
Reading between the lines
- Because the dataset comes from a single RTX 4070, the model's transfer to other Ada or Hopper GPUs is untested; if the same features generalize without retraining, it would become a cheap cross-architecture predictor.
- The power labels come from nvidia-smi on a shared machine, so the 5.42% median power error likely understates the error for kernel-only power; an isolated measurement would be a stronger test of the power claim.
- The $16 \times 16$ tile conclusion is drawn from a SIMT SGEMM kernel and may not carry over to tensor-core or split-K GEMM variants, where shared-memory and register pressure behave differently.
- A natural next step would be to train the same pipeline on tensor-core GEMMs and on multiple GPU generations and report per-architecture error, separating hardware-specific effects from configuration effects.
Signed reviews
Editorial analysis
A structured set of objections, weighed in public.
Referee Report
Summary. The paper proposes an analytical/machine-learning framework for predicting GEMM kernel runtime, power consumption, and energy efficiency on an NVIDIA RTX 4070 (Ada Lovelace). It combines a custom tiled matrix multiplication kernel, CUTLASS-based profiling of 16,128 configurations, and a multi-output Random Forest regressor. The authors report R² scores of 0.9808 for runtime and 0.7783 for power, and claim that tile size 16×16 provides the best balance, with up to 3.2× performance improvement and 22% power reduction. The paper also analyzes SM occupancy and correlation patterns between matrix dimensions and performance metrics.
Significance. The paper's practical contribution includes a large GEMM profiling dataset, an open-source implementation (GPPerf), and a systematic analysis of tile-size effects on performance and power on a modern consumer GPU. If the reported accuracy could be attributed to the described model, the result would be a useful empirical predictor for GEMM configuration selection. However, in the current manuscript, the central claim is not reproducible: the headline R² values are assigned to a stacking ensemble that is never specified, while the only described model (Random Forest, Algorithm 2) shows lower values (0.9456 runtime, 0.7234 power). The dataset split arithmetic is inconsistent, and the power measurements are acknowledged to be noisy due to shared-machine use. These problems must be resolved before the paper's findings can be considered reliable.
major comments (4)
- [Abstract / §III-C / §IV-C4 / Table VI / Algorithm 2] The paper's headline accuracy numbers (R²=0.98 for runtime, 0.78 for power) are attributed in Table VI to a 'Stacking Ensemble,' but the only model construction described (Algorithm 2) is a MultiOutputRegressor wrapping RandomForestRegressor. Section IV-C4 mentions a 'stacked model approach' but provides no base learners, meta-learner, or weights, and it is not reconciled with Algorithm 2. As a result, the abstract's central claim is not traceable to the model specified in the paper, and the reported results cannot be reproduced or even attributed. The authors must either describe the stacking ensemble in full (including algorithms, hyperparameters, and code) or revise the abstract and tables to report the Random Forest results actually supported by the methodology.
- [§V-B] Section V-B states that the dataset comprised 16,128 samples, split into 2,076 training samples and 519 test samples. Since 2,076 + 519 = 2,595, these numbers are inconsistent. The discrepancy is load-bearing because the evaluation set is undefined; the R² values in Table IV cannot be interpreted without knowing the exact split and whether the 16,128 figure includes pre-processing steps such as outlier removal.
- [§V-A2] The power measurements used to train and evaluate the model were collected via nvidia-smi on a shared machine, and Section V-A2 states that power usage is 'more stable to noise like other users using the same device.' This admission indicates that the power labels may include contributions from other processes, which directly affects the validity of the R²=0.7783 power prediction claim. The authors should either isolate the GPU or clearly quantify the noise contribution and report error bars on the power predictions.
- [§III-C and §V-B3] Equations (1)-(3) present the relationships as Runtime_pred = α·Runtime_actual + β + ε, Power_pred = f(...) ± ε_power, and Energy_pred = Runtime_pred · Power_pred · γ, but these are not analytical models derived from first principles; they are empirical fits to the collected data. The abstract and Section III-C call the framework 'analytical' and present the coefficients α, β, and γ as if they were derived, when in fact they are fitted parameters of a regression. This framing overstates the theoretical contribution. Please revise the terminology to accurately describe the method as a machine-learning-based empirical model.
minor comments (3)
- [§V-B3(a) and §V-B3(b)] In Section V-B3(a), the runtime prediction plot is referred to as 'Figure 6' but the actual figure is Figure 7; similarly, in Section V-B3(b), the power prediction graph is called 'Figure 7' but it is Figure 8. Please correct the cross-references.
- [§V-A1] In Section V-A1, the phrase 'after tile size researches 16' should be 'reaches 16.'
- [§V-B3(c)] In Equation (3), the energy prediction is written as Energy_pred = Runtime_pred · Power_pred · γ, but if the units are compatible, multiplying runtime and power already gives energy; the role of γ as an empirical correction factor should be explained.
Circularity Check
No load-bearing circularity: the headline runtime/power numbers are out-of-sample ML evaluations, not derivations; only the energy 'prediction' equation is a fitted rescaling of the product of the other two predictions.
-
fitted input called prediction
[Section V-B3c, Eq. (3); contrast with Section IV-C3]
"Energy pred = Runtimepred · Powerpred · γ + ϵenergy (3) where γ represents the energy efficiency coefficient."
Section IV-C3 defines Energy as Power × Runtime. Hence Eq. (3) is not an independent energy prediction: it is the product of the runtime and power predictions multiplied by an unexplained free constant γ (and an error term), so any reported energy R² is inherited from the two fitted targets rather than derived. This is a minor framing issue; the headline runtime/power claims are test-set evaluations of a fitted regression and are not circular.
full rationale
The central claim is empirical: a multi-output regression model is trained on GEMM configurations and evaluated on a held-out test split (Section IV-C4). That is the standard non-circular meaning of prediction, so the runtime R²=0.98 and power R²=0.78 values do not reduce to their inputs by construction. The paper's 'analytical' language and coefficient tables are interpretations of fits, not first-principles derivations. The only definitional circularity is the energy equation (Eq. 3), since energy is already defined as power × runtime and the equation just rescales the product of two predictions by an unexplained coefficient. Separate correctness concerns exist — the abstract's R² values match Table VI's 'Stacking Ensemble' row while Algorithm 2 describes a Random Forest, and the stated train/test counts (2,076 + 519) do not sum to the 16,128-sample dataset — but these are reproducibility and attribution problems, not circularity. The power measurements are acknowledged to be noisy due to shared-machine usage, which affects measurement validity, not circularity.
Assumptions & free parameters
free parameters (5)
- Random Forest hyperparameters (n_estimators, max_depth) =
n_estimators=100, max_depth=6
- Stacking ensemble weights w_i =
not reported
- Runtime regression coefficients α, β =
α=0.97, β=1.23
- Energy efficiency coefficient γ =
not reported
- Tiled-kernel linear regression coefficients (M,N,K,tile_size) =
-0.672907, 1.222868, 8.127956, -2588.457605 for runtime; 0.001255, 0.001584, 0.002479, -0.769036 for power
assumptions (3)
- domain assumption nvidia-smi power readings represent kernel power consumption on a shared machine
- domain assumption The profiled CUTLASS configurations are representative of the GEMM workloads being predicted
- domain assumption Roofline ridge point of 59 FLOPs/Byte from a vendor spec webpage
Cite this review
Pith. "Pith review of Understanding GEMM Performance and Energy on NVIDIA Ada Lovelace: A Machine Learning-Based Analytical Approach." pith.science (2026). https://pith.science/paper/3SZNAQKW
@misc{pith2026241116954,
  author       = {Pith},
  title        = {Pith review of: Understanding GEMM Performance and Energy on NVIDIA Ada Lovelace: A Machine Learning-Based Analytical Approach},
  year         = {2026},
  howpublished = {\url{https://pith.science/paper/3SZNAQKW}},
  note         = {Machine review of arXiv:2411.16954}
}
read the original abstract
Analytical framework for predicting General Matrix Multiplication (GEMM) performance on modern GPUs, focusing on runtime, power consumption, and energy efficiency. Our study employs two approaches: a custom-implemented tiled matrix multiplication kernel for fundamental analysis, and NVIDIA's CUTLASS library for comprehensive performance data collection across advanced configurations. Using the NVIDIA RTX 4070 as our experimental platform, we developed a Random Forest-based prediction model with multi-output regression capability. Through analysis of both naive tiled matrix multiplication with varying tile sizes (1 to 32) and 16,128 CUTLASS GEMM operations across diverse configurations, we identified critical performance patterns related to matrix dimensions, thread block configurations, and memory access patterns. Our framework achieved exceptional accuracy with an R^2 score of 0.98 for runtime prediction (mean error 15.57%) and 0.78 for power prediction (median error 5.42%). The system successfully predicts performance across matrix sizes, demonstrating robust scaling behavior. Our results show that optimal tile size selection can improve performance by up to 3.2x while reducing power consumption by 22% compared to baseline configurations. Analysis of shared memory utilization and SM occupancy reveals that tile sizes of 16x16 achieve the best balance between parallelism and resource usage. The implementation of our framework, including prediction models and analysis tools, is available as an open-source project at GPPerf [https://github.com/pavlyhalim/GPPerf].
Figures


Figures from the paper (4 more)



Forward citations
Cited by 1 Pith paper
-
APT-LLM: Exploiting Arbitrary-Precision Tensor Core Computing for LLM Acceleration
A bit-sliced Tensor Core scheme with a bipolar integer encoding and adaptive kernel autotuning reports 1.65-3.99x speedups for ultra-low-bit GPTQ-quantized LLM inference on three NVIDIA GPUs.
Reference graph
Works this paper leans on
-
[1]
Performance-aware energy-efficient GPU frequency selection using DNN-based models,
G. Ali, M. Side, S. Bhalachandra, N. J. Wright, and Y . Chen, “Performance-aware energy-efficient GPU frequency selection using DNN-based models,” in International Conference on Parallel Process- ing. ACM, 2023
work page 2023
-
[2]
DSO: A GPU energy efficiency optimizer by fusing dynamic and static information,
Q. Wang et al., “DSO: A GPU energy efficiency optimizer by fusing dynamic and static information,” arXiv preprint, 2024
work page 2024
-
[3]
P. Czarnul, J. Proficz, and A. Krzywaniak, “Energy-aware high- performance computing: Survey of state-of-the-art tools, techniques, and environments,” Wiley Online Library, 2019
work page 2019
-
[4]
Energy-aware GPU performance prediction and optimization framework,
Various, “Energy-aware GPU performance prediction and optimization framework,” NYU, Tech. Rep., 2024
work page 2024
-
[5]
NVIDIA Corporation, “CUDA C++ programming guide,” Version 12.2, 2023
work page 2023
-
[6]
Performance prediction of GPU-based deep learning applications,
X. Wang, K. Huang, A. Knoll, and X. Qian, “Performance prediction of GPU-based deep learning applications,” in IEEE International Sym- posium on Performance Analysis of Systems and Software , 2018
work page 2018
-
[7]
A measurement study of GPU DVFS on energy conservation,
X. Mei, L. S. Yung, K. Zhao, and X. Chu, “A measurement study of GPU DVFS on energy conservation,” in HotPower, 2013
work page 2013
-
[8]
DVFS-aware application classification to improve GPGPUs energy efficiency,
J. Guerreiro, A. Ilic, N. Roma, and P. Tom ´as, “DVFS-aware application classification to improve GPGPUs energy efficiency,” Parallel Comput- ing, 2020
work page 2020
Show all 13 references
-
[9]
An analytical model for a GPU architecture with memory-level and thread-level parallelism awareness,
S. Hong and H. Kim, “An analytical model for a GPU architecture with memory-level and thread-level parallelism awareness,” ACM SIGARCH Computer Architecture News, vol. 37, no. 3, pp. 152–163, 2009
2009
-
[10]
A simple model for portable and fast prediction of execution time and power consumption of GPU kernels,
L. Braun, S. Nikas, C. Song, V . Heuveline, and H. Fr ¨oning, “A simple model for portable and fast prediction of execution time and power consumption of GPU kernels,” ACM Transactions on Architecture and Code Optimization, vol. 17, no. 4, pp. 1–25, 2020
2020
-
[11]
Sta- tistical power modeling of GPU kernels using performance counters,
H. Nagasaka, N. Maruyama, A. Nukada, T. Endo, and S. Matsuoka, “Sta- tistical power modeling of GPU kernels using performance counters,” in International Conference on Green Computing , 2010, pp. 115–122
2010
-
[12]
Predicting the energy consumption of CUDA kernels using SimGrid,
D. Boughzala, L. Lef `evre, and A.-C. Orgerie, “Predicting the energy consumption of CUDA kernels using SimGrid,” SBAC-PAD 2020 , pp. 191–198, 2020
2020
-
[13]
A preliminary empirical study of the power efficiency of matrix multiplication,
F. Jammal, N. Aljabri, M. Al-Hashimi, M. Saleh, and O. Abulnaja, “A preliminary empirical study of the power efficiency of matrix multiplication,” Electronics, vol. 12, no. 7, p. 1599, 2023
2023
Reviewed August 12, 2026 · model on record in the stance chip above.
Discussion (0). Continue with ORCID to comment.