REVIEW 3 major objections 7 minor 84 references
Reviewed by Pith at T0; open to challenge.
T0 means a machine referee read the full paper against a public rubric. The mark states how deep the mechanical check went, never who wrote it. the ladder, T0–T4 →
T0 review · glm-5.2
Flare power follows magnetic size, not rule compliance
2026-07-10 00:55 UTC pith:3VQPKPNU
load-bearing objection Solid negative finding on empirical-law compliance vs. flare productivity, with one positive exception that needs the same confound check the authors already applied elsewhere. the 3 major comments →
Investigation on the Relation between Active Regions' Compliance with Empirical Laws and Flare Productivity
The pith
A machine-rendered reading of the paper's core claim, the machinery that carries it, and where it could break.
Core claim
The paper's central negative result is that compliance with Hale's law, Joy's law, and the hemispheric helicity rule does not reliably predict flare productivity. The one statistically significant exception — Cycle 24 regions obeying Hale's and Joy's laws but violating the hemispheric helicity rule — showed higher flaring, but the effect size was below 0.1, and the authors attribute part of this signal to the uncontrolled variable of magnetic complexity (delta-type spot configurations). The positive discovery is the identification of dual empirical thresholds — 50.5 Mm in centroid distance and 0.58 × 10^22 Mx in total unsigned magnetic flux — below which binned median flare index is zero. In
What carries the argument
The argument is carried by three measured quantities: the tilt angle (computed from flux-weighted polarity centroids in heliographic coordinates, classifying compliance with Hale's and Joy's laws), the force-free parameter alpha_best (a least-squares fit of the current-to-field ratio across the active region, classifying compliance with the hemispheric helicity rule), and the flare index (a weighted daily rate of C, M, and X-class flares normalized by the time span of flaring activity). The statistical engine is the Mann-Whitney U test, a nonparametric rank-based comparison that handles the heavily zero-inflated, highly skewed flare index distribution without assuming normality. The dual-thi
Load-bearing premise
The study assigns each active region a single compliance label by majority vote across all its daily detections during disk transit. If flare-productive regions evolve more rapidly — through flux cancellation, rotation, or polarity migration — their majority-vote label may not capture the magnetic configuration actually present at the time of flare triggering, which could blur the comparison between compliance groups.
What would settle it
If a reanalysis using time-resolved compliance labels (updated daily rather than majority-voted) found that flare-productive regions systematically shift their compliance class in the days preceding major flares, the conclusion that compliance is irrelevant to flaring would be weakened, because the relevant configuration would be the pre-flare one, not the disk-transit average.
If this is right
- Flare forecasting models that weight compliance with empirical laws as a feature may gain little predictive power; replacing or supplementing such features with simple flux and spatial-extent thresholds could improve performance.
- The Cycle 24 exception — regions with standard bipolar orientation but anomalous twist showing elevated flaring — is consistent with flare trigger models where opposite-signed helicity interaction drives reconnection, and warrants targeted study with helicity injection measurements.
- The finding that compliance rates increase with centroid distance and are higher during the ascending phase of a solar cycle constrains flux-emergence simulations: models must reproduce not just the average tilt or twist but also how compliance depends on flux-tube strength and cycle phase.
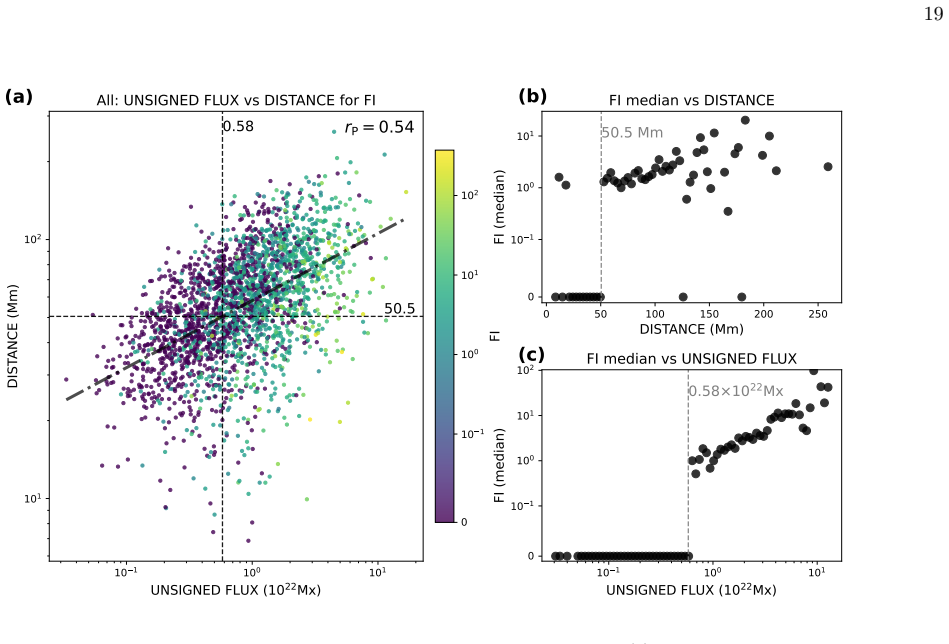
- The dual-threshold result provides a concrete, testable separability criterion: if an active region falls below both the 50.5 Mm and 0.58 × 10^22 Mx thresholds, its median flare productivity is statistically zero, regardless of magnetic configuration.
Editorial analysis
A structured set of objections, weighed in public.
Referee Report
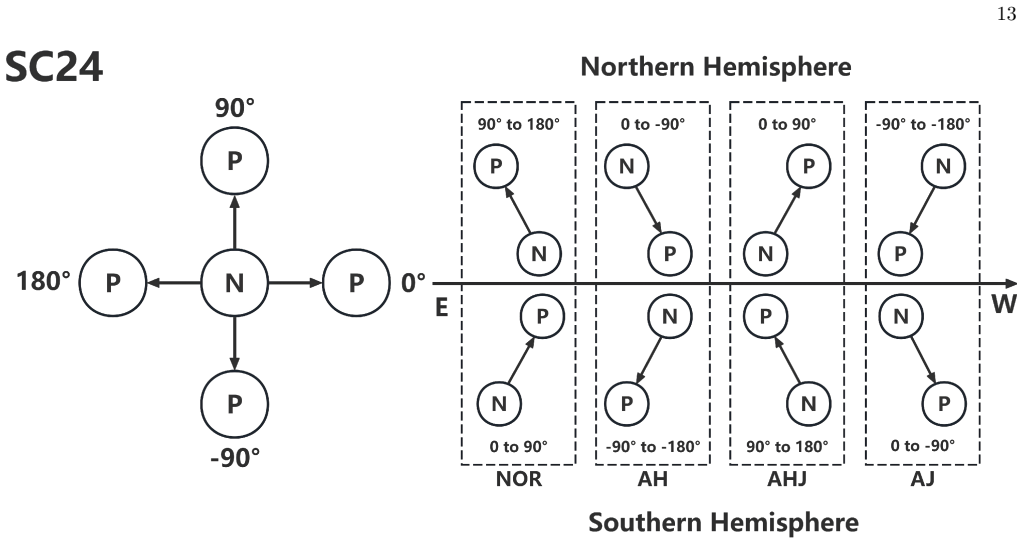
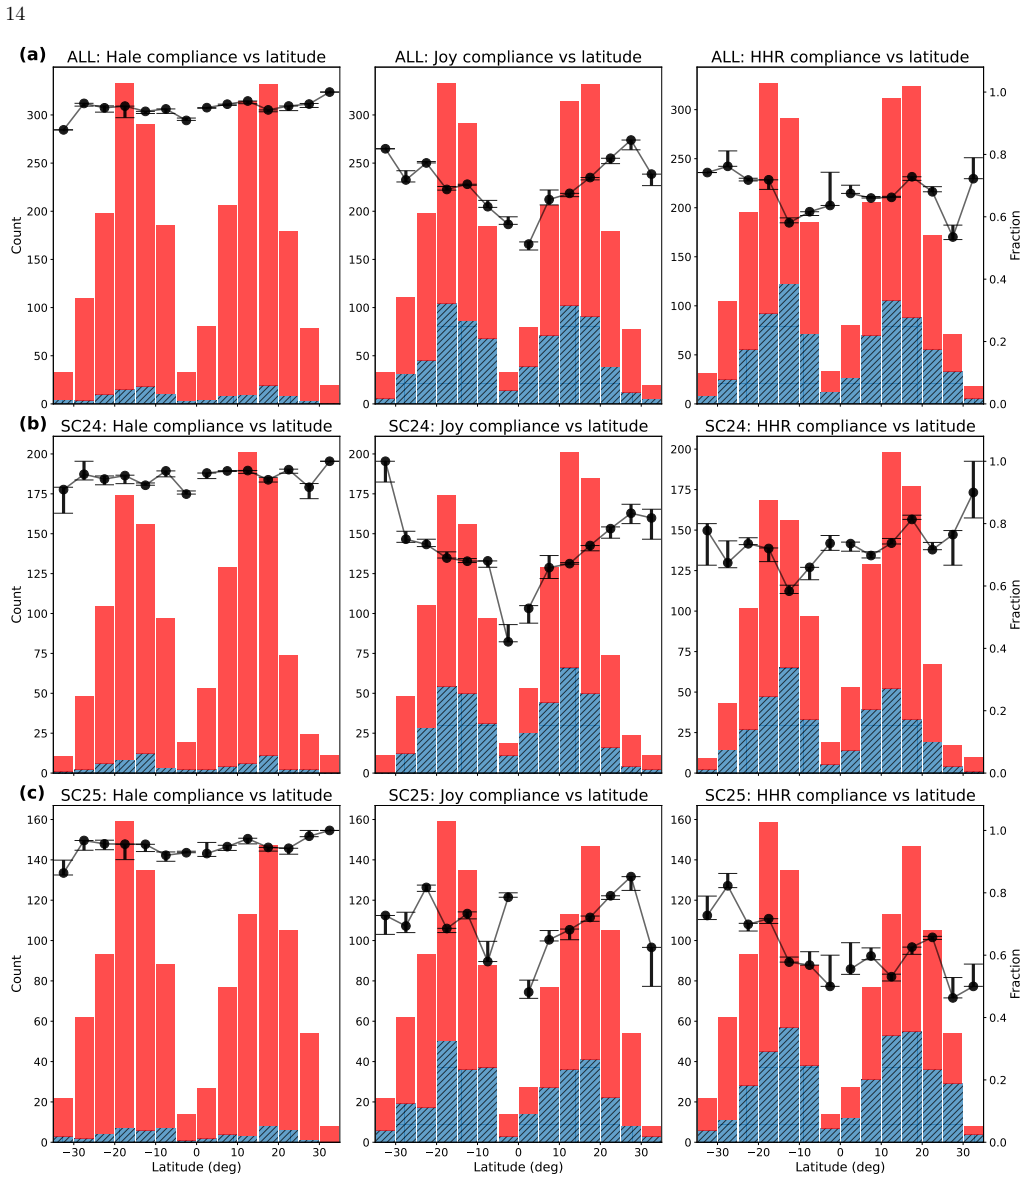
Summary. This manuscript presents a comprehensive statistical analysis of 2616 active regions (ARs) spanning Solar Cycle 24 and the ascending phase of Cycle 25, investigating whether compliance with Hale's law, Joy's law, and the Hemispheric Helicity Rule (HHR) correlates with flare productivity as measured by the flare index (FI). ARs are detected automatically from MDI and HMI magnetograms using the deep-learning-based SARD model, cross-matched with NOAA SRS records. Tilt angles are computed from flux-weighted polarity centroids, magnetic twist is estimated via the force-free parameter alpha_best, and flare productivity is quantified using GOES C-class-and-above events. The authors find that the majority of ARs comply with all three empirical laws (~67%), that compliance rates increase with centroid distance and (for Hale's law) with unsigned flux, and that overall FI does not differ significantly across compliance groups. The one exception is that SC24 ARs obeying Hale's and Joy's laws but violating the HHR (NOR|0) show statistically higher FI. The authors also identify empirical thresholds (50.5 Mm centroid distance, 0.58x10^22 Mx unsigned flux) below which median FI drops to zero. The central conclusion is that flare productivity depends on magnetic system size and strength rather than on compliance with empirical laws.
Significance. The study addresses a well-motivated question with a large, well-curated dataset and appropriate non-parametric statistical methods. The use of the Mann-Whitney U test with effect sizes is well-suited to the highly skewed FI distribution. The systematic uncertainty estimation via threshold variation, patch-size variation, and cycle-boundary variation is commendable and adds robustness. The identification of empirical flux and distance thresholds for flare productivity is a useful, falsifiable result. The transparent acknowledgment that the AHJ group's elevated FI in SC24 is likely a magnetic-complexity confound rather than an intrinsic property demonstrates scientific honesty. The negative central claim is inherently non-circular and well-supported by the data.
major comments (3)
- §3.2, Table 2: The paper identifies a statistically significant result that SC24 NOR|0 ARs (obeying Hale's and Joy's laws but violating HHR) exhibit higher FI than other groups (z = -2.333 for NOR|1 vs NOR|0; z = 2.273 for NOR|0 vs 'Other'). The authors interpret this physically via helicity annihilation (§4, citing Kusano et al. 2003). However, the paper itself demonstrates that the elevated FI of the AHJ group in SC24 is confounded by a disproportionate presence of delta-type (magnetically complex) ARs—4 of 36 AHJ ARs are delta-type with high FI, while SC25 AHJ ARs lack delta-types and are quiescent. The critical gap is that this same delta-type confound check is performed for AHJ but NOT for the NOR|0 group (n=257 in SC24). If the NOR|0 group also contains a disproportionate number of delta-type ARs, the significant z-score could be driven by magnetic complexity rather than HHR-violat
- §2, paragraph beginning 'SARD is applied to each LoS magnetogram': The majority-vote assignment of a single compliance label per AR across all disk-transit detections assumes that temporal evolution of tilt, twist, and polarity configuration during disk passage does not systematically bias the classification in a manner correlated with flare productivity. Flare-productive ARs may evolve more rapidly through flux cancellation, rotation, or emergence of new flux, potentially shifting their majority-vote label away from the configuration relevant at the time of flare triggering. The authors should discuss this potential confound and, if feasible, quantify how often ARs change compliance status across detections. If the fraction of 'flipping' ARs is small, a sensitivity check excluding them would strengthen the analysis.
- §3.3, Figure 7: The empirical thresholds (50.5 Mm, 0.58x10^22 Mx) are derived from the same dataset used to evaluate their discriminative power. The reported 60.9-62.8% true-positive rate and 72.1-72.7% precision are in-sample performance metrics and will be optimistically biased. The authors should either (a) use a cross-validation or split-sample approach to estimate out-of-sample performance, or (b) explicitly state that these thresholds are descriptive rather than predictive and require validation on independent data.
minor comments (7)
- §2: The flux imbalance ratio threshold R > 0.5 for flagging unipolar ARs is stated without justification. A brief citation or sensitivity note would help the reader assess robustness.
- Table 1: The HHR compliance rate for the full sample is listed as 67.3% in the table but 67.5% in the abstract and conclusion text. Please reconcile.
- Figure 2 caption: The tilt-angle ranges for each classification (NOR, AH, AJ, AHJ) are described in the text but the figure annotation is referenced as 'annotated in the figure'—ensure the ranges are clearly legible in the final figure.
- §3.2: The phrase 'the correlation between the AR types and the flare productivity is quite weak, as indicated by the ES values (all less than 0.1)' should note that this applies to the HHR-only and three-law tests, but the AH vs AHJ test in SC24 has ES = 0.306 (medium), which is not negligible.
- §4, final paragraph: 'minimal spacial scale' should read 'minimal spatial scale'.
- References: Li (2018a) and Li (2018b) appear to be the same paper (same ApJ reference, same doi). Please verify and consolidate.
- Figure 7a: The color-coded FI values span several orders of magnitude; consider using a logarithmic color scale to improve visibility of the moderate-FI ARs.
Circularity Check
No circularity: the paper's central claim is a negative statistical result that cannot be forced by construction
full rationale
The paper's derivation chain is self-contained and non-circular. (1) Compliance labels (NOR, AH, AJ, AHJ, HHR|1, HHR|0) are computed from observable magnetic properties—tilt angles via flux-weighted centroids (Eq. 1) and magnetic twist via α_best (Eq. 2)—which are independent of the flare index. (2) The flare index (Eq. 4) is computed from GOES C-class-and-above flare events catalogued in HEK, an independent data source. (3) The Mann-Whitney U test (Eqs. 5–7) is a standard non-parametric test applied to compare FI distributions across compliance groups; no parameter is fitted to the outcome being tested. (4) The empirical thresholds (50.5 Mm, 0.58×10^22 Mx) are derived from binned median FI distributions but are explicitly labeled 'empirical' and not presented as theoretical predictions—they are descriptive observations from the data. (5) Self-citations (Pan et al. 2025a for the SARD detection model; Pan & Liu 2025 for the Mann-Whitney methodology) are methodological tools that are externally verifiable and do not constitute the load-bearing theoretical claim. The central claim is a negative result (no significant FI difference across compliance groups), which is inherently non-circular: it cannot be forced by parameter choices or definitions. No step in the derivation reduces to its own inputs by construction.
Axiom & Free-Parameter Ledger
free parameters (5)
- Magnetic field threshold for polarity centroid and alpha_best =
100 G (fiducial), varied to 150 G
- Flux imbalance ratio threshold R =
0.5
- Longitude range for AR retention =
[-30°, 30°]
- Number of bins for FI threshold identification =
80 (fiducial), varied 70-90
- Cycle boundary between SC24 and SC25 =
2019 December 1
axioms (4)
- domain assumption The force-free approximation (nabla x B = alpha*B) is valid for computing alpha_best as a twist proxy in photospheric vector magnetograms.
- domain assumption The majority-vote label across multiple disk-transit detections represents the intrinsic compliance state of an AR.
- domain assumption The flare index (FI) as defined in Equation 4 is a valid proxy for flare productivity.
- domain assumption GOES C-class-and-above flares from the HEK catalog represent a complete sample of each AR's flare productivity.
read the original abstract
It remains evasive whether solar active regions (ARs) obeying or violating Hale's polarity law, Joy's tilt law, and the hemispheric helicity rule (HHR) differ in flare productivity. Here we conduct a comprehensive statistical analysis of ARs during the Solar Cycle 24 and the ascending phase of Cycle 25. ARs are automatically detected from full-disk line-of-sight magnetograms acquired by the Michelson Doppler Imager (MDI) and the Helioseismic and Magnetic Imager (HMI). We calculate tilt angles via flux-weighted polarity centroids, estimate magnetic twist by the force-free parameter $\alpha_{\mathrm{best}}$ from HMI vector magnetograms, and measure flare productivity using the flare index (FI) built from GOES C-class-and-above events. Our results substantiate that the majority of ARs follow the aforementioned three empirical laws. The compliance rate tends to be higher for ARs emerging at higher latitudes or having larger centroid distance, while total unsigned magnetic flux exerts limited influence, with a clear positive correlation only for Hale's law. Overall, FI shows no significant discrepancies across different compliance groups, except that Cycle 24 ARs that satisfy Hale's and Joy's laws but violate the HHR exhibit higher FI than other groups. We also identify empirical thresholds for centroid distance and total unsigned flux, above which the median FI of binned ARs becomes nonzero. Combining the flux and distance thresholds effectively separates flare-productive from flare-quiet ARs. We hence conclude that the flare productivity of ARs is not dependent on the compliance with the empirical laws, but more closely associated with sufficiently large and strong magnetic systems.
Figures



Reference graph
Works this paper leans on
-
[1]
1998, ApJL, 496, L43, doi: 10.1086/311232
Bao, S., & Zhang, H. 1998, ApJL, 496, L43, doi: 10.1086/311232
-
[2]
Baumgartner, C., Birch, A. C., Schunker, H., Cameron, R. H., & Gizon, L. 2022, A&A, 664, A183, doi: 10.1051/0004-6361/202243357
-
[3]
Berger, M. A., & Field, G. B. 1984, Journal of Fluid Mechanics, 147, 133, doi: 10.1017/S0022112084002019
-
[4]
Berger, M. A., & Ruzmaikin, A. 2000, J. Geophys. Res., 105, 10481, doi: 10.1029/1999JA900392
-
[5]
W., Evenson, P., & Matthaeus, W
Bieber, J. W., Evenson, P., & Matthaeus, W. H. 1987, Geophys. Res. Lett., 14, 864, doi: 10.1029/GL014i008p00864
-
[6]
Bobra, M. G., Sun, X., Hoeksema, J. T., et al. 2014, SoPh, 289, 3549, doi: 10.1007/s11207-014-0529-3
-
[7]
Calabretta, M. R., & Greisen, E. W. 2002, A&A, 395, 1077, doi: 10.1051/0004-6361:20021327
-
[8]
1995, ApJ, 441, 886, doi: 10.1086/175410
Caligari, P., Moreno-Insertis, F., & Schussler, M. 1995, ApJ, 441, 886, doi: 10.1086/175410
-
[9]
Canfield, R. C., Hudson, H. S., & McKenzie, D. E. 1999, Geophys. Res. Lett., 26, 627, doi: 10.1029/1999GL900105
-
[10]
2021, SoPh, 296, 150, doi: 10.1007/s11207-021-01895-1
Chen, A., Ye, Q., & Wang, J. 2021, SoPh, 296, 150, doi: 10.1007/s11207-021-01895-1
-
[11]
Chen, A. Q., & Wang, J. X. 2012, A&A, 543, A49, doi: 10.1051/0004-6361/201118037
-
[12]
1988, Routledge, doi: 10.4324/9780203771587
Cohen, J. 1988, Routledge, doi: 10.4324/9780203771587
-
[13]
Corder, G. W., & Foreman, D. I. 2009, (No Title), doi: 10.1002/9781118165881
-
[14]
Dasi-Espuig, M., Solanki, S. K., Krivova, N. A., Cameron, R., & Pe˜ nuela, T. 2010, A&A, 518, A7, doi: 10.1051/0004-6361/201014301 D´ emoulin, P., Mandrini, C. H., Van Driel-Gesztelyi, L., Lopez Fuentes, M. C., & Aulanier, G. 2002, SoPh, 207, 87, doi: 10.1023/A:1015531804337 D’Silva, S., & Choudhuri, A. R. 1993, A&A, 272, 621
-
[15]
2008, ApJ, 676, 680, doi: 10.1086/527317
Fan, Y. 2008, ApJ, 676, 680, doi: 10.1086/527317
-
[16]
2003, The Astrophysical Journal, 582, 1206, doi: 10.1086/344798
Fan, Y., Abbett, W., & Fisher, G. 2003, The Astrophysical Journal, 582, 1206, doi: 10.1086/344798
-
[17]
2014, ApJ, 789, 35, doi: 10.1088/0004-637X/789/1/35
Fan, Y., & Fang, F. 2014, ApJ, 789, 35, doi: 10.1088/0004-637X/789/1/35
work page internal anchor Pith review doi:10.1088/0004-637x/789/1/35 2014
-
[18]
Fan, Y., Fisher, G. H., & Deluca, E. E. 1993, ApJ, 405, 390, doi: 10.1086/172370
-
[19]
Fan, Y., Fisher, G. H., & McClymont, A. N. 1994, ApJ, 436, 907, doi: 10.1086/174967
-
[20]
Fan, Y., Zweibel, E. G., & Lantz, S. R. 1998, ApJ, 493, 480, doi: 10.1086/305122
-
[21]
Fisher, G. H., Fan, Y., & Howard, R. F. 1995, ApJ, 438, 463, doi: 10.1086/175090
-
[22]
Gary, G. A., & Hagyard, M. J. 1990, SoPh, 126, 21, doi: 10.1007/BF00158295
-
[23]
2006, The American Statistician, 60, 328, doi: 10.1198/000313006X152649
Gelman, A., & Stern, H. 2006, The American Statistician, 60, 328, doi: 10.1198/000313006X152649
-
[24]
Georgoulis, M. K., & Rust, D. M. 2007, ApJL, 661, L109, doi: 10.1086/518718
-
[25]
Glatzmaier, G. A. 1985, ApJ, 291, 300, doi: 10.1086/163069
-
[26]
2005, PASJ, 57, 481, doi: 10.1093/pasj/57.3.481
Hagino, M., & Sakurai, T. 2005, PASJ, 57, 481, doi: 10.1093/pasj/57.3.481
-
[27]
E., Ellerman, F., Nicholson, S
Hale, G. E., Ellerman, F., Nicholson, S. B., & Joy, A. H. 1919, ApJ, 49, 153, doi: 10.1086/142452
-
[28]
Hathaway, D. H. 2015, Living Reviews in Solar Physics, 12, 4, doi: 10.1007/lrsp-2015-4
-
[29]
Hathaway, D. H., Wilson, R. M., & Reichmann, E. J. 1994, SoPh, 151, 177, doi: 10.1007/BF00654090
-
[30]
Howard, R. F. 1991, SoPh, 136, 251, doi: 10.1007/BF00146534
-
[31]
2012, SoPh, 275, 67, doi: 10.1007/s11207-010-9624-2
Hurlburt, N., Cheung, M., Schrijver, C., et al. 2012, SoPh, 275, 67, doi: 10.1007/s11207-010-9624-2
-
[32]
2018, ApJ, 863, 159, doi: 10.3847/1538-4357/aad197
Jiang, J., Wang, J.-X., Jiao, Q.-R., & Cao, J.-B. 2018, ApJ, 863, 159, doi: 10.3847/1538-4357/aad197
-
[33]
2010, ApJ, 713, 440, doi: 10.1088/0004-637X/713/1/440
Jing, J., Tan, C., Yuan, Y., et al. 2010, ApJ, 713, 440, doi: 10.1088/0004-637X/713/1/440
-
[34]
Anderson localization in an interacting fermionic system
Johnson, V. 2019, The American Statistician, 73, 129, doi: 10.1080/00031305.2018.1518788
work page internal anchor Pith review Pith/arXiv arXiv doi:10.1080/00031305.2018.1518788 2019
-
[35]
Jouve, L., & Brun, A. S. 2009, ApJ, 701, 1300, doi: 10.1088/0004-637X/701/2/1300
-
[36]
2003, Advances in Space Research, 32, 1931, doi: 10.1016/S0273-1177(03)90628-4
Kusano, K., Yokoyama, T., Maeshiro, T., & Sakurai, T. 2003, Advances in Space Research, 32, 1931, doi: 10.1016/S0273-1177(03)90628-4
-
[37]
2018, SoPh, 293, 159, doi: 10.1007/s11207-018-1381-7
Lee, E.-J., Park, S.-H., & Moon, Y.-J. 2018, SoPh, 293, 159, doi: 10.1007/s11207-018-1381-7
-
[38]
Leka, K. D. 1999, SoPh, 188, 21, doi: 10.1023/A:1005130630873
-
[40]
2018b, ApJ, 867, 89, doi: 10.3847/1538-4357/aae31a
Li, J. 2018b, ApJ, 867, 89, doi: 10.3847/1538-4357/aae31a
-
[41]
Li, J., & Ulrich, R. K. 2012, ApJ, 758, 115, doi: 10.1088/0004-637X/758/2/115
-
[42]
2024, ApJ, 973, 50, doi: 10.3847/1538-4357/ad66bd
Liu, R., & Wang, W. 2024, ApJ, 973, 50, doi: 10.3847/1538-4357/ad66bd
-
[43]
Liu, Y., Hoeksema, J. T., & Sun, X. 2014, ApJL, 783, L1, doi: 10.1088/2041-8205/783/1/L1
-
[44]
Liu, Y., & Schuck, P. W. 2012, ApJ, 761, 105, doi: 10.1088/0004-637X/761/2/105
-
[45]
Longcope, D. W., Fisher, G. H., & Pevtsov, A. A. 1998, ApJ, 507, 417, doi: 10.1086/306312
-
[46]
Longcope, D. W., & Klapper, I. 1997, ApJ, 488, 443, doi: 10.1086/304680 Mu˜ noz-Jaramillo, A., Navarrete, B., & Campusano, L. E. 2021, ApJ, 920, 31, doi: 10.3847/1538-4357/ac133b
-
[47]
Nelson, N. J., Brown, B. P., Sacha Brun, A., Miesch, M. S., & Toomre, J. 2014, SoPh, 289, 441, doi: 10.1007/s11207-012-0221-4
-
[48]
2023, SSRv, 219, 64, doi: 10.1007/s11214-023-01008-3
Norton, A., Howe, R., Upton, L., & Usoskin, I. 2023, SSRv, 219, 64, doi: 10.1007/s11214-023-01008-3
-
[49]
2025a, SoPh, 300, 111, doi: 10.1007/s11207-025-02525-w
Pan, J., Liu, J., Fang, S., & Liu, R. 2025a, SoPh, 300, 111, doi: 10.1007/s11207-025-02525-w
-
[50]
2025b, Chinese Journal of Space Science, 45, 1650, doi: 10.11728/cjss2025.06.2025-0086
Pan, J., LIU, J., & LIU, R. 2025b, Chinese Journal of Space Science, 45, 1650, doi: 10.11728/cjss2025.06.2025-0086
-
[51]
2025, ApJ, 995, 46, doi: 10.3847/1538-4357/ae1d7e
Pan, J., & Liu, R. 2025, ApJ, 995, 46, doi: 10.3847/1538-4357/ae1d7e
-
[52]
2010, ApJ, 720, 1102, doi: 10.1088/0004-637X/720/2/1102
Park, S.-H., Chae, J., Jing, J., Tan, C., & Wang, H. 2010, ApJ, 720, 1102, doi: 10.1088/0004-637X/720/2/1102
-
[53]
Park, S.-H., Leka, K. D., & Kusano, K. 2020, ApJ, 904, 6, doi: 10.3847/1538-4357/abbb93
-
[54]
Park, S.-H., Leka, K. D., & Kusano, K. 2021, ApJ, 911, 79, doi: 10.3847/1538-4357/abea13
-
[55]
2013, ApJ, 778, 13, doi: 10.1088/0004-637X/778/1/13
Park, S.-H., Kusano, K., Cho, K.-S., et al. 2013, ApJ, 778, 13, doi: 10.1088/0004-637X/778/1/13
-
[56]
Parker, E. N. 1994, ApJ, 433, 867, doi: 10.1086/174695
-
[57]
Pevtsov, A. A., Canfield, R. C., & Metcalf, T. R. 1995, ApJL, 440, L109, doi: 10.1086/187773
-
[58]
Pevtsov, A. A., & Longcope, D. W. 2001, in Astronomical Society of the Pacific Conference Series, Vol. 236, Advanced Solar Polarimetry – Theory, Observation, and Instrumentation, ed. M. Sigwarth, 423
work page 2001
-
[59]
2025, ApJ, 986, 114, doi: 10.3847/1538-4357/add93a
Qin, L., Jiang, J., & Wang, R. 2025, ApJ, 986, 114, doi: 10.3847/1538-4357/add93a
-
[60]
Savcheva, A. S., McKillop, S. C., McCauley, P. I., Hanson, E. M., & DeLuca, E. E. 2014, SoPh, 289, 3297, doi: 10.1007/s11207-013-0469-3
-
[61]
Scherrer, P. H., Schou, J., Bush, R. I., et al. 2012, SoPh, 275, 207, doi: 10.1007/s11207-011-9834-2
-
[62]
1990, SoPh, 125, 219, doi: 10.1007/BF00158402
Seehafer, N. 1990, SoPh, 125, 219, doi: 10.1007/BF00158402
-
[63]
Sreedevi, A., Jha, B. K., Karak, B. B., & Banerjee, D. 2023, ApJS, 268, 58, doi: 10.3847/1538-4365/acec47
-
[64]
Sreedevi, A., Jha, B. K., Karak, B. B., & Banerjee, D. 2024, ApJ, 966, 112, doi: 10.3847/1538-4357/ad34b8
-
[65]
Stenflo, J. O., & Kosovichev, A. G. 2012, ApJ, 745, 129, doi: 10.1088/0004-637X/745/2/129
-
[66]
On the Coordinate System of Space-Weather HMI Active Region Patches (SHARPs): A Technical Note
Sun, X. 2013, arXiv e-prints, arXiv:1309.2392, doi: 10.48550/arXiv.1309.2392
work page internal anchor Pith review Pith/arXiv arXiv doi:10.48550/arxiv.1309.2392 2013
-
[67]
2021, Living Reviews in Solar Physics, 18, 4, doi: 10.1007/s41116-021-00030-3
Temmer, M. 2021, Living Reviews in Solar Physics, 18, 4, doi: 10.1007/s41116-021-00030-3
-
[68]
2005, SoPh, 229, 63, doi: 10.1007/s11207-005-3524-x
Tian, L., Alexander, D., Liu, Y., & Yang, J. 2005, SoPh, 229, 63, doi: 10.1007/s11207-005-3524-x
-
[69]
1999, SoPh, 189, 305, doi: 10.1023/A:1005252617906
Tian, L., Zhang, H., Tong, Y., & Jing, H. 1999, SoPh, 189, 305, doi: 10.1023/A:1005252617906
-
[70]
Toriumi, S., & Wang, H. 2019, Living Reviews in Solar Physics, 16, 3, doi: 10.1007/s41116-019-0019-7 van Driel-Gesztelyi, L., & Green, L. M. 2015, Living Reviews in Solar Physics, 12, 1
-
[71]
Vemareddy, P., Ambastha, A., & Maurya, R. A. 2012, ApJ, 761, 60, doi: 10.1088/0004-637X/761/1/60
-
[72]
Virtanen, I. O. I., Virtanen, I. I., Pevtsov, A. A., Yeates, A., & Mursula, K. 2017, A&A, 604, A8, doi: 10.1051/0004-6361/201730415
- [73]
-
[74]
Physics, Mechanics, and Astronomy, 58, 5682, doi: 10.1007/s11433-015-5682-7
-
[75]
2023, ApJS, 268, 55, doi: 10.3847/1538-4365/acef1b
Wang, R., Jiang, J., & Luo, Y. 2023, ApJS, 268, 55, doi: 10.3847/1538-4365/acef1b
-
[76]
2013, ApJL, 775, L46, doi: 10.1088/2041-8205/775/2/L46
Wang, Y.-M. 2013, ApJL, 775, L46, doi: 10.1088/2041-8205/775/2/L46
-
[77]
Wang, Y.-M., & Sheeley, Jr., N. R. 1989, SoPh, 124, 81, doi: 10.1007/BF00146521
-
[78]
Weber, M. A., & Fan, Y. 2015, SoPh, 290, 1295, doi: 10.1007/s11207-015-0674-3
-
[79]
Weber, M. A., Fan, Y., & Miesch, M. S. 2011, ApJ, 741, 11, doi: 10.1088/0004-637X/741/1/11
-
[80]
Weber, M. A., Fan, Y., & Miesch, M. S. 2013, SoPh, 287, 239, doi: 10.1007/s11207-012-0093-7
-
[81]
Will, L. W., Norton, A. A., & Hoeksema, J. T. 2024, ApJ, 976, 20, doi: 10.3847/1538-4357/ad82e3
discussion (0)
Sign in with ORCID, Apple, or X to comment. Anyone can read and Pith papers without signing in.