REVIEW 4 major objections 6 minor 16 references
Confident Head Circumference Measurement from Ultrasound with Real-time Feedback for Sonographers
T0 review · 4 major / 6 minor · reviewed 2026-08-14 · deepseek-v4-flash
Pith's one-line read Probabilistic multi-sampling gives fetal head circumference measurements confidence bounds and variance scores that guide sonographers to better scan planes in real time.
desk verdict Base HC measurement is solid, but the variance-score feedback claim is under-validated and likely overfit to the test set. read the letter →
The pith
A machine-rendered reading of the paper's core claim, the machinery that carries it, and where it could break.
The reading
What carries the argument
The machinery is a probabilistic segmentation pipeline that turns one ultrasound image into $N$ candidate head masks. Monte Carlo Dropout (running a U-Net with dropout active during inference) and a Probabilistic U-Net (a U-Net combined with a conditional variational autoencoder) act as samplers; each candidate mask is converted into an ellipse by direct least-squares fitting, and the head circumference is computed from the fitted axes using the Ramanujan II approximation. The mean or median of the $N$ circumferences becomes the reported measurement, the spread of the ellipses defines the confidence margins, and four variance scores built from those samples are thresholded to accept or reject the image. The variance-score threshold is the component that turns the sampler into an operator guidance tool.
What would settle it
Assemble a set of ultrasound images with independent ratings of view quality and ground-truth head circumference, then check whether images the variance score rejects are systematically less accurate or lower quality than images it accepts; if the score separates the two groups no better than chance, or a threshold calibrated on one scanner fails on another, the feedback loop is not carrying the claimed signal.
Extended reading notes
Core claim
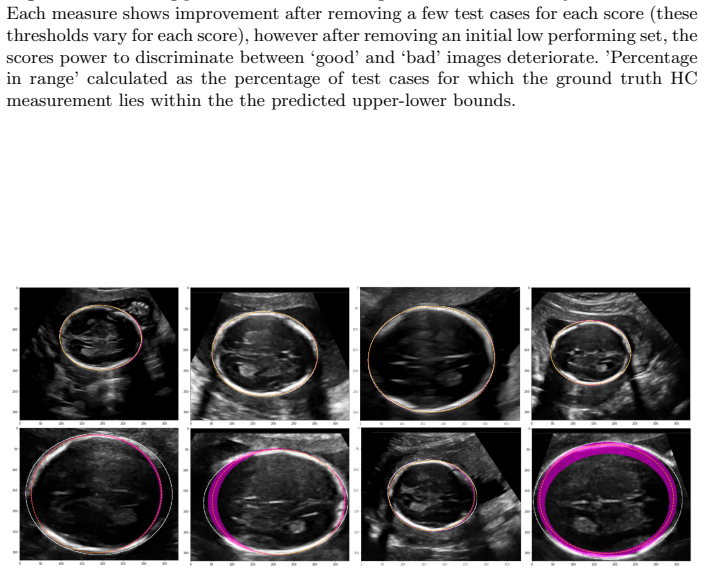
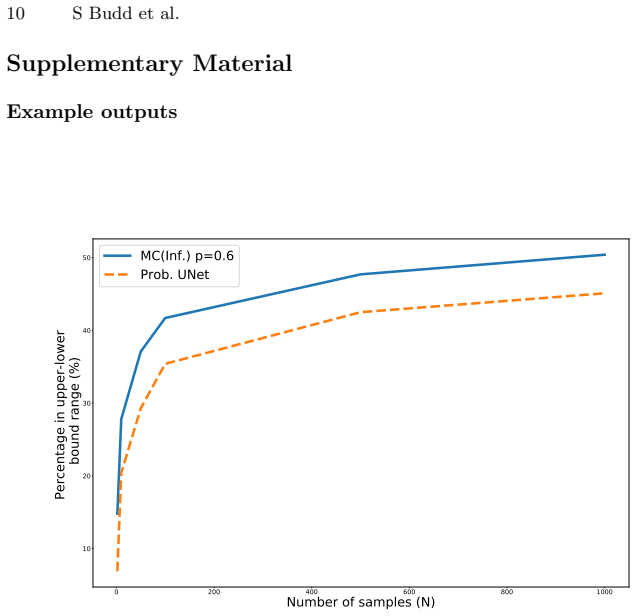
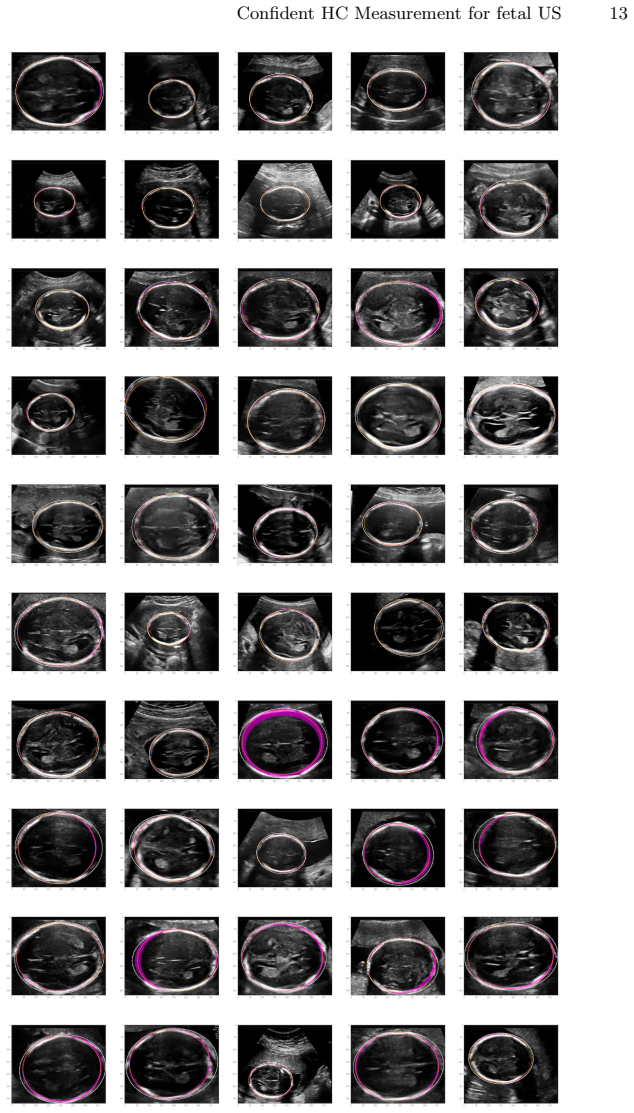
The central claim is that the disagreement among stochastic predictions of a fetal head segmentation network is informative enough to serve as a signal of measurement reliability. The authors show that Monte Carlo Dropout with dropout probability $p=0.6$ on a U-Net trained on 2,848 training images and evaluated on 540 held-out images gives $1.81 \pm 1.65$ mm mean absolute error, matching the deterministic baseline while adding an upper and lower bound on every measurement. With $N=10$ samples, 27.8% of ground-truth head circumferences fall inside the predicted bounds; with $N=1{,}000$ samples that rises to 50.4%, and for cases outside the bounds the average distance from the true value to the margin is $1.82 \pm 1.78$ mm. Each of the four proposed variance scores (ellipse parameter variance, ring area between the union and intersection of sampled masks, mask entropy, and softmax entropy) improves average accuracy when used to reject high-variance images, which the paper reads as evidence that higher sampled variance coincides with sub-optimal scan planes.
Load-bearing premise
The central assumption is that the run-to-run variation in the network's outputs actually tracks how good the ultrasound view is, and that a cutoff for "too variable" learned on one set of images will keep working on new patients, machines, and anatomies.
Editorial extensions
If this is right
- A deployed system could show the head circumference with its upper and lower bounds and issue a re-scan warning when the variance score crosses a threshold, pushing operators toward views the model handles well.
- Rejecting high-variance images raises the average accuracy of the accepted set, so a stricter acceptance threshold trades extra scan attempts for higher measurement reliability.
- Because the same dropout-equipped U-Net supplies both the measurement and the confidence information, the feedback does not require a separate uncertainty network or a slower ensemble.
- Consistent use of the feedback would normalize the chosen scan plane toward the training distribution, which should make measurements more reproducible across sonographers.
Reading between the lines
- The paper leaves the variance-score thresholds and the containment rate as descriptive results; a natural next test is to calibrate the bounds on one dataset so that the stated confidence matches the observed rate, then apply them to a new scanner or population.
- An end-to-end user study with real sonographers could test whether showing the re-scan prompt during freehand scanning actually changes the chosen plane and reduces inter-operator spread in the final measurements.
- The same rejection mechanism could function as an out-of-distribution detector for abnormal anatomy, since high variance may flag images unlike the training set; the paper lists such cases as future work rather than demonstrating detection.
- The variance scores are not calibrated as true uncertainty estimates, so a useful extension is to compare them against independent inter-observer disagreement on the same images to see whether high variance marks exactly the cases where human sonographers also disagree.
Signed reviews
Editorial analysis
A structured set of objections, weighed in public.
Referee Report
Summary. The paper proposes a probabilistic deep-learning pipeline for fetal head circumference (HC) measurement from 2D ultrasound, built on a U-Net segmentation followed by ellipse fitting. Two stochastic segmentation mechanisms are compared: Monte-Carlo Dropout at inference and a Probabilistic U-Net. For each input image the method draws N segmentation samples, fits an ellipse to each sample, and aggregates the resulting ellipse parameters into a point estimate and an upper/lower bound. It also defines four 'variance scores' (ellipse parameter variance, total ring area, mask classification entropy, softmax confidence entropy) and uses them to reject test images above a threshold, with the aim of steering sonographers toward scan planes for which the network is more reliable. Experiments on a dataset of 2848 training and 540 test images report a mean absolute HC error of 1.81 ± 1.65 mm for the best deterministic single-sample setting, approximately 50% containment of ground-truth HC within the predicted bounds at N=1000 MC samples, and improved average performance on accepted images after rejecting high-variance cases in the test set.
Significance. If the central claims were fully validated, the paper would be a useful clinical-technical contribution: real-time confidence bounds and operator feedback for fetal HC measurement could improve inter-operator consistency, and the base measurement accuracy is in line with prior work. The strengths of the paper are its use of a large clinical dataset with external ground-truth annotations, a plausible and well-motivated pipeline, and a comparison between MC dropout and Probabilistic U-Net under a common evaluation protocol. However, the two elements that constitute the paper's novelty—the 'confidence' containment statistic and the variance-score feedback mechanism—are not yet convincingly validated. The containment percentage is not a calibrated confidence statement because the number of samples N is selected after observing the coverage curve, and the variance-score thresholds are selected and evaluated on the same test set. These issues affect the abstract's headline numbers and the real-time feedback claim, so the manuscript needs substantial additional validation before the main contributions can be accepted.
major comments (4)
- [Section 3, Table 2 and Supplementary Figure 4] The 'percentage in upper-lower bound range' statistic is not a calibrated confidence interval. The paper reports that coverage varies significantly with N (14.8% at N=2 and 50.4% at N=1000 for MC dropout) and that the 50% figure is reached only after increasing N to 1000. Because N is chosen after observing the coverage curve, the headline '50% of test images fully contained' is an artifact of the sample-count choice rather than a principled confidence statement. To support the confidence claim, the authors should pre-specify a target coverage level, select N (or the interval construction) on a validation set, and only then evaluate coverage on the held-out test set. Alternatively, they should report coverage as a monotone function of N for a fixed N and avoid claiming a calibrated confidence level.
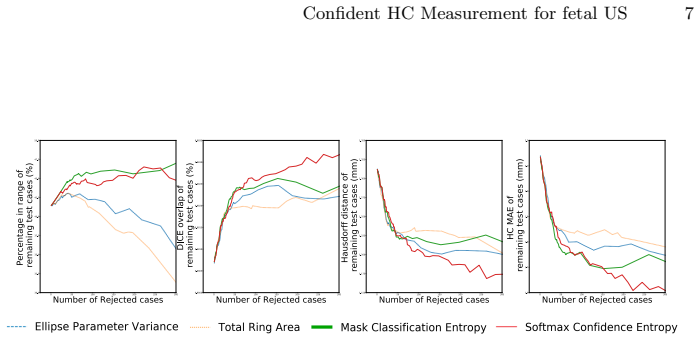
- [Section 3, 'Variance Measure Thresholding', and Figure 2] The variance-score rejection thresholds are selected and evaluated on the same 540-image test set. For each of the four variance scores, the threshold between 0 and 1 is varied over the test data, and the performance improvement after rejecting high-variance cases is reported on the same images. This is in-sample threshold fitting, so the observed initial performance boost can arise from exploiting idiosyncratic noise in the test set even if the variance scores carry no true signal about measurement error. The correct protocol is to select thresholds on a separate validation set (or via cross-validation) and then report accepted-image performance on an independent test set. Without this, the paper's central feedback claim is not supported.
- [Section 4, Discussion] The authors concede that the proposed variance scores 'cannot claim' to represent model uncertainty directly, but the real-time feedback contribution depends on these scores tracking measurement error or view quality on unseen images. The only quantitative evidence for their utility is the in-sample threshold experiment in Section 3, which is not transferable evidence. The authors should provide a direct analysis relating each variance score to absolute HC error on held-out data (for example, a correlation or calibration plot), and demonstrate that a fixed, pre-selected threshold transfers to a new dataset or at least to an untouched test split. Without such evidence, the claim that the system can guide sonographers toward better scan planes is speculative.
- [Section 3, 'Single-Sampling Experiments', and Table 1] The dropout probability p=0.6 is described as 'value found to be best performing in variety of dropout configurations' from single-sample experiments, with results then reported on the Dataset A test data. If the model configuration was selected using the test set, the reported mean absolute error of 1.81 ± 1.65 mm may be optimistic. The authors should state explicitly whether a held-out validation split was used for hyperparameter selection, and if not, they should re-evaluate the final configuration on a truly held-out set. This is a load-bearing point for the base accuracy claim, although the accuracy itself is plausible.
minor comments (6)
- [Section 2, equations h3 and h4] The definitions of mask classification entropy and softmax confidence entropy appear to have sign issues: entropy is conventionally written as -∑ p log p, but the equations as printed omit the leading minus sign, and h4's summation index is unclear (the sum over K_i and the definition of p_i are confusing). Please clarify the notation and verify the signs.
- [Section 2 and Table 2] The use of 'MC dropout' is ambiguous: Table 1 reports a 'Dropout' model trained with dropout, while Table 2 reports 'MC(inf.)' for dropout applied during inference. Please label clearly whether dropout is applied during training, during inference, or both, and align the terminology across the text and tables.
- [Figure 2] The horizontal axis shows the number of rejected cases, but the text describes thresholds 'between zero and one'. The figures would be easier to interpret if the threshold value itself were shown on a secondary axis, or if curves were plotted against the normalized threshold for each variance score.
- [Tables 1 and 2] The reported DICE and Hausdorff distance values are given as mean ± standard deviation, but no confidence intervals or statistical significance tests are provided. Given the small differences between some configurations, a note on variability across runs or a statistical comparison would strengthen the claims.
- [Abstract] The abstract states '50% of the test images fully contained within the predicted confidence margins' without mentioning that this percentage is specific to N=1000 MC samples and not a calibrated confidence level. Please qualify this statement in the abstract to avoid overclaiming.
- [References] Reference 13 is formatted inconsistently with the other entries (listing the institution name as the author). Please standardize the reference style.
Circularity Check
Variance-score rejection thresholds are extracted and evaluated on the same test set, making the reported guidance benefit an in-sample fit; the HC measurement itself is externally benchmarked.
-
fitted input called prediction
[Section 3, 'Variance Measure Thresholding' (p. 5), Fig. 2 and Fig. 1 caption]
"Finally, we experiment with each of the variance scores produced over the test set as a means to accept/reject images at test time. We assess their performance by counting the number of accepted/rejected cases for a range of thresholds between zero and one, and how this threshold affects the resulting average performance scores after rejected images are removed from the test set. ... As a proof of concept we extract a threshold such that test cases whose variance score is outside the threshold are rejected, and inside are accepted."
The threshold is extracted from the same test set that is then used to measure the benefit of rejection, and Figure 2 reports the resulting improvement on that same test set. No held-out split, cross-validation, or pre-registered threshold is used; the paper even notes that the thresholds 'vary for each score.' Thus the reported initial performance boost is an in-sample fit: a favorable threshold can always be found post hoc on the test set. The conclusion that variance scores indicate sub-optimal image acquisition therefore rests on the very data used to construct the threshold, making the claimed guidance benefit statistically forced rather than independently predicted.
full rationale
The base HC measurement is not circular: it uses a U-Net and ellipse fit evaluated against external ground-truth delineations, with single-sample comparisons reported against the HC18 challenge and prior work, so the 1.81 +/- 1.65 mm MAE stands on its own. The probabilistic upper/lower bounds come from N forward passes and the containment percentage is measured empirically, not derived from ground truth; the 50% figure at N=1000 is an uncalibrated descriptive statistic rather than a circular prediction. The one genuinely circular element is the variance-rejection evaluation: thresholds are selected from and evaluated on the same 540-image test set, so the support for the operator-feedback claim reduces to an in-sample fit. Self-citation of the group's prior U-Net [14] is present but not load-bearing, since this paper retrains and reports its own single-sample results rather than relying on that citation for its central numbers.
Assumptions & free parameters
free parameters (3)
- MC Dropout probability p =
0.6
- Number of MC samples N for coverage claim =
1000
- Variance-score rejection thresholds =
Not reported; one threshold per score in [0,1]
assumptions (4)
- domain assumption Expert sonographer manual HC annotations are the reference standard for HC.
- domain assumption Ellipse fitting to the segmented skull mask faithfully reproduces the clinical HC measurement process.
- standard math MC dropout approximates Bayesian posterior inference for the U-Net.
- domain assumption The Probabilistic U-Net's latent space captures inter-annotation variability.
invented entities (1)
-
Variance scores h1-h4 (ellipse parameter variance, total ring area, mask classification entropy, softmax confidence entropy)
Cite this review
Pith. "Pith review of Confident Head Circumference Measurement from Ultrasound with Real-time Feedback for Sonographers." pith.science (2026). https://pith.science/paper/3YBJW5UE
@misc{pith2026190802582,
  author       = {Pith},
  title        = {Pith review of: Confident Head Circumference Measurement from Ultrasound with Real-time Feedback for Sonographers},
  year         = {2026},
  howpublished = {\url{https://pith.science/paper/3YBJW5UE}},
  note         = {Machine review of arXiv:1908.02582}
}
abstract
Manual estimation of fetal Head Circumference (HC) from Ultrasound (US) is a key biometric for monitoring the healthy development of fetuses. Unfortunately, such measurements are subject to large inter-observer variability, resulting in low early-detection rates of fetal abnormalities. To address this issue, we propose a novel probabilistic Deep Learning approach for real-time automated estimation of fetal HC. This system feeds back statistics on measurement robustness to inform users how confident a deep neural network is in evaluating suitable views acquired during free-hand ultrasound examination. In real-time scenarios, this approach may be exploited to guide operators to scan planes that are as close as possible to the underlying distribution of training images, for the purpose of improving inter-operator consistency. We train on free-hand ultrasound data from over 2000 subjects (2848 training/540 test) and show that our method is able to predict HC measurements within 1.81$\pm$1.65mm deviation from the ground truth, with 50% of the test images fully contained within the predicted confidence margins, and an average of 1.82$\pm$1.78mm deviation from the margin for the remaining cases that are not fully contained.
Figures

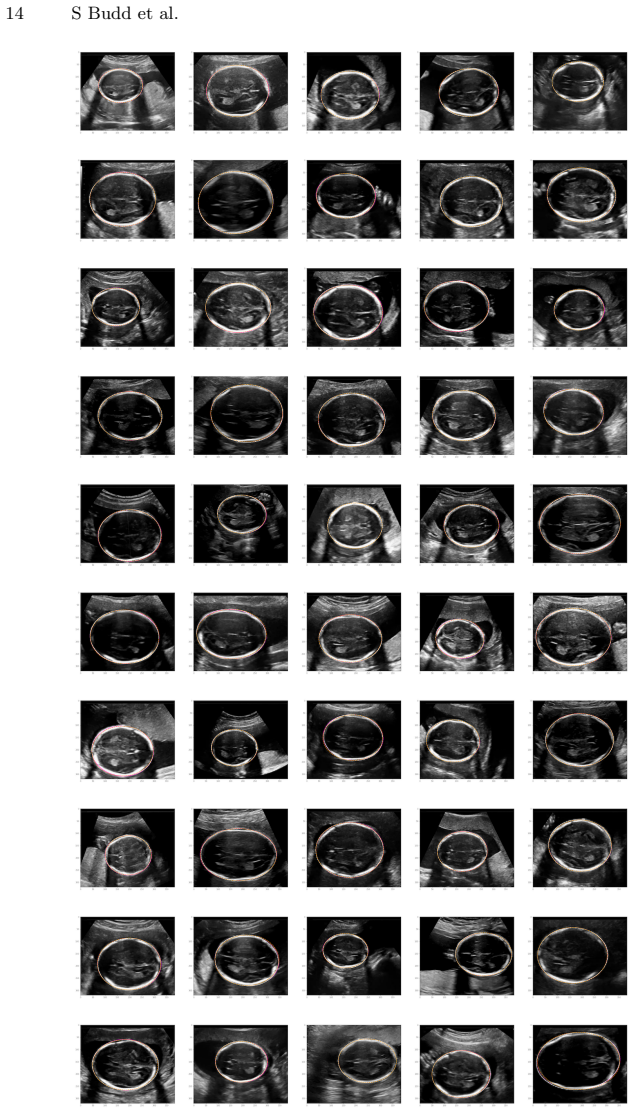
Figures from the paper (5 more)


Reference graph
Works this paper leans on
-
[1]
Journal of Mathematical Analysis and Applications 260(2), 295–306 (8 2001)
Barnard, R.W., Pearce, K., Schovanec, L.: Inequalities for the Perimeter of an Ellipse. Journal of Mathematical Analysis and Applications 260(2), 295–306 (8 2001). https://doi.org/10.1006/JMAA.2000.7128
-
[2]
IEEE Trans Med Imag 36(11), 2204–2215 (11 2017)
Baumgartner, C.F., et al.: SonoNet: Real-Time Detection and Localisation of Fetal Standard Scan Planes in Freehand Ultrasound. IEEE Trans Med Imag 36(11), 2204–2215 (11 2017). https://doi.org/10.1109/TMI.2017.2712367
-
[3]
IEEE Trans on Med Imag 27(9), 1342–1355 (9 2008)
Carneiro, G., Georgescu, B., Good, S., Comaniciu, D.: Detection and Measure- ment of Fetal Anatomies from Ultrasound Images using a Constrained Prob- abilistic Boosting Tree. IEEE Trans on Med Imag 27(9), 1342–1355 (9 2008). https://doi.org/10.1109/TMI.2008.928917
-
[4]
Fitzgibbon, A., Pilu, M., Fisher, R.: Direct least squares fitting of ellipses. In: 13th ICPR’96. pp. 253–257. IEEE (1996). https://doi.org/10.1109/ICPR.1996.546029
-
[5]
Gal, Y., Ghahramani, Z.: Dropout as a bayesian approximation: Representing model uncertainty in deep learning. In: ICLR’16. pp. 1050–1059 (2016)
work page 2016
-
[6]
In: Brainlesion: Glioma, Multiple Sclerosis, Stroke and Traumatic Brain Injuries
Kamnitsas, K., et al.: Ensembles of Multiple Models and Architectures for Robust Brain Tumour Segmentation. In: Brainlesion: Glioma, Multiple Sclerosis, Stroke and Traumatic Brain Injuries. pp. 450–462 (09 2018). https://doi.org/10.1007/978- 3-319-75238-9 38
doi:10.1007/978- 2018
-
[7]
In: Advances in Neural Information Processing Systems
Kohl, S., et al.: A probabilistic U-Net for segmentation of ambiguous images. In: Advances in Neural Information Processing Systems. pp. 6965–6975 (2018) Confident HC Measurement for fetal US 9
work page 2018
-
[8]
IEEE J Biomed Health Inform 22(1), 215–223 (1 2018)
Li, J., et al.: Automatic Fetal Head Circumference Measurement in Ultrasound Using Random Forest and Fast Ellipse Fitting. IEEE J Biomed Health Inform 22(1), 215–223 (1 2018). https://doi.org/10.1109/JBHI.2017.2703890
arXiv 2018
Show all 16 references
-
[9]
Pattern Recognition 46(5), 1449 – 1465 (2013)
Prasad, D., Leung, M., Quek, C.: Ellifit: An unconstrained, non-iterative, least squares based geometric ellipse fitting method. Pattern Recognition 46(5), 1449 – 1465 (2013). https://doi.org/10.1016/j.patcog.2012.11.007
2013 doi
-
[10]
In: MICCAI’15
Ronneberger, O., Fischer, P., Brox, T.: U-net: Convolutional networks for biomedical image segmentation. In: MICCAI’15. pp. 234–241. Springer (2015). https://doi.org/10.1007/978-3-319-24574-4 28
2015 doi
-
[11]
IEEE Trans Med Imag 33(4), 797–813 (4 2014)
Rueda, S., et al.: Evaluation and Comparison of Current Fetal Ul- trasound Image Segmentation Methods for Biometric Measurements: A Grand Challenge. IEEE Trans Med Imag 33(4), 797–813 (4 2014). https://doi.org/10.1109/TMI.2013.2276943
2014
-
[12]
Ultrasound Obstet Gynecol 39(3), 266–273 (mar 2012)
Sarris, I., et al.: Intra- and interobserver variability in fetal ultrasound measurements. Ultrasound Obstet Gynecol 39(3), 266–273 (mar 2012). https://doi.org/10.1002/uog.10082
2012 doi
-
[13]
National Health Service, U.: NHS Fetal Anomaly Screening Programme (FASP) Handbook Valid from August 2018. Tech. rep. (2018)
2018
-
[14]
In: 40th EMBC’18
Sinclair, M., et al.: Human-level Performance On Automatic Head Biometrics In Fetal Ultrasound Using Fully Convolutional Neural Networks. In: 40th EMBC’18. pp. 714–717. IEEE (7 2018). https://doi.org/10.1109/EMBC.2018.8512278
2018
-
[15]
PLOS ONE 13(8), e0200412 (8 2018)
van den Heuvel, T.L.A., de Bruijn, D., de Korte, C.L., Ginneken, B.v.: Automated measurement of fetal head circumference using 2D ultrasound images. PLOS ONE 13(8), e0200412 (8 2018). https://doi.org/10.1371/journal.pone.0200412
2018 doi
-
[16]
In: IEEE 14th ISBI’17
Wu, L., et al.: Cascaded Fully Convolutional Networks for automatic prenatal ultrasound image segmentation. In: IEEE 14th ISBI’17. pp. 663–666. IEEE (4 2017). https://doi.org/10.1109/ISBI.2017.7950607 10 S Budd et al. Supplementary Material Example outputs 0 200 400 600 800 10...
2017
Reviewed August 14, 2026 · model on record in the stance chip above.
Discussion (0). Continue with ORCID to comment.