REVIEW 4 major objections 4 minor 39 references
Hot-Carrier Distribution Spectroscopy by Transconductance in Two-Dimensional Field-Effect Transistors
T0 review · 4 major / 4 minor · reviewed 2026-08-01 · deepseek-v4-flash
Pith's one-line read The transconductance of a 2D FET is a spectral transform of the carrier distribution, not a density meter — and its shape-driven term carries an anomalous peak that reads out E0, σ, nc.
desk verdict A clean, testable proposal for reading hot-carrier distribution shape from transconductance, but the 'spectroscopy' claims outrun what the model can actually constrain. read the letter →
The pith
A machine-rendered reading of the paper's core claim, the machinery that carries it, and where it could break.
The reading
What carries the argument
The load-bearing object is the spectroscopic identity g_m = (qW/L) ∫ j(E) ∂f(E;V_G)/∂V_G dE, where j(E) = v(E)T(E) is the spectral current kernel that preferentially weights high-energy carriers. The gate derivative of the distribution is what converts spectral structure into a measurable DC quantity: featureless for a Boltzmann tail, structured at E0 for a hot-carrier bump. Combined with the monotone-saturating generation amplitude α(V_G,V_D) = α_max [V_D²/(V_D²+V_c²)] [n/(n+n_c)], the bell-shaped dα/dn yields an analytically solvable peak position V_G^pk = V_th + (q/C_ox) n_c N_eq/(N_eq + α_max h(V_D) N_neq), and these explicit formulas are the bridge from a measured g_m(V_G) sweep to the
What would settle it
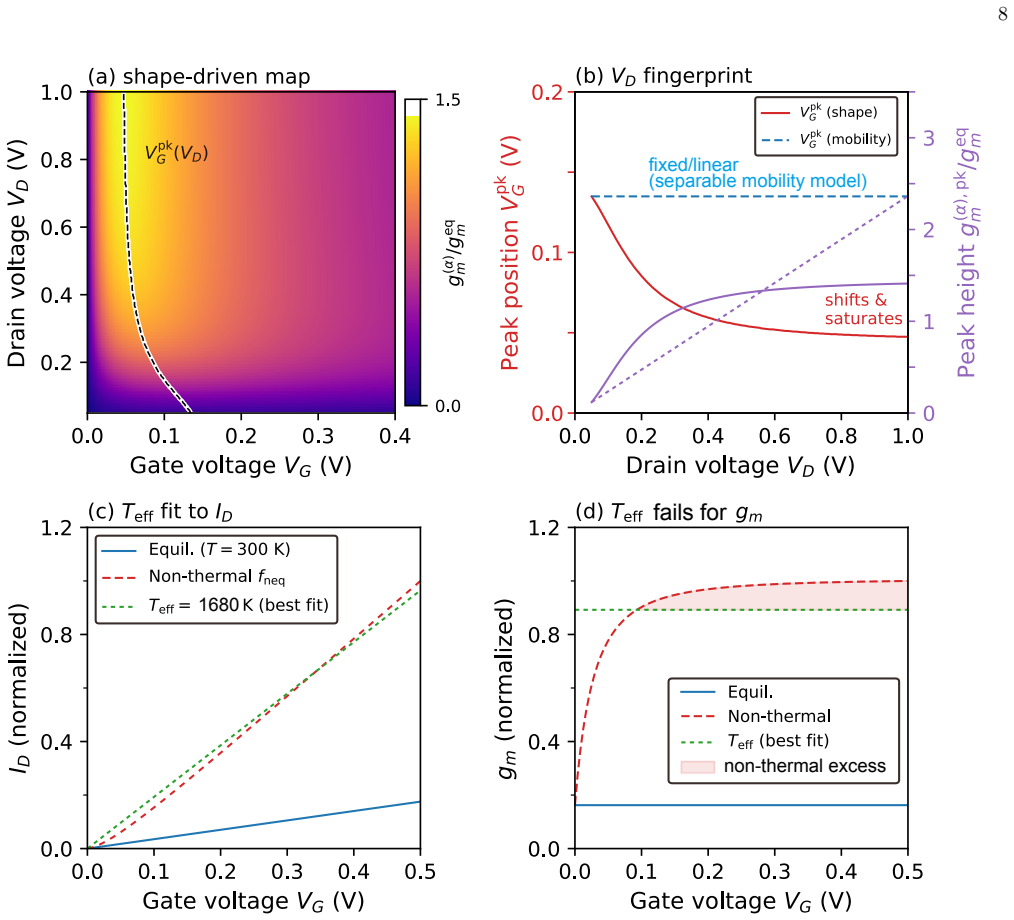
Measure g_m(V_G) at several drain voltages on a gated 2D FET, subtract the smooth density-modulation background calibrated at low V_D, and inspect the residual. The paper predicts a localized peak whose position shifts to lower V_G and whose height saturates as V_D grows; observing no peak, or a residual peak with V_D-independent position and V_D-linear height — the mobility-rolloff signature — would count against the central claim.
Extended reading notes
Core claim
The paper's central claim is that the standard reading of transconductance as a carrier-density proxy is incomplete: for a gate-independent spectral kernel j(E) = v(E)T(E), g_m equals (qW/L) times the energy integral of j(E) times the gate-voltage derivative of f(E), making it a spectral transform of the distribution shape. For a nonequilibrium distribution with a Gaussian hot-carrier excess at E0 above the transport onset, the gate derivative of f gains a bump at E0, producing a shape-driven contribution g_m^(alpha) after subtracting the smooth density background. This term peaks at V_G^pk, with the peak position encoding n_c and the spectral width sigma and the peak height sensitive to E0
Load-bearing premise
The load-bearing premise is the phenomenological saturating amplitude α = α_max [V_D²/(V_D²+V_c²)] [n/(n+n_c)] (Eq. 13): any monotone-saturating g(n) gives a peak, but the quantitative extraction of {n_c, σ, E0} from peak position and height uses this specific form, so if real hot-carrier generation is field-controlled rather than density-controlled, or fails to saturate, the predicted fingerprints would not appear.
Editorial extensions
If this is right
- Ordinary transconductance sweeps can serve as steady-state spectroscopy: after calibrating the spectral kernel in equilibrium, the residual shape term's peak position and height read out E0, σ, and n_c without any optical readout.
- The drain-voltage fingerprint — peak position decreasing with V_D, peak height saturating like V_D²/(V_D²+V_c²) — separates hot-carrier distribution shaping from quasi-equilibrium mobility rolloff, whose peak position is V_D-independent and whose height is V_D-linear.
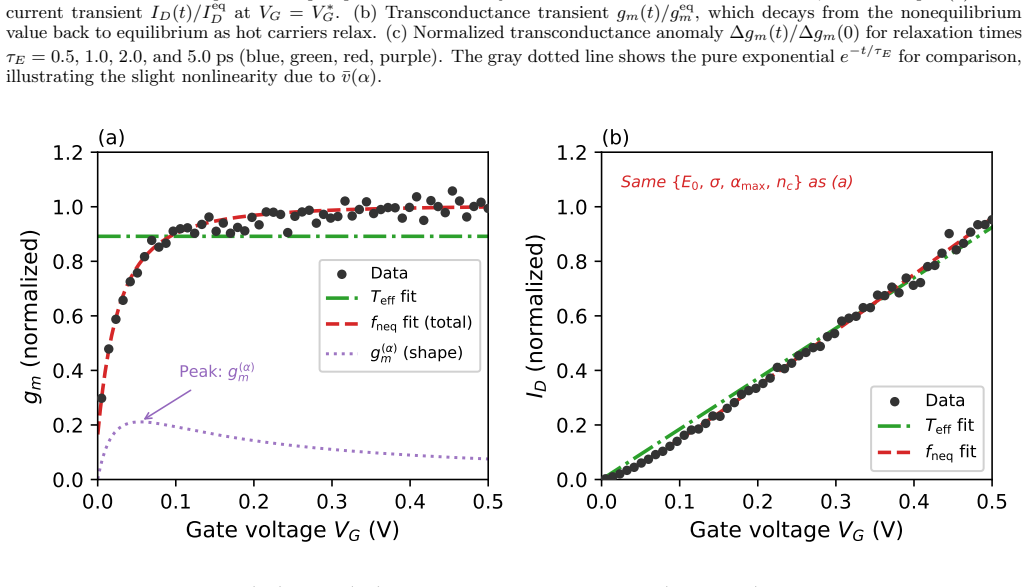
- An effective-temperature description is excluded by the same data: its best-fit flat g_m cannot reproduce the shape contribution, so a residual peak is direct evidence of a non-thermal, localized carrier population.
- The anomaly is generic: any localized nonthermal excess above the transport onset produces the same peak, and the peak position is insensitive to the transmission and saturation functional forms tested.
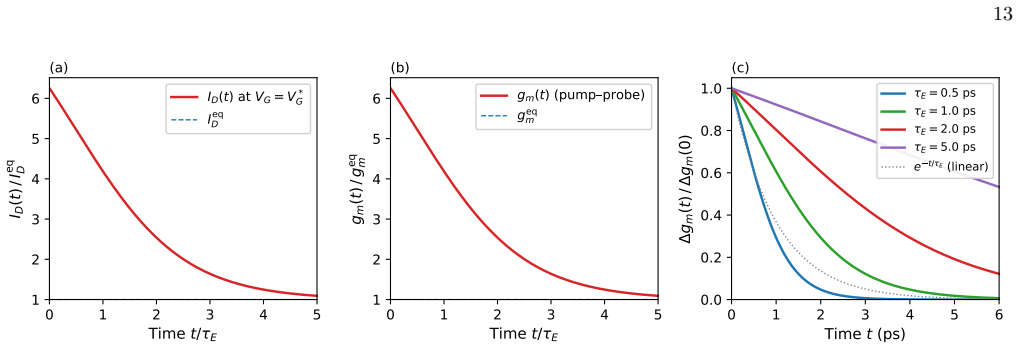
- A two-time-scale transient after pulsed excitation separates density relaxation from energy relaxation, making τ_E extractable from a single electrical transient when τ_n/τ_E is small enough.
Reading between the lines
- Beyond the paper: because the peak position is governed by α(n) while the peak height is governed by the transport kernel, one could use the measured V_D-shift of the peak to test the model's central assumption that generation saturates with density, independent of the exact kernel shape.
- Beyond the paper: if the spectroscopic identity holds across densities, archived g_m(V_G,V_D) data from devices never intended as spectrometers could be re-analyzed for hot-carrier signatures — a zero-cost test of the claim.
- Beyond the paper: the same 'derivative of a conductance resolves distribution shape' logic could be applied to spin- or valley-polarized distributions in spin-orbit-coupled 2D systems, where the shape term would act as an all-electrical readout of distribution asymmetry.
- Beyond the paper: the weakest link is the phenomenological α(n); a first-principles or Monte Carlo computation of hot-carrier generation in a specific TMD FET would either validate the saturating-density form and the quantitative extraction formulas, or show that field-controlled generation requires a modified mapping.
Signed reviews
Editorial analysis
A structured set of objections, weighed in public.
Referee Report
Summary. The paper proposes that the transconductance g_m = dI_D/dV_G of a 2D FET is a spectroscopic probe of the carrier distribution f(E), not merely a density meter. Within a model where the spectral current kernel j(E) is gate-independent, the authors derive g_m = g_m^{(n)} + g_m^{(α)}, with g_m^{(α)} arising from the gate-voltage dependence of a hot-carrier amplitude α(V_G,V_D). They adopt a phenomenological saturating form α = α_max [V_D^2/(V_D^2+V_c^2)] [n/(n+n_c)] and show that g_m^{(α)} develops a peak at a gate voltage V_G^pk whose position and height depend on the hot-carrier energy E_0, width σ, and generation crossover n_c. They further argue that the peak's drain-voltage fingerprint—position shift and height saturation with V_D—distinguishes it from conventional mobility-rolloff and effective-temperature models, and they add a transient extension to extract the energy relaxation time τ_E. The claims are supported by analytic expressions, numerical evaluations for MoS2-like parameters, and fits to synthetic data generated from the same model.
Significance. If the quantitative spectroscopy claim held, the paper would offer a valuable all-electrical route to hot-carrier distribution characterization in 2D FETs, with a falsifiable V_D fingerprint that separates shape effects from density and mobility effects. The algebraic framework is transparent, the decomposition g_m = g_m^{(n)} + g_m^{(α)} is clean, and the authors make an honest attempt at robustness checks against alternative saturation forms and transmission functions. However, the central quantitative claim—that peak position and height constrain E_0, σ, and n_c—is underdetermined by the paper's own equations, as detailed below. The manuscript contains no experimental data; all validation is synthetic and generated from the same model used for prediction, which cannot certify identifiability or model adequacy.
major comments (4)
- [Sec. III.B and Eq. (19)] The peak position does not independently constrain σ. Equation (19) gives n_pk = N_eq n_c / (N_eq + α_max h(V_D) N_neq), with N_neq ≈ σ√π. The V_D-induced shift therefore constrains only the product α_max·σ, not σ alone, unless α_max is known. The protocol in Step 3 says fitting to Eq. (19) 'extracts n_c and σ jointly,' but α_max is introduced only later in Step 4 as a remaining free parameter, making the extraction circular. Similarly, the peak height involves E_0 only through combinations with α_max and the kernel, as the paper itself admits in Sec. IV.d. The abstract's claim that the peak position and height 'constrain E_0, σ, and n_c' is therefore not supported by the presented analysis.
- [Sec. II.E, Sec. III.B, and protocol Step 1/2] Isolating g_m^(α) from a measured g_m(V_G) requires subtracting the density background g_m^(n) = (W C_ox/L) \bar{v}(α). But \bar{v}(α) depends on the same unknown α(n) via Eq. (11); the equilibrium calibration at low V_D fixes only the kernel at α=0. At high V_D the background itself is model-dependent, so the residual peak height and position depend on the assumed α(n). The synthetic-data fit in Appendix B cannot certify identifiability from real measurements because the data are generated from the same model and the background subtraction is not exercised against an independent or misspecified background.
- [Sec. II.D and Appendix C] The quantitative mapping from peak position to n_c is not robust to the functional form of α(n). Equation (13) is explicitly phenomenological, and Appendix C shows that alternative saturating forms (tanh, exponential, Hill) shift the peak position slightly and alter the peak-density prefactor. Since the exact α(n) in a real device is not derived from microscopics, the extracted n_c is a model-dependent effective parameter, not a robust spectral observable. The paper should either provide a microscopic justification for Eq. (13) or reframe the extraction as yielding only parameter combinations, with a systematic uncertainty from the unknown saturation form.
- [Sec. IV.b and Eq. (24)] The gate-dependent kernel correction is dismissed as a smooth background because it samples f(E) at E_b, not at E_0. However, g_m^(j) also contains \partial E_b/∂V_G, which is generally nonzero and V_D-dependent; its V_D dependence is asserted to be 'linear or only weakly in V_D' without a quantitative estimate. Since the discrimination between g_m^(α) and g_m^(j) rests on the V_D fingerprints, the paper should provide a concrete estimate or bound for g_m^(j)/g_m^(α) for the MoS2-like parameters, rather than relying on qualitative scaling.
minor comments (4)
- [Abstract and Sec. I] The phrase 'locking m sweeps' in the abstract appears to be a typo for 'lock-in g_m sweeps'.
- [Footnote 28] The footnote says v_T absorbs an O(1) prefactor, but the factor √2 in v(E) = √(2E/m*) is conventionally kept; this is fine, but the text should state that all reported numbers are independent of this choice, which is true because only ratios enter.
- [Sec. II.D] The idealized sharp threshold creates discontinuities at V_th that are artifacts; the paper notes this, but the accompanying figure or discussion could mention how subthreshold conduction would smooth the turn-on without affecting the peak, to avoid confusion for experimental readers.
- [Data availability] The data/code statement says 'available upon request.' For reproducibility of the synthetic fits and figures, depositing the code and data in a public repository would strengthen the paper.
Circularity Check
The anomalous-peak 'spectroscopy' is the maximum of the assumed saturating α(n) ansatz, and its validation fits synthetic data generated from the same model; the quantitative extraction of {E0, σ, nc} is therefore model-internal rather than an independent prediction.
-
self definitional
[Sec. II.D–E, Eqs. (13), (17), (19)–(20)]
"α(VG, VD) = αmax [VD²/(VD²+Vc²)] [n(VG)/(n(VG)+nc)] ... Setting d/dn[n/(An+B)²]=0 gives the exact peak density npk = B/A = Neq nc / (Neq + αmax h(VD) Nneq), and the corresponding peak gate voltage VpkG = Vth + q npk/Cox."
The headline claim is that the peak position and height extracted from g_m sweeps constrain {E0, σ, nc}. But Eq. (19) is obtained by differentiating the assumed saturating function Eq. (13); it is the maximum of that chosen ansatz and contains exactly the same {nc, αmax, σ} parameters that were inserted as phenomenological inputs. Since Nneq ≈ σ√π, the peak shift 'encodes' the assumed Gaussian width, and the peak position reports back the assumed crossover nc. Thus the quantitative spectroscopy is an inversion of the model's own parameters, not an independent first-principles prediction. The paper's own Sec. IV.d concedes the model-assisted character and that E0 is not fixed by peak height alone.
-
other
[Appendix B, Fig. 7 caption and text]
"Black circles are synthetic data generated from the full non-thermal model with 3 % Gaussian noise added (realistic noise level for transport measurements). ... The simultaneous fit over-constrains the model and demonstrates that spectral shape—not density or temperature alone—governs transport."
The validation offered for the quantitative parameter extraction is a fit to synthetic data generated from the same non-thermal model, with the same {E0, σ, αmax, nc} parameters, plus noise. Agreement is therefore guaranteed by construction; it certifies only internal consistency of the equations and code, not that a real measured g_m peak would determine {E0, σ, nc}. This is circular evidence for the central spectroscopic claim, particularly because the paper itself describes the extractions as 'model-assisted' and 'effective parameters' rather than model-independent quantities.
full rationale
The general identity g_m = (qW/L)∫j(E) ∂f(E;VG)/∂VG dE (Eq. 15) is simply the derivative of a spectral current integral and is not circular. The paper's self-citations, refs. [25]–[27], are contextual related work and are not load-bearing; no uniqueness theorem is imported and no ansatz is smuggled in via citation. The circularity resides in the quantitative 'spectroscopy' claim: the anomalous peak g_m^(α) is produced by differentiating the assumed saturating amplitude α(n) of Eq. (13), so Eq. (19)'s peak position is the maximum of that assumed function. Calling this peak a readout of {nc, σ, E0} is an inversion of parameters that were introduced as the phenomenological model, and the paper admits E0 enters only together with α_max and the kernel. The Appendix B fit to synthetic data generated by the same model is circular validation: it cannot establish identifiability from real devices. The qualitative existence of a peak is robust to the choice of saturating α(n) (Appendix C), so the paper has some independent qualitative content; however, the central quantitative extraction that constitutes the headline is model-internal. Score 6 reflects one or more predictions reducing by construction, without a self-citation chain.
Assumptions & free parameters
free parameters (7)
- E_b (transport-kernel onset energy) =
50 meV
- Δ (kernel broadening) =
20 meV
- α_max (hot-carrier saturation amplitude) =
0.80
- n_c (hot-carrier generation crossover density) =
2.0×10^12 cm^-2
- V_c (drain-voltage crossover) =
0.30 V
- E_0 (hot-carrier energy) =
250 meV
- σ (hot-carrier Gaussian width) =
40 meV
assumptions (5)
- standard math The drain current is an energy integral over a spectral current kernel: I_D = (qW/L)∫D(E)v(E)T(E)f(E)dE (Eq. 3).
- domain assumption Gate-independent spectral kernel: ∂j(E)/∂V_G = 0 (Sec. II.E).
- domain assumption Nondegenerate Boltzmann statistics (Eqs. 6–7) over the modeled gate range.
- ad hoc to paper Hot-carrier amplitude saturates with density: α = α_max h(V_D) n/(n+n_c) (Eq. 13).
- standard math Gaussian integral N_neq ≈ σ√π for E_0 ≫ σ.
Cite this review
Pith. "Pith review of Hot-Carrier Distribution Spectroscopy by Transconductance in Two-Dimensional Field-Effect Transistors." pith.science (2026). https://pith.science/paper/4CRIKGQM
@misc{pith2026260715578,
  author       = {Pith},
  title        = {Pith review of: Hot-Carrier Distribution Spectroscopy by Transconductance in Two-Dimensional Field-Effect Transistors},
  year         = {2026},
  howpublished = {\url{https://pith.science/paper/4CRIKGQM}},
  note         = {Machine review of arXiv:2607.15578}
}
abstract
The transconductance $g_m = dI_D/dV_G$ of a field-effect transistor (FET) is conventionally read as a proxy for carrier density. We show that it is instead a spectroscopic probe of the carrier distribution: because $g_m$ weights the spectral current $j(E)$ by the gate-voltage derivative $\partial f(E)/\partial V_G$ and integrates over energy, it is sensitive to the \emph{shape} of $f(E)$, not merely its integrated weight $n$. We develop an energy-resolved transport framework for two-dimensional (2D) FETs and, within a gate-independent spectral-kernel approximation, derive the decomposition $g_m = g_m^{(n)} + g_m^{(\alpha)}$ into the conventional density-modulation term $g_m^{(n)}$ and a distribution-shape-driven term $g_m^{(\alpha)}$. The latter, obtained as the residual after subtracting the smooth density-modulation background from the measured $g_m$, exhibits a characteristic anomalous peak at a gate voltage $V_G^{\rm pk}$. This peak has no counterpart in equilibrium transport and \emph{cannot be explained by carrier density modulation alone}. With the spectral kernel calibrated, the peak position and height -- extracted from standard DC/lock-in $g_m$ sweeps -- constrain the hot-carrier energy $E_0$, spectral width $\sigma$, and generation threshold $n_c$, realizing a steady-state, all-electrical spectroscopy of the carrier distribution. An optional time-resolved extension further recovers the carrier relaxation time $\tau$ from the transient response following a pump excitation, establishing the 2D FET as a distribution-function spectrometer that requires no optical readout.
Figures


Figures from the paper (5 more)


Reference graph
Works this paper leans on
-
[1]
(13) uses the saturating formg(n) =n/(n+n c)
Saturation functionα(n) The phenomenological amplitude of Eq. (13) uses the saturating formg(n) =n/(n+n c). The anomalous peak in the shape-driven transconductance does not rely on this specific choice: any monotonically saturat- ingg(n) gives a bell-shapeddα/dnand hence a local- izedg (α) m peak. Figure 8(a,b) compares four represen- tative forms—the bas...
-
[2]
T ransmissionT(E) The main text models the transmission by the Fermi- function barrier of Eq. (5). The anomaly does not rely on this form either. The shape-driven term en- ters through the spectral current momentsJ eq,neq =R j(E)f eq,neq(E)dEwithj(E) =v(E)T(E), and its sign and localization require only that the hot-carrier com- ponent atE 0 > Eb be trans...
-
[3]
K. F. Mak, C. Lee, J. Hone, J. Shan, and T. F. Heinz, Atomically thin MoS 2: a new direct-gap semiconductor, Phys. Rev. Lett.105, 136805 (2010)
2010
-
[4]
Q. H. Wang, K. Kalantar-Zadeh, A. Kis, J. N. Coleman, and M. S. Strano, Electronics and optoelectronics of two- dimensional transition metal dichalcogenides, Nat. Nan- 15 otechnol.7, 699 (2012)
2012
-
[5]
Chhowalla, H
M. Chhowalla, H. S. Shin, G. Eda, L.-J. Li, K. P. Loh, and H. Zhang, The chemistry of two-dimensional layered transition metal dichalcogenide nanosheets, Nat. Chem. 5, 263 (2013)
2013
-
[6]
Radisavljevic, A
B. Radisavljevic, A. Radenovic, J. Brivio, V. Giacometti, and A. Kis, Single-layer MoS2 transistors, Nat. Nanotech- nol.6, 147 (2011)
2011
-
[7]
K. Kang, S. Xie, L. Huang, Y. Han, P. Y. Huang, K. F. Mak, C.-J. Kim, D. Muller, and J. Park, High-mobility three-atom-thick semiconducting films with wafer-scale homogeneity, Nature520, 656 (2015)
2015
-
[8]
Liao, Y.-C
L. Liao, Y.-C. Lin, M. Bao, R. Cheng, J. Bai, Y. Liu, Y. Qu, K. L. Wang, Y. Huang, and X. Duan, High-speed graphene transistors with a self-aligned nanowire gate, Nature467, 305 (2010)
2010
Show all 39 references
-
[9]
L. Li, Y. Yu, G. J. Ye, Q. Ge, X. Ou, H. Wu, D. Feng, X. H. Chen, and Y. Zhang, Black phosphorus field-effect transistors, Nat. Nanotechnol.9, 372 (2014)
2014
-
[10]
Fiori, F
G. Fiori, F. Bonaccorso, G. Iannaccone, T. Pala- cios, D. Neumaier, A. Seabaugh, S. K. Banerjee, and L. Colombo, Electronics based on two-dimensional ma- terials, Nat. Nanotechnol.9, 768 (2014)
2014
-
[11]
W. Li, H. Shen, H. Qiu, Y. Shi, and X. Wang, Two- dimensional semiconductor transistors and integrated circuits for advanced technology nodes, Natl. Sci. Rev. 11, nwae001 (2024)
2024
-
[12]
Chen, M.-Y
J. Chen, M.-Y. Sun, Z.-H. Wang, Z. Zhang, K. Zhang, S. Wang, Y. Zhang, X. Wu, T.-L. Ren, H. Liu, and L. Han, Performance limits and advancements in sin- gle 2d transition metal dichalcogenide transistor, Nano- Micro Lett.16, 264 (2024)
2024
-
[13]
S. M. Sze and K. K. Ng,Physics of Semiconductor De- vices, 3rd ed. (Wiley-Interscience, Hoboken, NJ, 2007)
2007
-
[14]
Lundstrom,Fundamentals of Carrier Transport, 2nd ed
M. Lundstrom,Fundamentals of Carrier Transport, 2nd ed. (Cambridge University Press, Cambridge, 2000)
2000
-
[15]
Datta,Electronic Transport in Mesoscopic Systems (Cambridge University Press, Cambridge, 1995)
S. Datta,Electronic Transport in Mesoscopic Systems (Cambridge University Press, Cambridge, 1995)
1995
-
[16]
Massicotte, G
M. Massicotte, G. Soavi, A. Principi, and K.-J. Tiel- rooij, Hot carriers in graphene—fundamentals and ap- plications, Nanoscale13, 8376 (2021)
2021
-
[17]
Sun, Z.-K
D. Sun, Z.-K. Wu, C. Divin, X. Li, C. Berger, W. A. de Heer, P. N. First, and T. B. Norris, Ultrafast relax- ation of excited Dirac fermions in epitaxial graphene us- ing optical differential transmission spectroscopy, Phys. Rev. Lett.101, 157402 (2008)
2008
-
[18]
E. A. A. Pogna, M. Marsili, D. De Fazio, S. Dal Conte, C. Manzoni, D. Sangalli, D. Yoon, A. Lombardo, A. C. Ferrari, A. Marini, G. Cerullo, and D. Prezzi, Photo- induced bandgap renormalization governs the ultrafast response of single-layer MoS 2, ACS Nano10, 1182 (2016)
2016
-
[19]
H. Shi, R. Yan, S. Bertolazzi, J. Brivio, B. Gao, A. Kis, D. Jena, H. G. Xing, and L. Huang, Exciton dynamics in suspended monolayer and few-layer MoS2 2D crystals, ACS Nano7, 1072 (2013)
2013
-
[20]
W. Y. Wang, N. Sui, X. C. Chi, Z. H. Kang, Q. Zhou, L. Li, H. Z. Zhang, J. B. Gao, and Y. H. Wang, Investiga- tion of hot carrier cooling dynamics in monolayer mos 2, J. Phys. Chem. Lett.12, 861 (2021)
2021
-
[21]
W. Lee, Y. Lin, L.-S. Lu, W.-C. Chueh, M. Liu, X. Li, W.-H. Chang, R. A. Kaindl, and C.-K. Shih, Time- resolved arpes determination of a quasi-particle band gap and hot electron dynamics in monolayer mos2, Nano Lett. 21, 7363 (2021)
2021
-
[22]
B¨ uttiker, Four-terminal phase-coherent conductance, Phys
M. B¨ uttiker, Four-terminal phase-coherent conductance, Phys. Rev. Lett.57, 1761 (1986)
1986
-
[23]
G. D. Mahan and J. O. Sofo, The best thermoelectric, Proc. Natl. Acad. Sci. U.S.A.93, 7436 (1996)
1996
-
[24]
Tersoff and D
J. Tersoff and D. R. Hamann, Theory of the scanning tunneling microscope, Phys. Rev. B31, 805 (1985)
1985
-
[25]
L. P. Kouwenhoven, D. G. Austing, and S. Tarucha, Few- electron quantum dots, Rep. Prog. Phys.64, 701 (2001)
2001
-
[26]
Pothier, S
H. Pothier, S. Gu´ eron, N. O. Birge, D. Esteve, and M. H. Devoret, Energy distribution function of quasiparticles in mesoscopic wires, Phys. Rev. Lett.79, 3490 (1997)
1997
-
[27]
Wakabayashi, S
K. Wakabayashi, S. Adhikary, and T. Kameda, Transcon- ductance as a probe of valley thermodynamics in multilayer WSe 2, Phys. Rev. B (2026), in press, arXiv:2605.19212 [cond-mat.mes-hall]
2026 arXiv
-
[28]
Wakabayashi, S
K. Wakabayashi, S. Adhikary, and K. Tsukagoshi, Valley engineering in bilayer WSe 2 gate-all-around transistors (2026), arXiv:2606.08955 [cond-mat.mes-hall]
2026 arXiv
-
[29]
Wakabayashi, Electrical spectroscopy of intervalley relaxation in WSe 2 transistors (2026), arXiv:2606.10470 [cond-mat.mes-hall]
K. Wakabayashi, Electrical spectroscopy of intervalley relaxation in WSe 2 transistors (2026), arXiv:2606.10470 [cond-mat.mes-hall]
2026 arXiv
-
[30]
The exact group velocity of the 2D parabolic band is v(E) = p 2E/m∗; here we absorb theO(1) numeri- cal prefactor (the √ 2 and the angular average of the transport-direction component) into the definition ofv T , since only the √ Eenergy dependence enters the spec- tral shape—...
-
[31]
K. K. H. Smithe, C. D. English, S. V. Suryavanshi, and E. Pop, High-field transport and velocity saturation in synthetic monolayer mos2, Nano Lett.18, 4516 (2018)
2018
-
[32]
M. A. Wang and E. Pop, Monte carlo simulation of elec- trical transport with joule heating and strain in mono- layer mos2 devices, Nano Lett.25, 6841 (2025)
2025
-
[33]
Allain, J
A. Allain, J. Kang, K. Banerjee, and A. Kis, Electrical contacts to two-dimensional semiconductors, Nat. Mater. 14, 1195 (2015)
2015
-
[34]
Kaasbjerg, K
K. Kaasbjerg, K. S. Thygesen, and K. W. Jacobsen, Phonon-limited mobility in n-type single-layer mos2 from first principles, Phys. Rev. B85, 115317 (2012)
2012
-
[35]
J. A. Kash, J. C. Tsang, and J. M. Hvam, Subpicosec- ond time-resolved Raman spectroscopy of LO phonons in GaAs, Phys. Rev. Lett.54, 2151 (1985)
1985
-
[36]
P.-C. Shen, C. Su, Y. Lin, A.-S. Chou, C.-C. Cheng, J.-H. Park, M.-H. Chiu, A.-Y. Lu, H.-L. Tang, M. M. Tavakoli, G. Pitner, X. Ji, Z. Cai, N. Mao, J. Wang, V. Tung, J. Li, J. Bokor, A. Zettl, C.-I. Wu, T. Palacios, L.-J. Li, and J. Kong, Ultralow contact resistance between se...
2021
-
[37]
M. Du, W. Li, G. Xiong, C. Zhao, F. Hou, W. Gan, X. Gong, N. Zou, L. Liu, X. Zou, T. Li, W. Sun, D. Fan, Z. Yu, X. Tu, Y. Gao, H. Shen, H. Qiu, L. Ma, J. Wang, Y. Nie, L. Tao, J.-B. Xu, J. Lin, J. Xu, Y. Shi, and X. Wang, Scaled crystalline antimony ohmic contacts for two-dime...
2025
-
[38]
Kumar, J
N. Kumar, J. He, D. He, Y. Wang, and H. Zhao, Charge carrier dynamics in bulk MoS 2 crystal studied by tran- sient absorption microscopy, J. Appl. Phys.113, 133702 (2013)
2013
-
[39]
Massicotte, P
M. Massicotte, P. Schmidt, F. Vialla, K. G. Sch¨ adler, A. Reserbat-Plantey, K. Watanabe, T. Taniguchi, K. J. 16 Tielrooij, and F. H. L. Koppens, Picosecond photore- sponse in van der Waals heterostructures, Nat. Nanotech- nol.11, 42 (2016)
2016
Reviewed August 1, 2026 · model on record in the stance chip above.
Discussion (0). Continue with ORCID to comment.