REVIEW 3 major objections 6 minor 1 cited by
ST-Hyper: Learning High-Order Dependencies Across Multiple Spatial-Temporal Scales for Multivariate Time Series Forecasting
T0 review · 3 major / 6 minor · reviewed 2026-08-05 · deepseek-v4-flash
Pith's one-line read ST-Hyper claims that multivariate forecast accuracy improves when high-order dependencies are modeled across combined spatial-temporal scales, not just spatial and temporal scales separately.
desk verdict Plausible new architecture with honest ablations, but the headline SOTA margins are built on mixed-protocol baseline numbers and should be treated as approximate until the quoted baselines are rerun under a common protocol. read the letter →
The pith
A machine-rendered reading of the paper's core claim, the machinery that carries it, and where it could break.
The reading
What carries the argument
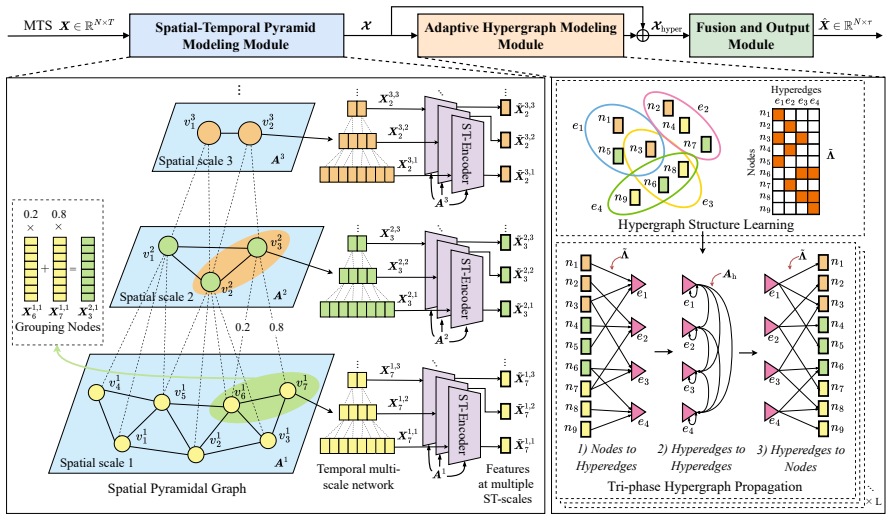
The central object is an adaptive sparse hypergraph built over features from multiple ST-scales. A hyperedge can connect more than two nodes; here each node is a feature at one specific spatial-temporal scale, and the incidence matrix is learned and then sparsified by keeping only the top-K' weights per hyperedge. Tri-phase propagation then moves information from nodes to hyperedges, between hyperedges through a learned graph with graph attention, and back from hyperedges to nodes, allowing high-order group-wise dependencies across scales to influence the final forecast.
What would settle it
Rerun all starred baselines under the protocol described in Section 5.1 (same datasets, 7:1:2 chronological split, same input and output lengths, same MAE/MSE definitions) and recompute the average reductions; if the 3.8% and 6.8% margins shrink to noise or reverse, the central claim is unsupported. A complementary check: on a synthetic MTS with planted cross-ST-scale dependencies, test whether the learned sparse hypergraph recovers the planted hyperedges; if not, the mechanism may not be what drives the gains.
Extended reading notes
Core claim
ST-Hyper claims that dependencies which jointly span spatial and temporal scope (ST-scales) exist in real-world multivariate time series and are not captured when spatial and temporal scales are modeled separately. To capture them, the model first builds a spatial pyramid: memory-network-learned graphs coarsen variables into groups at several spatial scales, while temporal multi-scale convolution and patchification produce features at several temporal scales for each spatial scale, yielding a set of features at JxK combined scales. Over these features it learns a sparse hypergraph, where each hyperedge connects a small group of the most correlated features, and then runs tri-phase propagatio
Load-bearing premise
The state-of-the-art claim assumes every baseline marked with an asterisk was evaluated under the exact same chronological 7:1:2 split, input length, and metrics as the numbers ST-Hyper reports; if the quoted numbers came from different protocols, the 3.8% and 6.8% average MAE reductions are not a fair comparison.
Editorial extensions
If this is right
- If the reported results hold, forecasting systems for traffic, air quality, weather, electricity, and solar power should adopt features defined on joint ST-scales rather than treating spatial and temporal scales independently.
- The sparse hypergraph's top-K' incidence matrix means only the most correlated cross-scale features interact, which should make the model more robust to noise; the paper reports MSE improvements of 5.12–20.20% under increasing Gaussian noise.
- The graph pooling loss with entropy regularization implies variables with similar temporal dynamics are grouped, even when geographically distant, so forecasts for one variable can be informed by distant but dynamically similar variables.
- Because the same architecture serves both long-term (MLP output) and short-term (GCRU output) forecasting, the multi-ST-scale feature extraction is presented as a general backbone rather than a task-specific fix.
Reading between the lines
- Inference: The fixed learned hypergraph may miss non-stationary cross-ST-scale dependencies over very long horizons; a time-varying incidence matrix would be a natural test of whether adaptivity is the active ingredient (the paper lists dynamic hypergraph evolution only as future work).
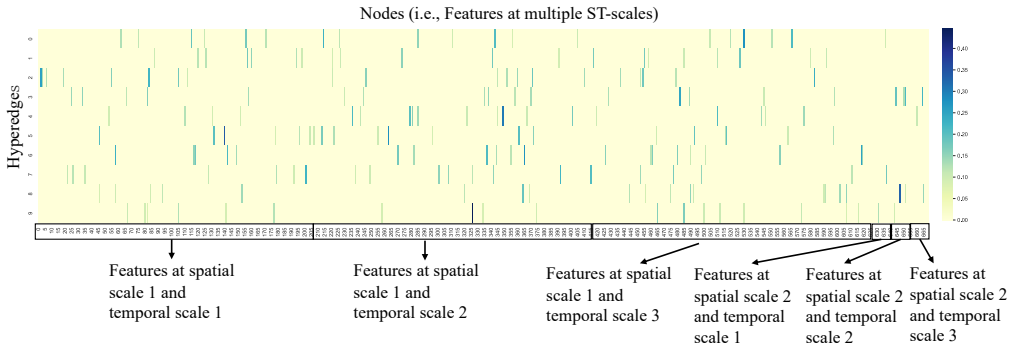
- Inference: The hypergraph's membership patterns could be read as an interpretable signature of which joint scales matter for a dataset (e.g., city-day vs country-season), but the paper only visualizes incidence, it does not quantify this; a follow-up could test whether the learned hyperedges align with known meteorological or traffic regimes.
- Inference: Because the spatial pyramid shrinks the variable count before building the hypergraph and keeps hyperedges sparse, the approach might scale to datasets with tens of thousands of variables, like high-resolution sensor networks; the paper's single high-dimensional experiment (3,850 variables) hints at this but does not establish it.
- Inference: The same tri-phase propagation could apply to other domains where events unfold at joint region-time scales, such as epidemic spread or energy-grid load; nothing in the method is specific to the six datasets tested.
Editorial analysis
A structured set of objections, weighed in public.
Referee Report
Summary. The paper proposes ST-Hyper, a multivariate time series forecaster that combines a spatial-temporal pyramid (STPM) to extract features at multiple joint spatial-temporal scales with an adaptive sparse hypergraph module (AHM) and a tri-phase hypergraph propagation mechanism. The authors claim state-of-the-art performance on six datasets, reporting average MAE reductions of 3.8% for long-term forecasting, 6.8% for short-term forecasting, and 2.5% against STGNN baselines. The main evidence is in Tables 3-5, supported by ablations, robustness checks, hyperparameter sensitivity, and computation cost comparisons. The central claim is empirical: ST-Hyper's combination of multi-ST-scale feature extraction and adaptive high-order hypergraph dependencies is said to outperform existing methods.
Significance. If the empirical claim survives a strict fair-comparison check, ST-Hyper is a meaningful contribution to MTS forecasting: the joint modeling of spatial and temporal scales is genuinely under-addressed, and the ablation results suggest both the pyramid and the adaptive hypergraph components contribute. Credit is due for providing a public code link, reporting five-seed averages, including robustness analysis, and giving a fairly detailed ablation and hyperparameter study. The architecture is plausible and internally consistent at the level of the derivations. The main weaknesses are empirical comparability and statistical support, not internal inconsistency.
major comments (3)
- [§5.1/§5.2, Tables 3 and 5] The headline SOTA claim is computed from a mixture of quoted and rerun baseline numbers. Section 5.2 states that entries marked * are 'sourced from iTransformer [20] or their original publications' (and from STAFormer for Table 5), while the paper's own protocol is a 7:1:2 chronological split applied to all datasets. A quoted number is comparable only if the original paper used the same split, normalization, input/output lengths, and metric definitions; the text does not establish this. For example, MSHyper and iTransformer are quoted on Electricity but rerun on Solar/Temperature, so a systematic protocol shift cannot be ruled out. The average reductions of 3.8%, 6.8%, and 2.5% include these quoted cells; even a single tie at Electricity horizon 720 (MAE 0.316 for both ST-Hyper and quoted MSHyper) shows how sensitive the margin is. Please rerun all baselines under the exact protocol used
- [§5.1 'Training Details' and §5.2 'Main Results'] The experiments are run five times with different seeds, but Tables 3-5 report only averages, without standard deviations, confidence intervals, or significance tests. Several margins in the tables are small (e.g., the Electricity horizon-720 MAE tie with MSHyper; the Solar horizon-96 MSE of 0.185 vs 0.195 for TimeMixer). Without variance information, the claimed average improvements of 3.8% and 6.8% cannot be distinguished from run-to-run noise. For at least the headline comparisons, please report standard deviations for ST-Hyper and for any rerun baselines, and perform paired significance tests where possible.
- [Related Work, §5.2, and refs [24,25]] Ada-MSHyper is arguably the closest adaptive multi-scale hypergraph method to ST-Hyper and is cited as related work (ref [25]), but it is not included in any comparison table. Since the paper claims SOTA over methods that model multi-scale or high-order dependencies, the omission of this direct adaptive-hypergraph baseline leaves a gap in the empirical support for the novelty claim. If the Ada-MSHyper code is not publicly available or cannot be run under the paper's protocol, that should be stated explicitly; otherwise it should be added to Tables 3 and/or 4.
minor comments (6)
- [Eq. (4)] The graph pooling loss is written as 'L_GP = L_LP + L_E = || A^j_dtw, S^j(S^j)^T ||_F + ...'; the comma inside the norm is confusing and likely should be a minus sign, i.e., || A^j_dtw - S^j(S^j)^T ||_F. Please also define n and P explicitly in the text.
- [Eq. (17)] The product index l=0 uses S_0, which is never defined; the intended range is likely l=1,...,j-1. Also, X_fused is said to be in R^{N1 x D_e} while the O_j it is built from have dimension D; please reconcile the notation.
- [§4.2, Eq. (9)] In Eq. (9), X^{j,k}_en is said to be in R^{N x D}, but at spatial scale j the feature should have N_j rows, not N. This appears to be a typo, since the subsequent equations use N_j.
- [Tables 3-5] There are several typographical issues: 'MSHyer' should be 'MSHyper' (Tables 3 and 4), 'META-LA' should be 'METR-LA' (Table 5 heading), and 'Hierachical' should be 'Hierarchical' (Table 5). Please correct these.
- [§5.2] The phrase 'average MAE reduction' is not formally defined: is it the mean of per-dataset, per-horizon relative reductions, or the aggregate over all cells? And relative to the best baseline per cell or to an overall best baseline? Please state the exact formula so the 3.8%, 6.8%, and 2.5% figures are reproducible.
- [§5.6 and Figure 3] The computational cost comparison reports only one training-time point per method. Since training time and memory can be configuration-dependent, please specify the exact hardware, batch size, and early-stopping settings used for the baselines in this comparison.
Circularity Check
No significant circularity: the SOTA claim rests on held-out test evaluation; self-citations (MSHyper, GAGNN) are baselines/prior components, not load-bearing reductions.
full rationale
The paper's derivation chain is architectural: STPM extracts multi-ST-scale features, AHM learns a sparse incidence matrix and propagates via tri-phase hypergraph updates, and a fusion/output module maps representations to forecasts. No equation defines a predicted quantity in terms of itself, and no fitted constant is renamed as a prediction. The headline MAE reductions (3.8%/6.8%) are empirical results on a 7:1:2 chronological split (Section 5.1), with the model trained on the training portion and evaluated on the test portion; hyperparameters in Table 2 are selected by validation performance, not by fitting the test set. The closest baselines (MSHyper, GAGNN) are prior works by the same group, but they are used as external comparison points and as sources of standard components (multi-scale temporal hypergraph features, graph pooling regularization), not as the justification for the central claim. The paper does not invoke a uniqueness theorem, nor does it smuggle in an ansatz solely via self-citation. The only substantive concern is the mixed provenance of starred baseline numbers in Tables 3 and 5, which are quoted from iTransformer, STAFormer, or original publications rather than rerun under the exact protocol; this is a benchmarking-fairness risk, not circularity. The central architecture and its evaluation remain self-contained against external benchmarks, so no circular step is present.
Assumptions & free parameters
free parameters (7)
- Spatial graph pooling ratio q =
10 / 20 / 20 / 20 / 20 / 30 (per dataset)
- Number of spatial scales J =
2 / 2 / 2 / 2 / 2 / 3
- Patch length r =
2 / 2 / 16 / 8 / 16 / 16
- Number of temporal scales K =
3 for all datasets
- Number of selected hyperedge members K' =
20 / 20 / 20 / 10 / 10 / 20
- Balancing factor lambda =
1e-1 / 1e-1 / 1e-2 / 1e-2 / 1e-2 / 1e-2
- Architectural hyperparameters =
hidden dim 64, memory items 20, memory dim 32, hyperedges 40, AHM layers 1
assumptions (4)
- domain assumption DTW distance over the entire training time range is a stable proxy for inter-variate correlation that remains valid on future test windows
- domain assumption Features extracted at different ST-scales can be represented as a sparse hypergraph where each hyperedge groups up to K' most correlated features, and this grouping captures high-order dependencies
- standard math GCRU, GAT, memory network, and attention components behave as in their source papers and are composable as described
- ad hoc to paper The graph pooling loss (Laplacian preservation plus entropy) encourages useful non-overlapping grouping without discarding predictive information
Cite this review
Pith. "Pith review of ST-Hyper: Learning High-Order Dependencies Across Multiple Spatial-Temporal Scales for Multivariate Time Series Forecasting." pith.science (2026). https://pith.science/paper/4FCMBXGO
@misc{pith2026250902217,
  author       = {Pith},
  title        = {Pith review of: ST-Hyper: Learning High-Order Dependencies Across Multiple Spatial-Temporal Scales for Multivariate Time Series Forecasting},
  year         = {2026},
  howpublished = {\url{https://pith.science/paper/4FCMBXGO}},
  note         = {Machine review of arXiv:2509.02217}
}
read the original abstract
In multivariate time series (MTS) forecasting, many deep learning based methods have been proposed for modeling dependencies at multiple spatial (inter-variate) or temporal (intra-variate) scales. However, existing methods may fail to model dependencies across multiple spatial-temporal scales (ST-scales, i.e., scales that jointly consider spatial and temporal scopes). In this work, we propose ST-Hyper to model the high-order dependencies across multiple ST-scales through adaptive hypergraph modeling. Specifically, we introduce a Spatial-Temporal Pyramid Modeling (STPM) module to extract features at multiple ST-scales. Furthermore, we introduce an Adaptive Hypergraph Modeling (AHM) module that learns a sparse hypergraph to capture robust high-order dependencies among features. In addition, we interact with these features through tri-phase hypergraph propagation, which can comprehensively capture multi-scale spatial-temporal dynamics. Experimental results on six real-world MTS datasets demonstrate that ST-Hyper achieves the state-of-the-art performance, outperforming the best baselines with an average MAE reduction of 3.8\% and 6.8\% for long-term and short-term forecasting, respectively.
Figures


Figures from the paper (3 more)


Forward citations
Cited by 1 Pith paper
-
MillGNN: Learning Multi-Scale Lead-Lag Dependencies for Multi-Variate Time Series Forecasting
MillGNN learns delayed (lead-lag) influences between time series and between groups of series at multiple grouping scales, reporting state-of-the-art forecast errors on 11 benchmarks.
Reference graph
Works this paper leans on
-
[20]
Yong Liu, Tengge Hu, Haoran Zhang, Haixu Wu, Shiyu Wang, Lintao Ma, and Mingsheng Long. 2024. iTransformer: Inverted Transformers are effective for time series forecasting. In Proceedings of the International Conference on Learning Representations
work page 2024
-
[25]
Xihao Piao, Zheng Chen, Taichi Murayama, Yasuko Matsubara, and Yasushi Saku- rai. 2024. Fredformer: Frequency debiased transformer for time series forecasting. In Proceedings of the 30th ACM SIGKDD Conference on Knowledge Discovery and Data Mining. Association for Computing Machinery, 2400–2410
2024
-
[1]
Lei Bai, Lina Yao, Can Li, Xianzhi Wang, and Can Wang. 2020. Adaptive graph convolutional recurrent network for traffic forecasting. In Proceedings of the International Conference on Neural Information Processing Systems . 17804–17815
work page 2020
-
[2]
Song Bai, Feihu Zhang, and Philip HS Torr. 2021. Hypergraph convolution and hypergraph attention. Pattern Recognition 110 (2021), 107637
work page 2021
-
[3]
Jing Bi, Xiang Zhang, Haitao Yuan, Jia Zhang, and MengChu Zhou. 2021. A hybrid prediction method for realistic network traffic with temporal convolutional network and LSTM. IEEE Transactions on Automation Science and Engineering 19 (2021), 1869–1879
work page 2021
-
[4]
Wanlin Cai, Yuxuan Liang, Xianggen Liu, Jianshuai Feng, and Yuankai Wu. 2024. MSGNet: Learning multi-scale inter-series correlations for multivariate time series forecasting. In Proceedings of the AAAI Conference on Artificial Intelligence . 11141–11149
work page 2024
-
[5]
Ling Chen, Donghui Chen, Zongjiang Shang, Binqing Wu, Cen Zheng, Bo Wen, and Wei Zhang. 2023. Multi-scale adaptive graph neural network for multivariate time series forecasting. IEEE Transactions on Knowledge and Data Engineering 35 (2023), 10748–10761
work page 2023
-
[6]
Ling Chen, Jiahui Xu, Binqing Wu, and Jianlong Huang. 2023. Group-aware graph neural network for nationwide city air quality forecasting. ACM Transactions on Knowledge Discovery from Data 18 (2023), 1–20
work page 2023
Show all 49 references
-
[7]
Andrea Cini, Danilo Mandic, and Cesare Alippi. 2024. Graph-based time series clustering for end-to-end hierarchical forecasting. In Proceedings of the Interna- tional Conference on Machine Learning . 8985–8999
2024
-
[8]
Kan Guo, Yongli Hu, Yanfeng Sun, Sean Qian, Junbin Gao, and Baocai Yin. 2021. Hierarchical graph convolution network for traffic forecasting. In Proceedings of the AAAI Conference on Artificial Intelligence . 151–159
2021
-
[9]
Qihe Huang, Lei Shen, Ruixin Zhang, Shouhong Ding, Binwu Wang, Zhengyang Zhou, and Yang Wang. 2023. CrossGNN: Confronting noisy multivariate time se- ries via cross interaction refinement. InProceedings of the International Conference on Neural Information Processing Systems ....
2023
-
[10]
Xu Huang, Chuyao Luo, Bowen Zhang, Huiwei Lin, Xutao Li, and Yunming Ye. 2024. iTrendRNN: An interpretable trend-aware RNN for meteorological spatiotemporal Prediction. In Proceedings of the AAAI Conference on Artificial Intelligence. AAAI Press, 22132–22140
2024
-
[11]
Jiawei Jiang, Chengkai Han, Wayne Xin Zhao, and Jingyuan Wang. 2023. PDFormer: Propagation delay-aware dynamic long-range transformer for traffic flow prediction. In Proceedings of the AAAI Conference on Artificial Intelligence , Vol. 37. 4365–4373
2023
-
[12]
Renhe Jiang, Zhaonan Wang, Jiawei Yong, Puneet Jeph, Quanjun Chen, Ya- sumasa Kobayashi, Xuan Song, Shintaro Fukushima, and Toyotaro Suzumura
-
[13]
Guokun Lai, Wei-Cheng Chang, Yiming Yang, and Hanxiao Liu. 2018. Modeling long-and short-term temporal patterns with deep neural networks. In Proceed- ings of the International ACM SIGIR Conference on Research and Development in Information Retrieval. 95–104
2018
-
[14]
Rosenblum, and Roger Zimmermann
Yuxuan Liang, Kun Ouyang, Yiwei Wang, Zheyi Pan, Yifang Yin, Hongyang Chen, Junbo Zhang, Yu Zheng, David S. Rosenblum, and Roger Zimmermann. 2023. Mixed-Order Relation-Aware Recurrent Neural Networks for Spatio-Temporal Forecasting. IEEE Transactions on Knowledge and Data Engi...
2023
-
[15]
Yuxuan Liang, Kun Ouyang, Yiwei Wang, Zheyi Pan, Yifang Yin, Hongyang Chen, Junbo Zhang, Yu Zheng, David S Rosenblum, and Roger Zimmermann
-
[16]
Yuxuan Liang, Yutong Xia, Songyu Ke, Yiwei Wang, Qingsong Wen, Junbo Zhang, Yu Zheng, and Roger Zimmermann. 2023. AirFormer: Predicting nationwide air quality in China with transformers. In Proceedings of the AAAI Conference on Artificial Intelligence. 14329–14337
2023
-
[17]
IEEE Transactions on Knowledge and Data Engineering 35, 9 (2023), 9254–9268
Mixed-order relation-aware recurrent neural networks for spatio-temporal forecasting. IEEE Transactions on Knowledge and Data Engineering 35, 9 (2023), 9254–9268
2023
-
[18]
Shengsheng Lin, Weiwei Lin, HU Xinyi, Wentai Wu, Ruichao Mo, and Haocheng Zhong. 2024. CycleNet: Enhancing Time Series Forecasting through Modeling Periodic Patterns. Advances in Neural Information Processing Systems 37 (2024), 106315–106345
2024
-
[19]
Li Lin, Kaiwen Xia, Anqi Zheng, Shijie Hu, and Shuai Wang. 2024. Hierarchical Spatio-Temporal Graph Learning Based on Metapath Aggregation for Emergency Supply Forecasting. In Proceedings of the 33rd ACM International Conference on Information and Knowledge Management . Associ...
2024
-
[21]
Hangchen Liu, Zheng Dong, Renhe Jiang, Jiewen Deng, Jinliang Deng, Quan- jun Chen, and Xuan Song. 2023. Spatio-temporal adaptive embedding makes vanilla transformer sota for traffic forecasting. In Proceedings of the 32nd ACM international conference on information and knowled...
2023
-
[22]
Yuqi Nie, Nam H Nguyen, Phanwadee Sinthong, and Jayant Kalagnanam. 2023. A time series is worth 64 words: Long-term forecasting with transformers. In Proceedings of the International Conference on Learning Representations
2023
-
[23]
Meinard Müller. 2007. Dynamic time warping. Information Retrieval for Music and Motion (2007), 69–84
2007
-
[24]
Zongjiang Shang and Ling Chen. 2024. MSHyper: Multi-scale hypergraph trans- former for long-range time series forecasting. arXiv preprint arXiv:2401.09261 (2024)
2024 arXiv
-
[26]
Bo Shen, Ruyu Shang, and Yapeng Qi. 2024. MvHSTM: A Multi-view Hypergraph Spatio-Temporal Model for Traffic Speed Forecasting. In OpenReview
2024
-
[27]
Zongjiang Shang, Ling Chen, Binqing Wu, and Dongliang Cui. 2024. Ada- MSHyper: Adaptive Multi-Scale Hypergraph Transformer for Time Series Fore- casting. In The Thirty-eighth Annual Conference on Neural Information Processing Systems, Vol. 37. 33310–33337
2024
-
[28]
Shiyu Wang, Haixu Wu, Xiaoming Shi, Tengge Hu, Huakun Luo, Lintao Ma, James Y Zhang, and Jun Zhou. 2024. TimeMixer: Decomposable multiscale mixing for time series forecasting. In Proceedings of the International Conference on Learning Representations
2024
-
[29]
Petar Veličković, Guillem Cucurull, Arantxa Casanova, Adriana Romero, Pietro Lio, and Yoshua Bengio. 2017. Graph attention networks. arXiv preprint arXiv:1710.10903 (2017)
2017 arXiv
-
[30]
Shun Wang, Yong Zhang, Xuanqi Lin, Yongli Hu, Qingming Huang, and Baocai Yin. 2024. Dynamic hypergraph structure learning for multivariate time series forecasting. IEEE Transactions on Big Data 10, 4 (2024), 556–567
2024
-
[31]
Senzhang Wang, Meiyue Zhang, Hao Miao, Zhaohui Peng, and Philip S. Yu. 2022. Multivariate correlation-aware spatio-temporal graph convolutional networks for multi-scale traffic prediction. ACM Transactions on Intelligent Systems and Technology 13, 3 (2022), 1–22
2022
-
[32]
Jason Weston, Sumit Chopra, and Antoine Bordes. 2014. Memory networks. arXiv preprint arXiv:1410.3916 (2014)
2014 arXiv
-
[33]
Yulong Wang, Yushuo Liu, Xiaoyi Duan, and Kai Wang. 2025. FilterTS: Com- prehensive Frequency Filtering for Multivariate Time Series Forecasting. In Proceedings of the AAAI Conference on Artificial Intelligence , Vol. 39. AAAI Press, 21375–21383
2025
-
[34]
Binqing Wu, Weiqi Chen, Wengwei Wang, Bingqing Peng, Liang Sun, and Ling Chen. 2024. WeatherGNN: Exploiting meteo-and spatial-dependencies for local numerical weather prediction bias-correction. In Proceedings of the International Joint Conference on Artificial Intelligence . ...
2024
-
[35]
Binqing Wu and Ling Chen. 2023. DSTCGCN: Learning dynamic spatial-temporal cross dependencies for traffic forecasting. arXiv preprint arXiv:2307.00518 (2023)
2023 arXiv
-
[36]
Haixu Wu, Jiehui Xu, Jianmin Wang, and Mingsheng Long. 2021. Autoformer: De- composition transformers with auto-correlation for long-term series forecasting. In Proceedings of the International Conference on Neural Information Processing Systems, Vol. 34. 22419–22430
2021
-
[37]
Haixu Wu, Tengge Hu, Yong Liu, Hang Zhou, Jianmin Wang, and Mingsheng Long
-
[38]
Zonghan Wu, Shirui Pan, Guodong Long, Jing Jiang, Xiaojun Chang, and Chengqi Zhang. 2020. Connecting the dots: Multivariate time series forecasting with graph neural networks. In Proceedings of the ACM SIGKDD International Conference on Knowledge Discovery and Data Mining . 753–763
2020
-
[39]
Kun Yi, Qi Zhang, Wei Fan, Hui He, Liang Hu, Pengyang Wang, Ning An, Long- bing Cao, and Zhendong Niu. 2024. FourierGNN: Rethinking multivariate time series forecasting from a pure graph perspective. In Proceedings of the Interna- tional Conference on Neural Information Proces...
2024
-
[40]
Haixu Wu, Hang Zhou, Mingsheng Long, and Jianmin Wang. 2023. Interpretable weather forecasting for worldwide stations with a unified deep model. Nature Machine Intelligence 5, 6 (2023), 602–611
2023
-
[41]
Yunhao Zhang and Junchi Yan. 2023. Crossformer: Transformer utilizing cross- dimension dependency for multivariate time series forecasting. In Proceedings of the International Conference on Learning Representations
2023
-
[42]
Yusheng Zhao, Xiao Luo, Wei Ju, Chong Chen, Xian-Sheng Hua, and Ming Zhang
-
[43]
Ailing Zeng, Muxi Chen, Lei Zhang, and Qiang Xu. 2023. Are transformers effective for time series forecasting?. In Proceedings of the AAAI conference on Artificial Intelligence. 11121–11128
2023
-
[44]
Chao Zhu, Jing Chen, Rui Zhu, Zhengqiong Wang, Shihan Liu, and Jishu Wang
-
[46]
In Proceedings of the IEEE International Conference on Data Engineering
Dynamic hypergraph structure learning for traffic flow forecasting. In Proceedings of the IEEE International Conference on Data Engineering . 2303–2316
-
[47]
Tian Zhou, Ziqing Ma, Qingsong Wen, Xue Wang, Liang Sun, and Rong Jin. 2022. FEDformer: Frequency enhanced decomposed Transformer for long-term series forecasting. In Proceedings of the International Conference on Machine Learning . 27268–27286
2022
-
[49]
In 2023 IEEE International Conference on Software Analysis, Evolution and Reengineering (SANER)
Asthgcn: Adaptive spatio-temporal hypergraph convolutional network for traffic forecasting. In 2023 IEEE International Conference on Software Analysis, Evolution and Reengineering (SANER) . IEEE, 972–979
2023
-
[2022]
In Proceedings of the International Conference on Learning Representations
TimesNet: Temporal 2D-variation modeling for general time series analysis. In Proceedings of the International Conference on Learning Representations
-
[2023]
In Proceedings of the AAAI Conference on Artificial Intelligence
Spatio-temporal meta-graph learning for traffic forecasting. In Proceedings of the AAAI Conference on Artificial Intelligence . 8078–8086
Reviewed August 5, 2026 · model on record in the stance chip above.
Discussion (0). Continue with ORCID to comment.