REVIEW 4 major objections 6 minor 20 references
An Object-Based Deep Learning Approach for Building Height Estimation from Single SAR Images
T0 review · 4 major / 6 minor · reviewed 2026-08-06 · deepseek-v4-flash
Pith's one-line read Building heights can be estimated from a single SAR image plus building footprints, with about one-storey error on European-style cities.
desk verdict A useful new multi-city dataset and an honest OOD evaluation, but the height-inversion equation is inconsistent with the claimed ground-range processing and needs resolution before the numbers can be trusted. read the letter →
The pith
A machine-rendered reading of the paper's core claim, the machinery that carries it, and where it could break.
The reading
What carries the argument
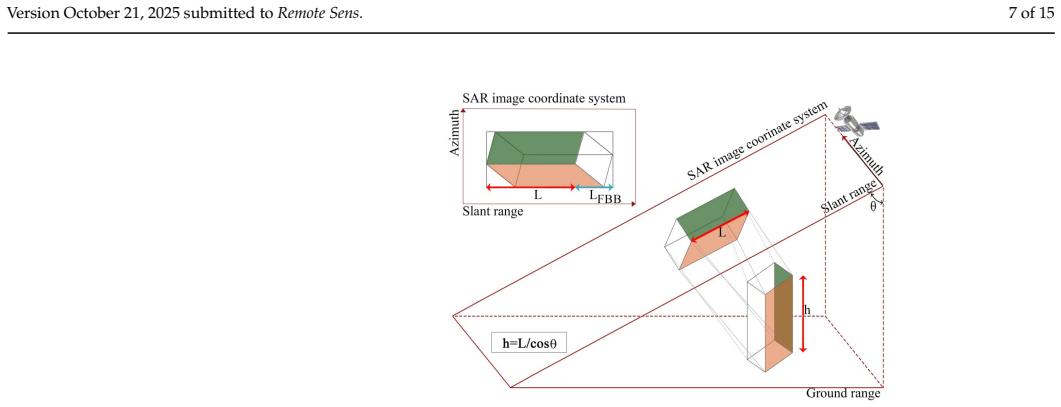
The load-bearing identity is the SAR bounding-box relation $h = (L_{\mathrm{BBB}} - L_{\mathrm{FBB}})/\cos\theta$, where the FBB is the smallest rectangle enclosing the footprint, rotated to match the orbit inclination, and the BBB is the corresponding box that includes the height-induced displacement in the range direction. The network's job is to regress the BBB from the SAR image and footprint-derived features, using only the box dimensions as extra features rather than the center coordinates to reduce overfitting. Operating directly in ground-range coordinates rather than reprojecting into the radar slant-range plane, the method uses the acquisition incidence angle to convert the measured displacement into a height estimate.
What would settle it
Take a held-out city with LiDAR ground-truth heights and feed the network footprint polygons that are deliberately shifted by one ground-range pixel (2.5 m) while keeping the SAR image unchanged. The height formula $h = (L_{\mathrm{BBB}}-L_{\mathrm{FBB}})/\cos\theta$ predicts a systematic bias near $2.5/\cos\theta$ m, so a much smaller or inconsistent bias would mean the bounding-box geometry is not the mechanism driving the estimates.
Extended reading notes
Core claim
The central claim is that a footprint-guided object-based regressor can extract building heights from a single VHR SAR image with accuracy comparable to one storey for European-style urban fabrics. The network processes a SAR patch together with the binary footprint mask, computes a footprint-aligned bounding box (FBB) rotated according to the orbit inclination, and regresses a building bounding box (BBB) whose range-direction length exceeds the FBB length by $L$; the height is $h = L / \cos\theta$. Trained with a mean squared error loss on 160,000 patches from seven cities and tested one city at a time, it achieves a leave-one-city-out MAE of 2.20 m in Munich, 2.24 m in Los Angeles, and 2.26 m in Milan, while rising above 10 m for Shanghai and Shenzhen, and an overall in-distribution MAE of 4.95 m. The same experiments show systematic failure on buildings above 40 m and on cities dominated by tall, narrow-footprint structures, which the paper attributes to tall-building scarcity in the training data and to slant-range ambiguity. The paper's conclusion is therefore conditional: single-VHR-SAR height estimation generalizes across continents mainly for the low- and mid-rise building stock that dominates the training distribution.
Load-bearing premise
The method assumes that an accurate footprint polygon is available for every building at prediction time; if footprints are missing, misaligned, or stale, the footprint-aligned box that the height formula is anchored to is wrong.
Editorial extensions
If this is right
- If the central claim holds, a city with up-to-date footprints needs only one VHR SAR acquisition, not multi-date or multi-sensor stacks, to produce a building height map at roughly one-storey accuracy in low- to mid-rise areas.
- The same trained model can be applied to an unseen European-style city without local training data, with expected MAE in the 2–3 m range for buildings under 40 m.
- For cities with many buildings above 40 m or with dense high-rise cores, expected errors are much larger, above 10 m MAE in the reported tests, so height products from this method should be flagged as low-confidence there.
- The 53,079 paired SAR and reference patches assembled for the eight cities become a reusable benchmark for future single-image SAR height estimation methods.
Reading between the lines
- Our inference: adding synthetic tall buildings or incidence-angle augmentation to the training set is a direct test of the paper's tall-building data-scarcity explanation; if Asian-city MAE drops sharply, that explanation is confirmed.
- Our inference: running the same network on VHR images from other sensors with the height formula unchanged would show whether the learned features are geometric or radiometrically sensor-specific.
- Our inference: in cities without footprint databases, the method would need an automated footprint extractor upstream, and footprint boundary errors would then enter the height estimate directly through the $L_{\mathrm{FBB}}$ term.
Signed reviews
Editorial analysis
A structured set of objections, weighed in public.
Referee Report
Summary. The manuscript proposes an object-based method for estimating building heights from a single very high resolution (VHR) COSMO-SkyMed SAR image. Given a building footprint polygon and the corresponding SAR patch, a ResNet-101 regressor augmented with footprint-derived geometric features predicts bounding-box information, from which the height is recovered through the incidence-angle relation in Eq. (2). The method is evaluated with leave-one-city-out experiments over eight cities on three continents, reporting test MAEs of about 2.2-2.3 m for several European and North American cities and 8-11 m for dense or high-rise Asian cities, together with an additional 70/30 in-distribution experiment. The paper claims that this constitutes state-of-the-art out-of-distribution performance for single-image SAR height estimation.
Significance. If the reported results hold, the paper would represent a useful advance: story-level accuracy from single-date VHR SAR on unseen cities of similar morphology is a nontrivial and practically relevant result, and the assembled multi-city dataset (about 53,000 patches and 3.3 million buildings) is a valuable benchmarking resource. The leave-one-city-out protocol is an appropriate and demanding test of generalization. However, the central geometric derivation needs to be corrected or clarified before the numerical results can be interpreted, and the comparisons against prior work are not direct. The paper does not provide code, and the SAR data are restricted by an ASI research agreement, so independent replication is not immediately possible.
major comments (4)
- [Section 3, Eq. (2) and Section 3.1] Eq. (2), h = L/cos(theta), is inconsistent with the paper's explicit statement that the method operates in the ground-range domain. In a geocoded ground-range SAR image, the layover offset between the footprint and the building top is L = h * tan(theta), so the correct inversion would be h = L/tan(theta), not h = L/cos(theta). For the Munich image, with theta = 20.04 degrees (Table 1), the two formulas differ by about a factor of 2.6 for the same offset L. The paper must state unambiguously whether L is measured in slant range or ground range; if it is measured in ground range, Eq. (2) is wrong, and if it is measured in slant range, the claims in Section 3.1 about avoiding the slant-range plane are contradicted. Please provide a derivation and, if Eq. (2) is used as written, explain how the network can produce the reported accuracies despite the factor-of-2.6 discrepancy.
- [Sections 2.4 and 3.2] The description of what the network actually regresses is internally inconsistent. Section 2.4 states that the model regresses a single height value per building and uses an MSE loss on height, while Section 3.2 states that the output of the fully connected layer is used to estimate bounding boxes from which the height is then computed. This distinction is material: if the loss is on height, Eq. (2) is not part of the training objective and the bounding-box interpretation is only a post-hoc explanation; if the loss is on box offsets, the generation of ground-truth bounding-box labels from footprint and height must be specified exactly, including which geometric formula is used to create those labels. Please clarify the training loss and the label-generation procedure.
- [Table 5 and Related Work] The comparisons in Table 5 do not support the abstract's claim of outperforming state-of-the-art methods in similar out-of-distribution scenarios. The cited methods use different sensors and data sources (Sentinel-1/2 time series, ICESat-2/GEDI LiDAR, GaoFen-7 multi-view photogrammetry) and different evaluation protocols. In particular, there is no direct comparison with Sun et al. [14], which is the direct predecessor and the baseline against which the two claimed innovations (ground-range processing and removal of center coordinates) are defined. Please add a direct comparison with [14] on the same COSMO-SkyMed data and the same leave-one-city-out protocol, or substantially soften the state-of-the-art claim.
- [Table 3] All reported results come from a single leave-one-city-out run with no error bars, no multiple seeds, and no significance tests. Small differences between cities, such as Munich 2.20 m, Los Angeles 2.24 m, and Milan 2.26 m, are likely within seed-to-seed or bootstrap variability. Please add repeated runs (at least a few seeds) or bootstrap confidence intervals for the headline MAE and RMSE values, especially for the claim of state-of-the-art accuracy.
minor comments (6)
- [Throughout] The manuscript contains numerous typographical and grammatical errors that should be corrected, including 'ibjecxt' in Section 4, 'compatisons' in the text before Table 5, 'specificaly' in Section 2.3, 'rigourous' and 'othere' in Section 2.2, and 'amd' in the Shenzhen comparison paragraph.
- [Figure 7] The caption says 'Scatter plots of absolute errors per city relative to reference heights,' but the surrounding text refers to 'orange regions' and 'yellow and red zones,' which suggests a spatial map or image. Please make the figure type and caption consistent.
- [Section 3.1] The 'inclination angle' is defined as the angle between the orbital plane and the equator, but its role in rotating the footprint-aligned bounding box is not derived or explained. Please clarify how this angle relates to the SAR acquisition geometry (incidence angle and heading) and how the FBB rotation is computed.
- [Introduction] The Introduction states that center coordinates contribute marginally to height prediction, but no ablation or experiment is presented to support this claim. Please either add an ablation study or remove the causal claim and present the choice as a design decision.
- [Table 3] The h >= 40 m columns are based on very small samples in several cities, for example 80 buildings in Munich and 72 in Milan (Table 2), making the reported MAE and RMSE values for tall buildings unstable. Please report the number of buildings in each height category for each city and consider suppressing or clearly caveating these tall-building metrics.
- [Header] The manuscript header contains placeholder submission metadata ('Received:', 'Revised:', 'Accepted:', 'Published:', 'Citation: ... Remote Sens. 2025, 1, 0') that should be removed or completed before publication. The keyword list also repeats 'SAR'.
Circularity Check
No significant circularity: the height estimates are supervised regressions against external reference data and are evaluated on held-out cities.
full rationale
The derivation chain is not circular. The network is trained with an MSE loss against reference heights (Section 2.4) taken from independent databases (EUBUCCO, NYC Open Data, LA GeoHub, and the China dataset of Egger et al.), and the footprint-aligned bounding box is constructed from footprint geometry and the incidence angle (Section 3.1), not from the reference heights. Evaluation uses leave-one-city-out cross-validation (Section 4), so the Munich MAE of 2.20 m is produced by a model that did not train on Munich data. Equation (2) is a fixed conversion from a predicted bounding-box offset to height; it is not fitted to the test data, and the offset is not defined in terms of the target height. The method does depend on footprint polygons at inference, but that is an explicit data requirement rather than a circular input. The only related concern is that the paper's claim to operate in the ground-range domain is in tension with Eq. (2), which matches slant-range layover geometry; that is a geometric/correctness issue, not a circularity, and therefore does not change the circularity score.
Assumptions & free parameters
free parameters (3)
- Patch size and overlap =
256 x 256 px, 20% overlap
- Per-city training sample cap =
20,000 random buildings per city
- Height split threshold =
40 m
assumptions (5)
- domain assumption Building height can be estimated from the range-direction difference between the building bounding box (BBB) and the footprint bounding box (FBB) via h = L / cos theta.
- domain assumption Accurate building footprint polygons are available at inference for every building.
- domain assumption Reference building heights and footprints are accurate and temporally aligned with the SAR acquisitions.
- domain assumption Consistent acquisition geometry (descending orbit, HH polarization) across cities makes cross-city transfer meaningful.
- domain assumption A ResNet-101 can learn the mapping from SAR intensity plus footprint mask to bounding box displacement.
Cite this review
Pith. "Pith review of An Object-Based Deep Learning Approach for Building Height Estimation from Single SAR Images." pith.science (2026). https://pith.science/paper/56L6PJWB
@misc{pith2026250708096,
  author       = {Pith},
  title        = {Pith review of: An Object-Based Deep Learning Approach for Building Height Estimation from Single SAR Images},
  year         = {2026},
  howpublished = {\url{https://pith.science/paper/56L6PJWB}},
  note         = {Machine review of arXiv:2507.08096}
}
read the original abstract
Accurate estimation of building heights using very high resolution (VHR) synthetic aperture radar (SAR) imagery is crucial for various urban applications. This paper introduces a Deep Learning (DL)-based methodology for automated building height estimation from single VHR COSMO-SkyMed images: an object-based regression approach based on bounding box detection followed by height estimation. This model was trained and evaluated on a unique multi-continental dataset comprising eight geographically diverse cities across Europe, North and South America, and Asia, employing a cross-validation strategy to explicitly assess out-of-distribution (OOD) generalization. The results demonstrate highly promising performance, particularly on European cities where the model achieves a Mean Absolute Error (MAE) of approximately one building story (2.20 m in Munich), significantly outperforming recent state-of-the-art methods in similar OOD scenarios. Despite the increased variability observed when generalizing to cities in other continents, particularly in Asia with its distinct urban typologies and prevalence of high-rise structures, this study underscores the significant potential of DL for robust cross-city and cross-continental transfer learning in building height estimation from single VHR SAR data.
Figures


Figures from the paper (4 more)


Reference graph
Works this paper leans on
-
[14]
Sun, Y.; Mou, L.; Wang, Y.; Montazeri, S.; Zhu, X.X. Large-scale building height retrieval from single SAR imagery based on bounding box regression networks. ISPRS Journal of Photogrammetry and Remote Sensing 2022, 184, 79–95. https://doi.org/https://doi.org/10.1016/ j.isprsjprs.2021.11.024. Version October 21, 2025 submitted to Remote Sens. 15 of 15
work page 2022
-
[1]
Gomroki, M.; Hasanlou, M.; Chanussot, J. Automatic 3D Multiple Building Change Detection Model Based on Encoder–Decoder Network Using Highly Unbalanced Remote Sensing Datasets. IEEE Journal of Selected Topics in Applied Earth Observations and Remote Sensing2023, 16, 10311– 10325. https://doi.org/10.1109/JSTARS.2023.3328561
-
[2]
3D urban object change detection from aerial and terrestrial point clouds: A review
Xiao, W.; Cao, H.; Tang, M.; Zhang, Z.; Chen, N. 3D urban object change detection from aerial and terrestrial point clouds: A review. International Journal of Applied Earth Observation and Geoinformation 2023, 118, 103258. https://doi.org/https://doi.org/10.1016/j.jag.2023.103258
-
[3]
A Lightweight Building Extraction Approach for Contour Recovery in Complex Urban Environments
He, J.; Cheng, Y.; Wang, W.; Ren, Z.; Zhang, C.; Zhang, W. A Lightweight Building Extraction Approach for Contour Recovery in Complex Urban Environments. Remote Sensing 2024, 16
work page 2024
-
[4]
Hao, M.; Chen, S.; Lin, H.; Zhang, H.; Zheng, N. A prior knowledge guided deep learning method for building extraction from high-resolution remote sensing images. Urban Informatics 2024, 3, 6. https://doi.org/10.1007/s44212-024-00038-8
-
[5]
Deep learning-based building height mapping using Sentinel-1 and Sentinel-2 data
Cai, B.; Shao, Z.; Huang, X.; Zhou, X.; Fang, S. Deep learning-based building height mapping using Sentinel-1 and Sentinel-2 data. International Journal of Applied Earth Observation and Geoinformation 2023, 122, 103399. https://doi.org/https://doi.org/10.1016/j.jag.2023.103399
-
[6]
U-Net: Convolutional networks for biomedical image segmentation
Ronneberger, O.; Fischer, P .; Brox, T. U-Net: Convolutional networks for biomedical image segmentation. In Proceedings of the Medical Image Computing and Computer-Assisted Intervention–MICCAI 2015: 18th International Conference, Munich, Germany, October 5-9, 2015, Proceedings, Part III 18. Springer, 2015, pp. 234–241
work page 2015
-
[7]
Nascetti, A.; Yadav, R.; Ban, Y. A CNN Regression Model to Estimate Buildings Height Maps Using Sentinel-1 SAR and Sentinel-2 MSI Time Series. In Proceedings of the IGARSS 2023 - 2023 IEEE International Geoscience and Remote Sensing Symposium, 2023, pp. 2831–2834. https://doi.org/10.1109/IGARSS52108.2023.10283039
arXiv 2023
Show all 20 references
-
[8]
FusionHeightNet: A Multi-Level Cross-Fusion Method from Multi-Source Remote Sensing Images for Urban Building Height Estimation
Ma, C.; Zhang, Y.; Guo, J.; Zhou, G.; Geng, X. FusionHeightNet: A Multi-Level Cross-Fusion Method from Multi-Source Remote Sensing Images for Urban Building Height Estimation. Remote Sensing 2024, 16. https://doi.org/10.3390/rs16060958
2024 doi
-
[9]
How high are we? Large-scale building height estimation at 10 m using Sentinel-1 SAR and Sentinel-2 MSI time series
Yadav, R.; Nascetti, A.; Ban, Y. How high are we? Large-scale building height estimation at 10 m using Sentinel-1 SAR and Sentinel-2 MSI time series. Remote Sensing of Environment 2025, 318, 114556. https://doi.org/https://doi.org/10.1016/j.rse.2024.114556
2025
-
[10]
Developing a method to estimate building height from Sentinel-1 data
Li, X.; Zhou, Y.; Gong, P .; Seto, K.C.; Clinton, N. Developing a method to estimate building height from Sentinel-1 data. Remote Sensing of Environment 2020, 240, 111705. https://doi.org/https: //doi.org/10.1016/j.rse.2020.111705
2020
-
[11]
Automated Estimation of Building Heights with ICESat-2 and GEDI LiDAR Altimeter and Building Footprints: The Case of New York City and Los Angeles
Kaya, Y. Automated Estimation of Building Heights with ICESat-2 and GEDI LiDAR Altimeter and Building Footprints: The Case of New York City and Los Angeles. Buildings 2024, 14. https://doi.org/10.3390/buildings14113571
2024 doi
-
[12]
2D building change detection from high resolution satelliteimagery: A two-step hierarchical method based on 3D invariant primitives
Champion, N.; Boldo, D.; Pierrot-Deseilligny, M.; Stamon, G. 2D building change detection from high resolution satelliteimagery: A two-step hierarchical method based on 3D invariant primitives. Pattern Recognition Letters 2010, 31, 1138–1147. Pattern Recognition in Remote Sens...
2010 doi
-
[13]
The SAR2Height framework for urban height map reconstruction from single SAR intensity images
Recla, M.; Schmitt, M. The SAR2Height framework for urban height map reconstruction from single SAR intensity images. ISPRS Journal of Photogrammetry and Remote Sensing 2024, 211, 104–120. https://doi.org/https://doi.org/10.1016/j.isprsjprs.2024.03.023
2024 doi
-
[15]
COSMO-SkyMed an existing opportunity for observing the Earth
F.Covello.; Battazza, F.; Coletta, A.; Lopinto, E.; Fiorentino, C.; Pietranera, L.; Valentini, G.; Zoffoli, S. COSMO-SkyMed an existing opportunity for observing the Earth. Journal of Geodynamics 2010, 49, 171–180. WEGENER 2008 - Proceedings of the 14th General Assembly of Weg...
2010 doi
-
[16]
EUBUCCO v0.1: European building stock characteristics in a common and open database for 200+ million individual buildings
Milojevic-Dupont, Nikola and Wagner, Felix.; Nachtigall, F.; Hu, J.; Brüser, G.B.; Zumwald, M.; Biljecki, F.; Heeren, N.; Kaack, L.H.; Pichler, P .P .; Creutzig, F. EUBUCCO v0.1: European building stock characteristics in a common and open database for 200+ million individual ...
2023 doi
-
[17]
Building Floorspace in China: A Dataset and Learning Pipeline, 2023, [arXiv:cs.CV/2303.02230]
Egger, P .; Rao, S.X.; Papini, S. Building Floorspace in China: A Dataset and Learning Pipeline, 2023, [arXiv:cs.CV/2303.02230]
2023 arXiv
-
[18]
Data augmentation for building footprint segmenta- tion in SAR images: an empirical study
Wangiyana, S.; Samczy ´ nski, P .; Gromek, A. Data augmentation for building footprint segmenta- tion in SAR images: an empirical study. Remote Sensing 2022, 14, 2012
2022
-
[19]
Deep residual learning for image recognition
He, K.; Zhang, X.; Ren, S.; Sun, J. Deep residual learning for image recognition. In Proceedings of the Proceedings of the IEEE conference on computer vision and pattern recognition, 2016, pp. 770–778
2016
-
[20]
Leveraging Chinese GaoFen-7 imagery for high-resolution building height estimation in multiple cities
Chen, P .; Huang, H.; Liu, J.; Wang, J.; Liu, C.; Zhang, N.; Su, M.; Zhang, D. Leveraging Chinese GaoFen-7 imagery for high-resolution building height estimation in multiple cities. Remote Sensing of Environment 2023, 298, 113802. https://doi.org/https://doi.org/10.1016/j.rse....
2023 doi
Reviewed August 6, 2026 · model on record in the stance chip above.
Discussion (0). Continue with ORCID to comment.