REVIEW 3 major objections 5 minor 65 references
Bias Detection via Maximum Subgroup Discrepancy
T0 review · 3 major / 5 minor · reviewed 2026-08-09 · deepseek-v4-flash
Pith's one-line read The paper introduces Maximum Subgroup Discrepancy, a distance whose sample complexity is linear in the number of protected attributes, and provides an exact mixed-integer solver that recovers the most disadvantaged subgroup.
desk verdict The theorem and experiments are solid, but the MIO solver searches only positive-literal conjunctions while the metric includes negations, so the claimed exact empirical MSD is actually a lower bound; fixable and worth engaging. read the letter →
The pith
A machine-rendered reading of the paper's core claim, the machinery that carries it, and where it could break.
The reading
What carries the argument
The mechanism is the finite family of terms. A term $\chi_S$ is a conjunction of literals $x_p$ or $\bar{x}_p$ over protected attributes, and MSD is the supremum of the signed weight difference over all such terms. The key identity is the term count: because each of the $|P|$ attributes is either absent, positive, or negated, $|\mathcal{S}_P| \le 3^{|P|}$, so $\log|\mathcal{S}_P| \le 2|P|$; plugging this into a uniform-concentration bound over bounded functions gives the $O(\sqrt{|P|/N})$ error. The practical computation is a mixed-integer linear program with variables $u_j$ indicating which literals appear, variables $y_i$ indicating whether sample $i$ lies in the subgroup, an absolute-value objective via big-M constraints, and a minimum-subgroup-size constraint $N_{\min}$; its global optimum is the empirical MSD over conjunctions.
What would settle it
Construct distributions $\mu$ and $\nu$ over a small protected space with two binary attributes such that the largest discrepancy over the full term class $\mathcal{S}_P$ is attained by the negated term $\bar{x}_{p_1}$, then solve the MIO formulation (15) on $10^4$ samples. The returned conjunction will be a positive literal or a conjunction of positive literals, and its achieved discrepancy will be strictly below the discrepancy of $\bar{x}_{p_1}$, so the reported empirical MSD will not match the formal MSD over $\mathcal{S}_P$; that outcome is directly observable.
Extended reading notes
Core claim
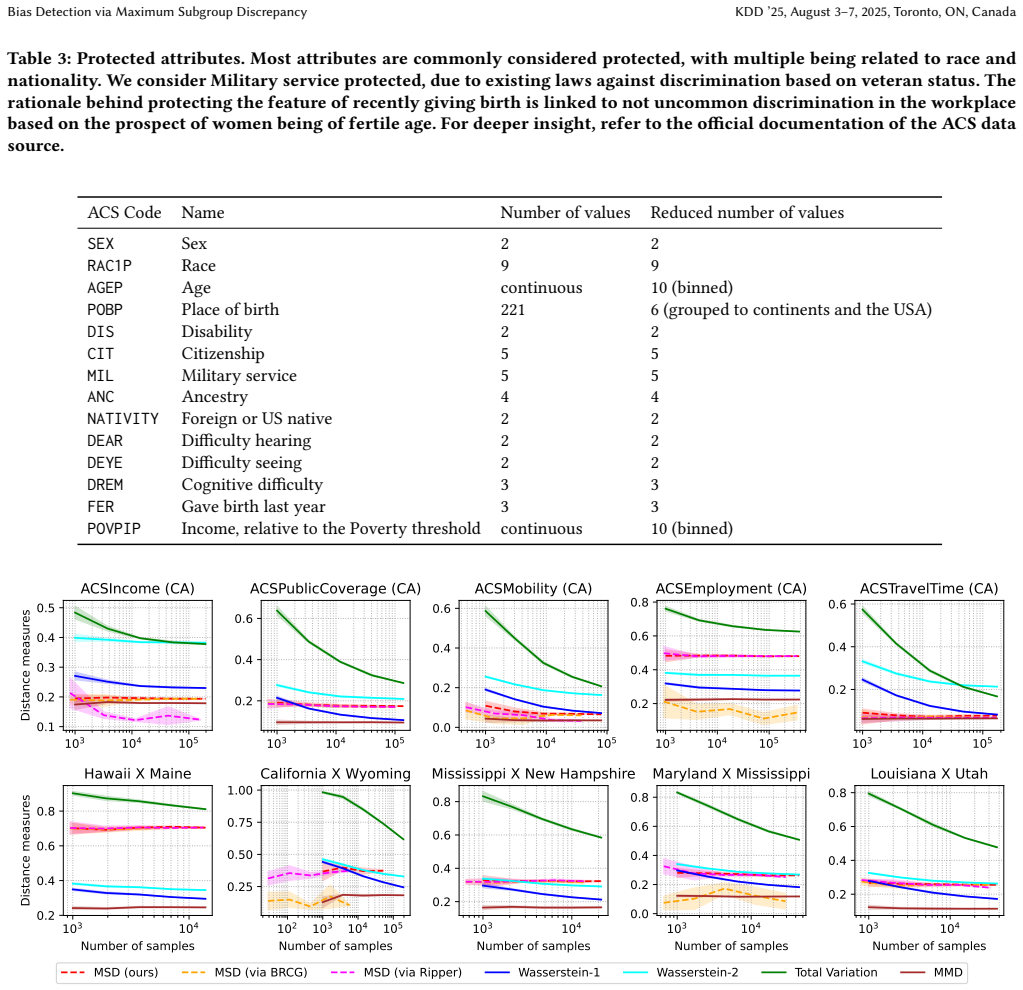
The paper defines $\text{MSD}(\mu,\nu;P)$ as the supremum, over all terms $\chi_S$ (conjunctions of literals on protected attributes $P$), of $|\mu(\chi_S)-\nu(\chi_S)|$. Theorem 3.1 states that with probability at least $1-2\delta$, $$\text{MSD}(\mu,\nu;P) \le \text{MSD}(\hat{\mu},\hat{\nu};P) + 4\sqrt{\frac{2|P|+\log(2/\delta)}{2N}},$$ with $N=\min(N_1,N_2)$, so the sample complexity is $O((|P|+\log(1/\delta))/\varepsilon^2)$. The proof uses the fact that there are at most $3^{|P|}$ terms, so $\log|\mathcal{S}_P| \le 2|P|$, and applies uniform concentration over this finite family. Estimation is recast as weighted 0-1 classification with conjunctions as classifiers, and an MIO model with binary variables for literals and sample memberships solves the empirical maximum to global optimality. Experiments on public benchmark datasets show MSD converging at sample sizes where total variation and Wasserstein estimates still vary, recovering readable subgroups such as 'DIS=2 AND MIL=4' or 'white women'.
Load-bearing premise
The linear sample-complexity guarantee and the 'worst subgroup' claim hold only when the most discrepant subgroup is a single conjunction of attribute-equals-value conditions over pre-binarized, pre-binned protected attributes; subgroups that are unions, negated categories, or cuts inside a bin are outside the searched class, and on such data MSD becomes a lower bound and the recovered subgroup is the wrong one.
Editorial extensions
If this is right
- A data auditor needs $O(|P|/\varepsilon^2)$ samples to estimate the worst subgroup discrepancy to accuracy $\varepsilon$ with high probability, rather than a number exponential in the protected attributes.
- Because the MIO solution is globally optimal, the empirical MSD comes with a certified upper bound over all searched subgroups, and the method simultaneously returns the most disadvantaged subgroup as an interpretable rule.
- MSD sits between the $\ell_\infty$ distance and total variation, so it catches intersectional disparities invisible to per-attribute demographic parity without incurring total variation's exponential sample demand.
- On the evaluated datasets, MSD stabilizes at a few thousand samples where total variation and Wasserstein estimates still fluctuate, and the recovered subgroups match semantically meaningful groups.
- Within the paper's MSDD framework, MSD can serve as the base distance for both data-quality checks (dataset versus a reference population) and model-output audits (positive versus negative class).
Reading between the lines
- Because the MIO constraints only encode positive literals, the practical 'most disadvantaged subgroup' can miss negated terms and unions; on data where the worst subgroup is of that form, the reported MSD is a lower bound and the recovered subgroup is not the true maximizer.
- A natural extension is a multi-term DNF version of MSD that maximizes over unions of subgroups, but its sample complexity would likely depend on the DNF size and would not inherit the simple linear-in-|P| bound of the single-term definition.
- Theorem 3.1 plus global optimality could be packaged as a bias-certification primitive: fix an acceptable discrepancy threshold and a confidence level, collect $O(|P|/\varepsilon^2)$ samples, and either certify all conjunction subgroups or return the violating rule.
- Practitioners who want the statistical guarantee should use an exact MIO solver rather than heuristic single-term learners, because non-global solutions can silently return a smaller MSD and a wrong subgroup.
Signed reviews
Editorial analysis
A structured set of objections, weighed in public.
Referee Report
Summary. The paper introduces Maximum Subgroup Discrepancy (MSD), a distance between two distributions defined as the supremum, over all conjunctions of literals on a set of protected attributes P, of the absolute difference in probability mass assigned to the corresponding subgroup. The central theoretical result (Theorem 3.1, Eq. (12)) is a uniform-concentration bound showing that the empirical MSD estimates the population MSD with error O(sqrt((|P| + log(1/delta))/N)), i.e., sample complexity linear in the number of protected attributes. The paper also proposes a mixed-integer optimization (MIO) formulation (Eq. (15)) to compute the empirical MSD exactly, reports experiments on Census-based datasets comparing MSD to TV, Wasserstein, MMD, and DNF-learning baselines, and lists the recovered most-discrepant subgroups. The claimed contributions are a sample-efficient, interpretable bias metric and an exact optimization algorithm for it.
Significance. If the central results hold as stated, the paper addresses a real practical need: auditing intersectional bias with a finite-sample guarantee and recovering an interpretable description of the worst subgroup. The theorem is parameter-free and proved from a stated external concentration inequality, with no fitted constants entering the sample-complexity bound. The MIO formulation provides exact global solutions for the restricted family of positive-literal conjunctions on most tested instances, and the authors supply open code and detailed experimental results, which are concrete strengths. However, the paper's advertised equivalence between the formal definition of MSD, which includes negated literals, and the MIO implementation, which only searches positive-literal conjunctions, is currently broken; this gap affects the interpretation of the empirical results and of the threshold/interpretability claims. The contribution is therefore potentially significant, but the manuscript needs a substantive fix before the claims can be endorsed.
major comments (3)
- [Section 4.1, Eq. (15)] The MIO formulation (15) does not optimize over the family SP defined in Section 3. The definition of MSD in Eq. (5) is a supremum over all conjunctions of literals x_p and \bar{x}_p, with |SP| <= 3^|P|, but constraints (15d) and (15e) with u_j in {0,1} only encode positive literals: a sample belongs to the subgroup only when x_{i,j}=1 for every selected feature j. There is no variable or constraint encoding negation, so subgroups such as \bar{x}_1 \wedge x_2 are not representable. Consequently the sentence in Section 4.1, "By solving this MIO problem, we find the subgroup with the highest absolute difference ... i.e., the empirical estimate of MSD(mu,nu;P)", is true only for the sub-family of positive-literal conjunctions. For data whose maximally discrepant subgroup uses a negation, the MIO value is a strict lower bound on the formal MSD and the recovered subgroup is not the formal maximizer. This is load-bearing because Theorem 3.1 bounds the formal quantity, while the released algorithm computes a different quantity.
- [Section 5.3.3 and Appendix B.3] The practical claims of exact recovery of the worst subgroup and of a threshold guarantee are stated for the formal MSD but are only supported for positive-literal conjunctions. In Section 5.3.3 the paper says that global optimality of the MIO solution enables one to be sure that no subgroup violates a threshold and to obtain the most disadvantaged subgroup; Appendix B.3 lists recovered subgroups. If the formal MSD allows negated literals, then a subgroup with negation may be the true maximizer, and the solver would not find it, so both the threshold statement and the list of recovered subgroups are only valid for the restricted class. The authors should either extend the MIO with negation variables or explicitly redefine the MSD notion used in the experiments and adjust the claims accordingly.
- [Table 1 and Section 3.1] The comparison in Table 1 between MSD and TV/Wasserstein/MMD sample complexities should be qualified. The exponential lower bounds are for estimating those distances over general or high-dimensional measure classes, whereas MSD is a supremum over a finite class of conjunctions; the linear bound in |P| is a direct consequence of this restriction (|SP| <= 3^|P|). The paper should state clearly that the sample-complexity advantage is obtained by moving to a weaker, restricted notion of distance, not by a better estimator for the same class of distances. This does not invalidate the contribution, but it is central to how readers should interpret the table and the claims of practical feasibility.
minor comments (5)
- [Section 5.1] The heading "Datasests" contains a typo and should read "Datasets".
- [Section 1.1 and Eq. (2)] The relationship between MSDD (Eq. (2)) and MSD (Eq. (5)) is easy to confuse because MSDD is defined for an arbitrary distance Delta, while MSD is then introduced as a specific choice of Delta. The paper should add a sentence explicitly stating that MSD is the instance of MSDD obtained by taking Delta(A,B) = |A - B| over the same family of subgroups.
- [Figure 2] The legend in Figure 2 mentions "Proportion of subgroups evaluated within 10 minutes", but the axes label is "Mean number of considered subgroups". It should be clarified whether the plotted quantity is a proportion or a count, and the caption should describe how configurations that were not solved to optimality are excluded.
- [Section 5.3.1] The sentence "The MSD points are on the diagonal since we know we have the maximum overall subgroups when the formulation is solved to global optimality" is only correct for the positive-literal sub-family, given the issue raised in the first major comment; this wording should be revised.
- [Section 5.3.2] The paper reports that 13 out of 250 seeded setups did not solve to global optimality within 10 minutes, but does not state how these runs are treated in the plots and averages. It should clarify whether the reported values for those runs are best feasible solutions, best bounds, or whether those configurations are omitted.
Circularity Check
No significant circularity: Theorem 3.1 is a parameter-free finite-family concentration bound, and the MIO positive-literal restriction is a coverage gap rather than a circular reduction.
full rationale
The central sample-complexity claim, Theorem 3.1, is derived from a union bound over the finite family SP of conjunctions, using the external concentration inequality of Mohri et al. (Theorem 2.13 in [41]) and the crude bound log|SP| <= 2|P|. Nothing is fitted to data in this derivation, and no prediction is defined as the output of a fitted parameter. The paper does not invoke a load-bearing self-citation: the authors' own prior work is not used to justify the uniqueness of MSD or to import an ansatz. The construction of MSD and its relation to TV and l_infinity is explicit and self-contained. There is, however, a real definition/algorithm mismatch: Equations (3)-(5) define terms over literals {x_p, \bar{x}_p}, while constraints (15d)-(15e) implement only positive literals (a sample satisfies the term only when selected features equal 1). Thus the statement in Section 4.1 that solving the MIO gives 'the empirical estimate of MSD' is an overclaim; the MIO value is a lower bound over a restricted subclass when negated literals would matter. This is a correctness and coverage gap, not circularity, because the claimed equality does not hold by construction and the theorem itself remains independent of the solver. Experimental choices such as N_min=10, 10-bin quantization, and subsampling affect the empirical evaluation but do not enter the proof of the sample-complexity bound. Accordingly, no circular step is identified.
Assumptions & free parameters
free parameters (2)
- N_min, minimum subgroup sample size =
10
- Continuous feature binning and value grouping =
10 equally spaced bins per continuous attribute; POBP grouped from 221 to 6 values
assumptions (4)
- domain assumption Protected attributes are binary after one-hot encoding, and subgroups are single conjunctions of literals over them (Eqs. (1)-(5)).
- standard math Finite-family uniform concentration holds for the class SP (Mohri et al., Theorem 2.13), applied separately to mu and nu with a union bound.
- domain assumption Bias is defined as the distance between two distributions over a fixed, a priori chosen protected attribute set P (Section 1.1).
- domain assumption The largest-sample empirical estimate is treated as the reference true distance for the relative comparisons (Section 5.3.2).
Cite this review
Pith. "Pith review of Bias Detection via Maximum Subgroup Discrepancy." pith.science (2026). https://pith.science/paper/5CWAF6EF
@misc{pith2026250202221,
  author       = {Pith},
  title        = {Pith review of: Bias Detection via Maximum Subgroup Discrepancy},
  year         = {2026},
  howpublished = {\url{https://pith.science/paper/5CWAF6EF}},
  note         = {Machine review of arXiv:2502.02221}
}
read the original abstract
Bias evaluation is fundamental to trustworthy AI, both in terms of checking data quality and in terms of checking the outputs of AI systems. In testing data quality, for example, one may study the distance of a given dataset, viewed as a distribution, to a given ground-truth reference dataset. However, classical metrics, such as the Total Variation and the Wasserstein distances, are known to have high sample complexities and, therefore, may fail to provide a meaningful distinction in many practical scenarios. In this paper, we propose a new notion of distance, the Maximum Subgroup Discrepancy (MSD). In this metric, two distributions are close if, roughly, discrepancies are low for all feature subgroups. While the number of subgroups may be exponential, we show that the sample complexity is linear in the number of features, thus making it feasible for practical applications. Moreover, we provide a practical algorithm for evaluating the distance based on Mixed-integer optimization (MIO). We also note that the proposed distance is easily interpretable, thus providing clearer paths to fixing the biases once they have been identified. Finally, we describe a natural general bias detection framework, termed MSDD distances, and show that MSD aligns well with this framework. We empirically evaluate MSD by comparing it with other metrics and by demonstrating the above properties of MSD on real-world datasets.
Figures


Figures from the paper (3 more)


Reference graph
Works this paper leans on
-
[1]
Sumyeong Ahn, Seongyoon Kim, and Se-Young Yun. 2023. Mitigating Dataset Bias by Using Per-Sample Gradient. InThe Eleventh International Conference on Learning Representations. https://openreview.net/forum?id=7mgUec-7GMv
work page 2023
-
[2]
Vijay Arya, Rachel K. E. Bellamy, Pin-Yu Chen, Amit Dhurandhar, Michael Hind, Samuel C. Hoffman, Stephanie Houde, Q. Vera Liao, Ronny Luss, Aleksandra Mojsilović, Sami Mourad, Pablo Pedemonte, Ramya Raghavendra, John Richards, Prasanna Sattigeri, Karthikeyan Shanmugam, Moninder Singh, Kush R. Varshney, Dennis Wei, and Yunfeng Zhang. 2019. One explanation ...
work page 2019
-
[3]
Hyojin Bahng, Sanghyuk Chun, Sangdoo Yun, Jaegul Choo, and Seong Joon Oh. 2020. Learning de-biased representations with biased representations. In Proceedings of the 37th International Conference on Machine Learning (ICML’20). JMLR.org, Article 50, 12 pages
work page 2020
-
[4]
Arnab Bhattacharyya, Sutanu Gayen, Kuldeep S. Meel, Dimitrios Myrisiotis, A. Pavan, and N. V. Vinodchandran. 2023. On approximating total variation distance. InProceedings of the Thirty-Second International Joint Conference on Artificial Intelligence(Macao, P.R.China)(IJCAI ’23). Article 387, 9 pages. doi:10.24963/ ijcai.2023/387
work page 2023
-
[5]
2021.Pyomo - Optimization Modeling in Python, 3rd Edition
Michael L Bynum, Gabriel A Hackebeil, William E Hart, Carl D Laird, Bethany L Nicholson, John D Siirola, Jean-Paul Watson, David L Woodruff, et al. 2021.Pyomo - Optimization Modeling in Python, 3rd Edition. Vol. 67. Springer
work page 2021
-
[6]
Siu-On Chan, Ilias Diakonikolas, Paul Valiant, and Gregory Valiant. 2014. Optimal algorithms for testing closeness of discrete distributions. InProceedings of the twenty-fifth annual ACM-SIAM symposium on Discrete algorithms. SIAM, 1193– 1203
work page 2014
-
[7]
Ziyu Chen, Markos Katsoulakis, Luc Rey-Bellet, and Wei Zhu. 2023. Sample complexity of probability divergences under group symmetry. InInternational Conference on Machine Learning. PMLR, 4713–4734
work page 2023
-
[8]
Zhang, Federica Sarro, and Mark Harman
Zhenpeng Chen, Jie M. Zhang, Federica Sarro, and Mark Harman. 2024. Fair- ness Improvement with Multiple Protected Attributes: How Far Are We?. In Proceedings of the IEEE/ACM 46th International Conference on Software Engineer- ing(Lisbon, Portugal)(ICSE ’24). Association for Computing Machinery, New York, NY, USA, Article 160, 13 pages. doi:10.1145/359750...
Show all 65 references
-
[9]
William W. Cohen. 1995. Fast effective rule induction. InProceedings of the Twelfth International Conference on International Conference on Machine Learning (Tahoe City, California, USA)(ICML’95). Morgan Kaufmann Publishers Inc., San Francisco, CA, USA, 115–123
1995
-
[10]
2020.Intersectionality
Patricia Hill Collins and Sirma Bilge. 2020.Intersectionality. John Wiley & Sons
2020
-
[11]
Kimberlé Crenshaw. 2013. Demarginalizing the intersection of race and sex: A black feminist critique of antidiscrimination doctrine, feminist theory and antiracist politics. InFeminist legal theories. Routledge, 23–51
2013
-
[12]
Amit Daniely and Shai Shalev-Shwartz. 2016. Complexity theoretic limitations on learning dnf’s. InConference on Learning Theory. PMLR, 815–830
2016
-
[13]
Sanjeeb Dash, Oktay Gunluk, and Dennis Wei. 2018. Boolean decision rules via column generation.Advances in neural information processing systems31 (2018)
2018
-
[14]
Luc Devroye, Abbas Mehrabian, and Tommy Reddad. 2018. The total variation distance between high-dimensional Gaussians with the same mean.arXiv preprint arXiv:1810.08693(2018)
2018 arXiv
-
[15]
Frances Ding, Moritz Hardt, John Miller, and Ludwig Schmidt. 2021. Retiring Adult: New Datasets for Fair Machine Learning.Advances in Neural Information Processing Systems34 (2021)
2021
-
[16]
Iris Dominguez-Catena, Daniel Paternain, and Mikel Galar. 2024. Metrics for Dataset Demographic Bias: A Case Study on Facial Expression Recognition.IEEE Transactions on Pattern Analysis and Machine Intelligence46, 8 (2024), 5209–5226. doi:10.1109/TPAMI.2024.3361979
2024
-
[17]
Richard Mansfield Dudley. 1969. The speed of mean Glivenko-Cantelli conver- gence.The Annals of Mathematical Statistics40, 1 (1969), 40–50
1969
-
[18]
Weiming Feng, Heng Guo, Mark Jerrum, and Jiaheng Wang. 2023. A simple polynomial-time approximation algorithm for the total variation distance be- tween two product distributions.TheoretiCS2 (2023)
2023
-
[19]
Alaya, Aurélie Boisbunon, Stanislas Chambon, Laetitia Chapel, Adrien Corenflos, Kilian Fatras, Nemo Fournier, Léo Gautheron, Nathalie T.H
Rémi Flamary, Nicolas Courty, Alexandre Gramfort, Mokhtar Z. Alaya, Aurélie Boisbunon, Stanislas Chambon, Laetitia Chapel, Adrien Corenflos, Kilian Fatras, Nemo Fournier, Léo Gautheron, Nathalie T.H. Gayraud, Hicham Janati, Alain Rakotomamonjy, Ievgen Redko, Antoine Rolet, Ant...
-
[20]
James R Foulds, Rashidul Islam, Kamrun Naher Keya, and Shimei Pan. 2020. An intersectional definition of fairness. In2020 IEEE 36th International Conference on Data Engineering (ICDE). IEEE, 1918–1921
2020
-
[21]
Nicolas Fournier and Arnaud Guillin. 2015. On the rate of convergence in Wasserstein distance of the empirical measure.Probability theory and related fields162, 3 (2015), 707–738
2015
-
[22]
Usman Gohar and Lu Cheng. 2023. A Survey on Intersectional Fairness in Machine Learning: Notions, Mitigation, and Challenges. InProceedings of the Thirty-Second International Joint Conference on Artificial Intelligence, IJCAI-23, Edith Elkind (Ed.). International Joint Confere...
2023 doi
-
[23]
Arthur Gretton, Karsten M Borgwardt, Malte J Rasch, Bernhard Schölkopf, and Alexander Smola. 2012. A kernel two-sample test.The Journal of Machine Learning Research13, 1 (2012), 723–773
2012
-
[24]
Gurobi Optimization, LLC. 2023. Gurobi Optimizer Reference Manual. https: //www.gurobi.com
2023
-
[25]
Swagatam Haldar, Diptikalyan Saha, Dennis Wei, Rahul Nair, and Elizabeth M Daly. 2023. Interpretable differencing of machine learning models. InUncertainty in Artificial Intelligence. PMLR, 788–797
2023
-
[26]
Ernst Hellinger. 1909. Neue begründung der theorie quadratischer formen von unendlichvielen veränderlichen.Journal für die reine und angewandte Mathematik 1909, 136 (1909), 210–271
1909
- [27]
-
[28]
IEEE Standards Association. 2025. IEEE Standard for Algorithmic Bias Consider- ations.IEEE Std 7003-2024(2025), 1–59. doi:10.1109/IEEESTD.2025.10851955
2025
-
[29]
C. Jordan. 1881. On Fourier series.C. R. Acad. Sci., Paris92 (1881), 228–230
-
[30]
Vardis Kandiros, Constantinos Daskalakis, Yuval Dagan, and Davin Choo. 2023. Learning and Testing Latent-Tree Ising Models Efficiently. InThe Thirty Sixth Annual Conference on Learning Theory. PMLR, 1666–1729
2023
-
[31]
Michael Kearns, Seth Neel, Aaron Roth, and Zhiwei Steven Wu. 2018. Prevent- ing fairness gerrymandering: Auditing and learning for subgroup fairness. In International conference on machine learning. PMLR, 2564–2572
2018
-
[32]
Michael Kearns, Seth Neel, Aaron Roth, and Zhiwei Steven Wu. 2019. An empiri- cal study of rich subgroup fairness for machine learning. InProceedings of the conference on fairness, accountability, and transparency. 100–109
2019
-
[33]
Adam R Klivans and Rocco Servedio. 2001. Learning DNF in time. InProceedings of the thirty-third annual ACM symposium on Theory of computing. 258–265
2001
-
[34]
Thorsten Koch, Timo Berthold, Jaap Pedersen, and Charlie Vanaret. 2022. Progress in Mathematical Programming Solvers from 2001 to 2020.EURO Journal on Computational Optimization10 (Jan. 2022), 100031. doi:10.1016/j.ejco.2022.100031
2022
-
[35]
Kullback and R
S. Kullback and R. A. Leibler. 1951. On Information and Sufficiency.The Annals of Mathematical Statistics22, 1 (1951), 79 – 86. doi:10.1214/aoms/1177729694
1951
-
[36]
Connor Lawless, Sanjeeb Dash, Oktay Gunluk, and Dennis Wei. 2023. Inter- pretable and Fair Boolean Rule Sets via Column Generation.Journal of Machine Learning Research24, 229 (2023), 1–50
2023
-
[37]
Yunseok Lee, Holger Boche, and Gitta Kutyniok. 2024. Computability of Op- timizers.IEEE Transactions on Information Theory70, 4 (2024), 2967–2983. doi:10.1109/TIT.2023.3347071
2024
-
[38]
Anning Liu, Jian-Guo Liu, and Yulong Lu. 2019. On the rate of convergence of em- pirical measure in∞-wasserstein distance for unbounded density function.Quart. Appl. Math.77, 4 (2019), pp. 811–829. https://www.jstor.org/stable/26839553
2019
-
[39]
Dmitry Malioutov and Kush Varshney. 2013. Exact Rule Learning via Boolean Compressed Sensing. InProceedings of the 30th International Conference on Ma- chine Learning. PMLR, 765–773
2013
-
[40]
Marvin L Minsky and Seymour A Papert. 1988. Perceptrons: expanded edition
1988
-
[41]
2018.Foundations of machine learning
Mehryar Mohri, Afshin Rostamizadeh, and Ameet Talwalkar. 2018.Foundations of machine learning. MIT press
2018
-
[42]
Rahul Nair, Massimiliano Mattetti, Elizabeth Daly, Dennis Wei, Oznur Alkan, and Yunfeng Zhang. 2021. What Changed? Interpretable Model Comparison.. In IJCAI. 2855–2861
2021
-
[43]
Junhyun Nam, Hyuntak Cha, Sungsoo Ahn, Jaeho Lee, and Jinwoo Shin
-
[44]
Daniel Neill, Edward McFowland, and Huanian Zheng. 2013. Fast subset scan for multivariate event detection.Statistics in medicine32 (06 2013). doi:10.1002/sim. 5675
2013 doi
-
[45]
Khai Nguyen and Nhat Ho. 2022. Amortized Projection Optimiza- tion for Sliced Wasserstein Generative Models. InAdvances in Neu- ral Information Processing Systems, S. Koyejo, S. Mohamed, A. Agarwal, D. Belgrave, K. Cho, and A. Oh (Eds.), Vol. 35. Curran Associates, Inc., KDD ’...
2022
-
[46]
Victor M Panaretos and Yoav Zemel. 2019. Statistical aspects of Wasserstein distances.Annual review of statistics and its application6, 1 (2019), 405–431
2019
-
[47]
European Parliament and European Council. 2024. Regulation (EU) 2024/1689 of the European Parliament and of the Council of 13 June 2024 laying down harmonised rules on artificial intelligence and amending Regulations (EC) No 300/2008, (EU) No 167/2013, (EU) No 168/2013, (EU) 2...
2024
-
[48]
2022.Towards a standard for identifying and managing bias in artificial intelligence
Reva Schwartz, Apostol Vassilev, Kristen Greene, Lori Perine, Andrew Burt, and Patrick Hall. 2022.Towards a standard for identifying and managing bias in artificial intelligence. Vol. 3. US Department of Commerce, National Institute of Standards and Technology
2022
-
[49]
2014.Understanding machine learning: From theory to algorithms
Shai Shalev-Shwartz and Shai Ben-David. 2014.Understanding machine learning: From theory to algorithms. Cambridge university press
2014
-
[50]
Skyler Speakman, Sriram Somanchi, Edward McFowland, and Daniel Neill. 2015. Penalized Fast Subset Scanning.Journal of Computational and Graphical Statistics 25 (04 2015), 00–00. doi:10.1080/10618600.2015.1029578
2015
-
[51]
Varshney, and Dmitry M
Guolong Su, Dennis Wei, Kush R. Varshney, and Dmitry M. Malioutov. 2016. Learning Sparse Two-Level Boolean Rules. In2016 IEEE 26th International Work- shop on Machine Learning for Signal Processing (MLSP). 1–6. doi:10.1109/MLSP. 2016.7738856
2016
-
[52]
Behrooz Tahmasebi and Stefanie Jegelka. 2023. Sample Complexity Bounds for Estimating the Wasserstein Distance under Invariances.2nd Annual Workshop on Topology, Algebra, and Geometry in Machine Learning (TAG-ML)(2023). https: //openreview.net/forum?id=3fpo7JBC27
2023
-
[53]
Sriperumbudur, and Bernhard Schölkopf
Ilya O Tolstikhin, Bharath K. Sriperumbudur, and Bernhard Schölkopf
-
[54]
Alexandre B Tsybakov. 2009. Nonparametric estimators.Introduction to Non- parametric Estimation(2009), 1–76
2009
-
[55]
Gregory Valiant and Paul Valiant. 2011. Estimating the unseen: an n/log (n)- sample estimator for entropy and support size, shown optimal via new CLTs. In Proceedings of the forty-third annual ACM symposium on Theory of computing. 685–694
2011
-
[56]
Leonid Nisonovich Vaserstein. 1969. Markov processes over denumerable prod- ucts of spaces, describing large systems of automata.Problemy Peredachi Infor- matsii5, 3 (1969), 64–72
1969
- [57]
-
[58]
Jonathan Weed and Francis Bach. 2019. Sharp asymptotic and finite-sample rates of convergence of empirical measures in Wasserstein distance.Bernoulli25, 4A (2019), 2620 – 2648. doi:10.3150/18-BEJ1065
2019 doi
-
[59]
Dennis Wei, Sanjeeb Dash, Tian Gao, and Oktay Gunluk. 2019. Generalized linear rule models. InInternational conference on machine learning. PMLR, 6687–6696
2019
-
[60]
Geoffrey Wolfer and Aryeh Kontorovich. 2021. Statistical estimation of ergodic Markov chain kernel over discrete state space.Bernoulli27, 1 (2021), 532 – 553. doi:10.3150/20-BEJ1248
2021 doi
-
[61]
Laurence A. Wolsey. 2021.Integer Programming(second edition ed.). Wiley, Hoboken, NJ
2021
-
[62]
normalization
Zhe Zhang and Daniel B Neill. 2016. Identifying significant predictive bias in classifiers.arXiv preprint arXiv:1611.08292(2016). Appendix A Experiment details Each experiment was run on an internal cluster. Each node had 32 GB of RAM and either an AMD EPYC 7543 or an Intel Xe...
2016 arXiv
-
[2016]
InAdvances in Neural Information Processing Systems, D
Minimax Estimation of Maximum Mean Discrepancy with Ra- dial Kernels. InAdvances in Neural Information Processing Systems, D. Lee, M. Sugiyama, U. Luxburg, I. Guyon, and R. Garnett (Eds.), Vol. 29. Curran Associates, Inc. https://proceedings.neurips.cc/paper_files/paper/2016/f...
2016
-
[2020]
In Advances in Neural Information Processing Systems, H
Learning from Failure: De-biasing Classifier from Biased Classifier. In Advances in Neural Information Processing Systems, H. Larochelle, M. Ran- zato, R. Hadsell, M.F. Balcan, and H. Lin (Eds.), Vol. 33. Curran Associates, Inc., 20673–20684. https://proceedings.neurips.cc/pap...
2020
-
[2021]
http://jmlr.org/papers/v22/20-451.html
POT: Python Optimal Transport.Journal of Machine Learning Research22, 78 (2021), 1–8. http://jmlr.org/papers/v22/20-451.html
2021
Reviewed August 9, 2026 · model on record in the stance chip above.
Discussion (0). Continue with ORCID to comment.