REVIEW 3 major objections 6 minor 44 references
The Radial Distribution Functions of Nanofluids: Molecular Dynamics Simulations
T0 review · 3 major / 6 minor · reviewed 2026-07-10 · grok-4.5
Pith's one-line read Soft nanoparticles of 28 atoms lose their two-shell structure in a polymer melt when temperature rises; larger ones of 42 and 56 atoms keep it.
desk verdict Clear size-dependent ARDF observation in a carefully documented homemade CG model, but the stability claim rests on visual contour inspection without a quantitative metric. read the letter →
The pith
A machine-rendered reading of the paper's core claim, the machinery that carries it, and where it could break.
The reading
What carries the argument
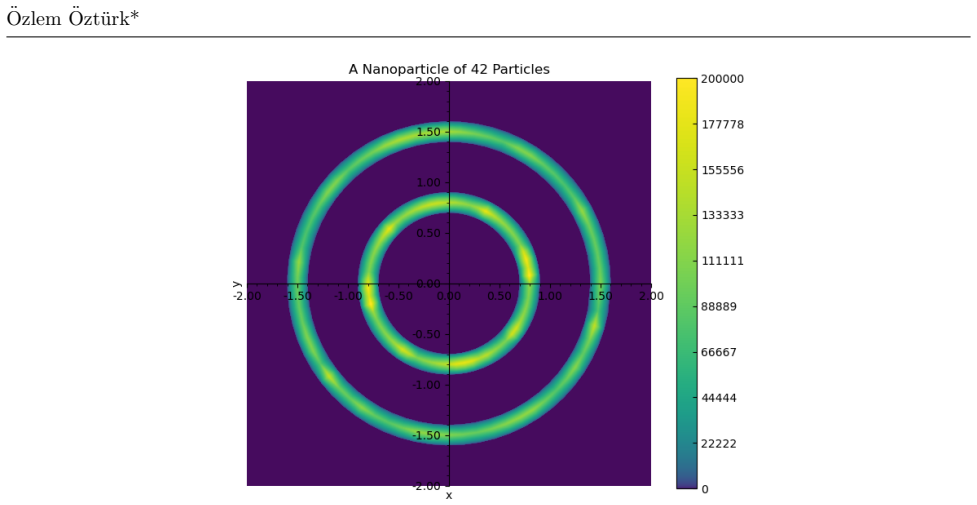
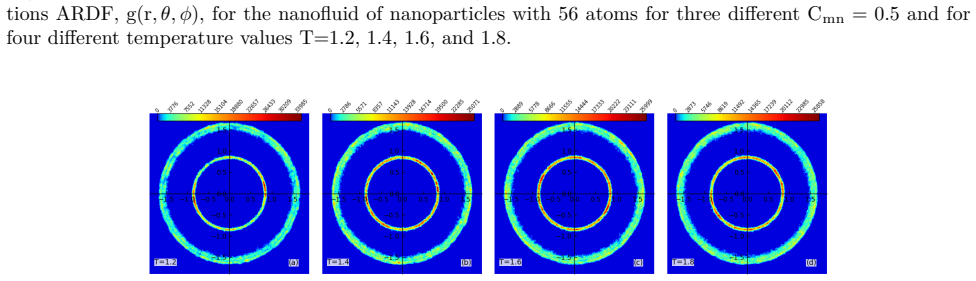
Angle-dependent three-dimensional radial distribution functions (ARDF) rendered as two-dimensional contour maps of particle density relative to the nanoparticle centre; the maps are used as a visual order parameter that reveals whether the inter-shell vacuum remains open or fills.
What would settle it
Recompute the ARDF maps with a finer radial mesh and longer trajectories, then check whether a free-energy or shell-occupancy order parameter still shows a clear transition for the 28-atom particles while remaining flat for the 42- and 56-atom particles under the same temperature ramp.
Extended reading notes
Core claim
Inside a polymer melt, soft nanoparticles of 28 atoms lose the empty vacuum between their two concentric shells and therefore lose the two-shell architecture when the temperature is raised from T=1.2 to T=1.8; nanoparticles of 42 and 56 atoms preserve the same concentric-shell structure under identical temperature increases and under reduced nanoparticle–polymer affinity.
Load-bearing premise
That the visual closing of the inter-shell gap on ARDF contour maps, without a quantitative free-energy or occupancy measure, is enough to declare thermodynamic shape instability.
Signed reviews
Editorial analysis
A structured set of objections, weighed in public.
Referee Report
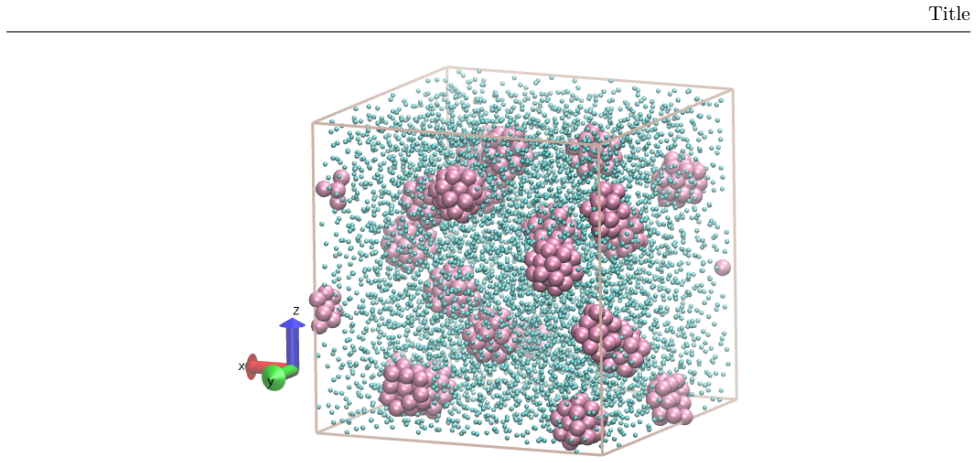
Summary. The manuscript reports coarse-grained NVE molecular-dynamics simulations of polymeric nanofluids containing soft nanoparticles of 28, 42, and 56 atoms in a linear polymer melt. Nanoparticles are constructed as a central atom FENE-bonded to the remaining atoms, which self-organize into two concentric shells; interactions are 12-6 LJ (monomer–monomer, intra-NP) and modified LJ with tunable C_nn and C_mn (inter-NP and NP–monomer). One-dimensional RDFs and angle-dependent three-dimensional ARDFs are computed both for pure nanoparticles and for the nanofluids over T = 1.2–1.8 and C_mn = 0.1, 0.5, 1.0. The central claim is that 28-atom nanoparticles lose their inter-shell vacuum and two-shell structure inside the melt upon heating, whereas 42- and 56-atom nanoparticles preserve concentric shells under the same temperature rise and under reduced NP–monomer affinity. Supporting material includes construction/equilibration protocols, pure-NP shell radii, mean-force magnitude profiles, and extensive contour maps.
Significance. If the size-dependent shape-stability claim is robust, the work supplies a concrete, simulation-based design rule for soft nanoparticles in polymer melts and demonstrates that ARDFs can diagnose internal shell integrity. The manuscript is unusually transparent about potentials, neighbor lists, construction algorithms, and equilibration (velocity rescaling, Maxwellian checks, Boltzmann H-function for a test LJ liquid). The qualitative trend—28-atom shells fill while 42/56 do not—is consistent across the plotted C_mn and T windows. Those strengths make the study potentially useful for the nanofluid and soft-matter communities once the stability criterion is placed on a quantitative footing.
major comments (3)
- The size-dependent stability claim (Abstract; section “Angle Dependent Three-Dimensional Radial Distribution Functions for Nanofluids,” Figs. 26–28 vs. 29–34) rests on visual inspection of 2-D ARDF contour maps (mesh Δr = Δθ = Δφ = 0.1, 5×10^5 frames). No radial density ρ(r) of non-central NP atoms, shell-occupancy order parameter, gap-density time series, free-energy histogram, or fluctuation/barrier analysis is reported. Thermal broadening alone can fill a ~0.43-wide gap on a coarse mesh without a structural transition. A quantitative metric (e.g., time-averaged density in Rin < r < Rout, or a two-shell order parameter) is required before “breaks down / disappears” language can establish thermodynamic shape instability.
- Pure-nanoparticle controls (Figs. 10–16 and associated ARDFs) are shown only at T = 1.2. Without the same ARDF/RDF series for isolated 28-, 42-, and 56-atom nanoparticles at T = 1.4–1.8, the fluid’s role cannot be separated from simple heating. The Abstract and instability-analysis claim that the particles were researched “both within the base fluid and without this polymeric medium”; the missing high-T pure-NP data leave that comparison incomplete and weaken the attribution of instability specifically to the melt environment.
- Mean-force magnitude profiles (Figs. 35–37) are presented as supporting material but are never linked quantitatively to the shell-stability conclusion. The bimodal features are interpreted as signatures of outer-shell thickness, yet no comparison of force peaks (or their temperature evolution) between the 28-atom and larger particles is used to corroborate or refute the visual ARDF claim. Either integrate these data into the stability argument or clarify that they are independent of it.
minor comments (6)
- Figure 9 caption repeats “nanoparticle of 28 particles” while the surrounding text and Fig. 8 refer to 42- and 56-atom systems; correct the caption.
- Table 2 lists Ain and Aout as integers (11, 23, …) without units or explanation of rounding; either report continuous surface areas or state that they are atom counts.
- Several figure panels (e.g., Figs. 23–25) are dense; increasing line contrast or adding a legend inset would improve readability.
- Typographical inconsistencies appear throughout (e.g., “Corsed-Grained,” “tirbunes,” “degredation,” “purporse,” “distirbutions”); a careful copy-edit is needed.
- The long introductory survey of nanofluid applications is only loosely connected to the RDF/ARDF results; a shorter motivation focused on dispersion stability and soft-particle structure would tighten the narrative.
- Eqs. (7)–(8) and the definition of C_αβ are clear, but the text sometimes writes U_αβ(r) for both the unshifted and shifted forms; a single consistent notation would help.
Circularity Check
No circularity: shape-stability claims are direct visual observations from MD-computed ARDF contour maps; interaction parameters and nanoparticle construction are free inputs, not fitted to or defined by the stability conclusion.
full rationale
The paper’s derivation chain is a standard MD workflow: construct soft nanoparticles via FENE + LJ (with chosen R0, k, d0, r0), equilibrate them, insert into a polymer melt with chosen C_nn=0.1 and C_mn values, integrate trajectories in the NVE ensemble, then compute one-dimensional RDFs and three-dimensional ARDFs directly from particle coordinates (homemade binning algorithms given explicitly). The size-dependent stability statements (28-atom shells collapse between T=1.2 and T=1.8 while 42- and 56-atom shells persist) are qualitative readings of the resulting 2-D ARDF contour maps (Figs. 26–34). No parameter is fitted to a stability target and then re-used as a “prediction”; C_nn and C_mn are free control parameters that set interaction strength; the pure-NP controls (Figs. 10–16) are independent runs at fixed T=1.2. Citations are to standard algorithms (Verlet, Kremer–Grest FENE, Numerical Recipes RNG) and external experimental/application literature; none is a load-bearing self-citation of a uniqueness theorem or ansatz that forces the present result. The chain therefore contains no self-definitional loop, no fitted-input-called-prediction, and no renaming of a known result. (Weakness of the visual criterion is a separate evidence issue, not circularity.)
Assumptions & free parameters
free parameters (6)
- C_nn (nanoparticle–nanoparticle attraction coefficient) =
0.1
- C_mn (nanoparticle–monomer attraction coefficient) =
0.1, 0.5, 1.0
- FENE R0 for nanoparticles =
1.52 / 1.62 / 1.71
- Construction r0 and d0 =
r0=1.50–1.69; d0=0.55
- Bulk number densities at P≈0 =
0.815 / 0.820 / 0.825
- Temperature window and nanoparticle count =
T=1.2..1.8; N_par=20
assumptions (4)
- domain assumption Pairwise additive truncated-shifted 12-6 LJ plus FENE bonds (Kremer–Grest style) adequately represent neutral polymer melts and soft nanoparticles for structural RDF analysis.
- domain assumption NVE integration with velocity-Verlet and prior velocity-rescaling equilibration yields equilibrium configurations whose RDFs/ARDFs report true thermodynamic structure.
- ad hoc to paper Visual persistence or disappearance of the inter-shell vacuum on ARDF contour maps equals shape stability or instability.
- standard math Minimum-image convention and spherical-shell binning with Δr=0.1 (RDF) / mesh 0.1 (ARDF) correctly estimate local densities for the reported box sizes.
invented entities (1)
-
Two-concentric-shell soft nanoparticle (central atom FENE-bonded to N−1 outer atoms that self-organize into Rin/Rout shells)
Cite this review
Pith. "Pith review of The Radial Distribution Functions of Nanofluids: Molecular Dynamics Simulations." pith.science (2026). https://pith.science/paper/5DWWCTIH
@misc{pith2026260708527,
  author       = {Pith},
  title        = {Pith review of: The Radial Distribution Functions of Nanofluids: Molecular Dynamics Simulations},
  year         = {2026},
  howpublished = {\url{https://pith.science/paper/5DWWCTIH}},
  note         = {Machine review of arXiv:2607.08527}
}
read the original abstract
Nanofluids, which are composed of insoluble, stable, and well-dispersed solid particles of nanoscale and/or subnanometer sizes suspended in a base liquid, are the next generation of liquids of today. The purpose of this paper is to investigate the one dimensional and three dimensional angle dependent radial distribution functions RDF and ARDF of polymeric nanofluids made up of nonrigid (soft) nanoparticles and a polymer melt (base fluid) using the molecular dynamics simulation approach and to search the shape stabilities by using these results. For this purpose, we use the nanoparticles of three different sizes: 28, 42, and 56 particles. We research them both within the base fluid and without this polymeric medium for instability analysis. We found that the nanoparticles with 28 atoms show the shape instability inside the base fluid when we increase the system temperature from T=1.2 to T=1.8 and hence, the structure of two concentric spherical shell of the nanoparticle breaks down and as a result the empty vacuum between these inner and the outer shells disappears. In contrast to this findings, the nanoparticles with 42 and 56 atoms show the shape stability inside the base fluid by preserving their concentric shell structures when we rise the system temperature and decrease the affinity between the nanoparticles and the base liquid medium.
Figures


Figures from the paper (34 more)







Reference graph
Works this paper leans on
-
[1]
S. U. S. Choi and J. A. Eastman. Enhancing thermal conductivity of fluids with nanoparticles.ASME International Mechanical Engineering Congress and Exposition Proceedings, 231:99, 1995
work page 1995
- [2]
- [3]
- [4]
-
[5]
T. Kavitha and S. Kuma. Turning date palm fronds into biocompatible mesoporous fluorescent carbon dots. Scientific Reports, 8:1, 2018
work page 2018
-
[6]
S. Zomorodbakhsh, Y. Abbasian, M. Naghinejad, and M. Sheikhpour. The effects study of isoniazid conjugated multi-wall carbon nanotubes nanofluid onMycobacterium tuberculosis.International Journal of Nanomedicine, 15:5901, 2020
work page 2020
-
[7]
D. Tripathi and O. A. B´ eg. A study on peristaltic flow of nanofluids: Application in drug delivery systems. International Journal of Heat and Mass Transfer, 70:61, 2014
work page 2014
- [8]
Show all 44 references
-
[9]
K. Y. Leong, R. Saidur, S. N. Kazi, and A. H. Mamun. Performance investigation of an automotive car radiator operated with nanofluid-based coolants (nanofluid as a coolant in a radiator).Applied Thermal Engineering, 30:2685, 2010
2010
-
[10]
Hadad, A
K. Hadad, A. Hajizadeh, K. Jafarpour, and B. D. Ganapol. Neutronic study of nanofluids application to VVER- 1000.Annals of Nuclear Energy, 37:1447, 2010
2010
-
[11]
P. Yi, A. A. Kayani, A. F. Chrimes, K. Ghorbani, S. Nahavandi, K. Kalantar-zadeh, and K. Khoshmanesh. Thermal analysis of nanofluids in microfluidics using an infrared camera.Lab on a Chip, 12:2520, 2012
2012
-
[12]
D. P. Dubal and P. Gomez-Romero. Electroactive graphene nanofluids for fast energy storage.2D Materials, 3:1–5, 2016
2016
-
[13]
P. S. G. Natividade, G. M. Moura, E. Avallone, E. P. B. Filho, R. V. Gelamo, and J. C. S. I. Gon¸ calves. Experimental analysis applied to an evacuated tube solar collector equipped with parabolic concentrator using multilayer graphene- based nanofluids.Renewable Energy, 138:152, 2019
2019
-
[14]
Hedayatnasab, F
Z. Hedayatnasab, F. Abnisa, and W. M. A. W. Daud. Review on magnetic nanoparticles for magnetic nanofluid hyperthermia application.Materials and Design, 123:174, 2017
2017
-
[15]
R. K. Gilchrist, R. Medal, W. D. Shorey, R. C. Hanselman, J. C. Parrott, and C. B. Taylor. Selective inductive heating of lymph nodes.Annals of Surgery, 146:596, 1957. p-31 ¨Ozlem ¨Ozt¨ urk*
1957
-
[16]
J. t. Jang, J. Lee, J. Seon, E. Ju, M. Kim, Y. I. Kim, M. G. Kim, Y. Takemura, A. S. Arbab, K. W. Kang, K. H. Park, S. H. Paek, and S. Bae. Giant magnetic heat induction of magnesium-dopedγ-Fe 2O3 superparamagnetic nanoparticles for completely killing tumors.Advanced Materials...
2018
-
[17]
Kaka¸ c and H
S. Kaka¸ c and H. Liu.Heat Exchangers: Selection, Rating, and Thermal Design. CRC Press, 2 edition, 2002
2002
-
[18]
Farajollahi, S
B. Farajollahi, S. Gh. Etemad, and M. Hojjat. Heat transfer of nanofluids in a shell and tube heat exchanger. International Journal of Heat and Mass Transfer, 53:12, 2010
2010
-
[19]
S. s. Bi, L. Shi, and L. l. Zhang. Application of nanoparticles in domestic refrigerators.Applied Thermal Engineering, 28:1834, 2008
2008
-
[20]
T. O. Babarinde, S. A. Akinlabi, and D. M. Madyira. Energy performance evaluation of R600a/MWCNTnanolubricant as a drop-in replacement for R134a in household refrigerator system.Energy Reports, 6:639, 2020
2020
-
[21]
A. D. Risi, M. Milanese, G. Colangelo, and D. Laforgia, High efficiency nanofluid cooling system for wind turbines. Thermal Science, 18:543, 2014
2014
-
[22]
Kalogirou.Solar Energy Engineering Processes and Systems
Soteris A. Kalogirou.Solar Energy Engineering Processes and Systems. Academic Press USA, 2 edition, 2014
2014
-
[23]
Markides, Robert A
Omid Mahian, Evangelos Bellos, Christos N. Markides, Robert A. Taylor, Avinash Alagumalai, Liu Yang, Caiyan Qin, Bong Jae Lee, Goodarz Ahmadi, Mohammad Reza Safaei, and Somchai Wongwises. Recent advances in using nanofluids in renewable energy systems and the environmental imp...
2021
-
[24]
Solar evaporation enhancement using floating light-absorbing magnetic particles.Energy & Enviromental Science, 4:4074, 2011
Yao Zeng, Jianfeng Yao, Bahman Amini Horri, Kun Wang, Yuzhou Wu, Dan Li, and Huanting Wang. Solar evaporation enhancement using floating light-absorbing magnetic particles.Energy & Enviromental Science, 4:4074, 2011
2011
-
[25]
Koilraj Gnanadason, P
M. Koilraj Gnanadason, P. Senthil Kumar, G.Jemilda, and S.Sherin Jasper. Effect of nanofluids in vacuum single basin solar still.International Journal of Scientific & Engineering Research, 3:1, 2012
2012
-
[26]
Lovedeep Sahota and G.N. Tiwari. Exergoeconomic and enviroeconomic analyses of hybrid double slope solar still loaded with nanofluids.Energy Conversion and Management, 148:413, 2017
2017
-
[27]
Computer
Verlet, L. “Computer ””Experiments”” On Classical Fluids. I. Thermodynamical Properties of Lennard- Jones Molecules” .Physical Review, 159, 98-103
-
[28]
Haile.Molecular Dynamics Simulations: Elementary Methods
J.M. Haile.Molecular Dynamics Simulations: Elementary Methods. Wiley, New York, 1992
1992
-
[29]
L. G. MacDowell, M. M¨ uller, C. Vega, and K. Binder. Equation of state and critical behavior of polymer models: A quantitative comparison between Wertheim’s thermodynamic perturbation theory and computer simulations. Journal of Chemical Physics, 113:419, 2000
2000
-
[30]
M¨ uller and L
M. M¨ uller and L. G. MacDowell. Wetting of a short chain liquid on a brush: First-order and critical wetting transitions.Europhysics Letters, 55:221, 2001
2001
-
[31]
Pastorino, T
C. Pastorino, T. Kreer, M. M¨ uller, and K. Binder. Comparison of dissipative particle dynamics and Langevin thermostats for out-of-equilibrium simulations of polymeric systems.Physical Review E, 76:026706, 2007
2007
-
[32]
Servantie and M
J. Servantie and M. M¨ uller. Statics and dynamics of a cylindrical droplet under an external body force.Journal of Chemical Physics, 128:014709, 2008
2008
-
[33]
Servantie and M
J. Servantie and M. M¨ uller. Temperature dependence of the slip length in polymer melts at attractive surfaces. Physical Review Letters, 101:026101, 2008
2008
-
[34]
Pastorino and A
C. Pastorino and A. Gama Goicochea. Dissipative particle dynamics: A method to simulate soft matter systems in equilibrium and under flow.Springer International Publishing Switzerland 2015 J. Klapp et al. (eds.) Selected Topics of Computational and Experimental Fluid Mechanics...
2015
-
[35]
W. H. Press, S. A. Teukolsky, W. T. Vetterling, and B. P. Flannery.Numerical Recipes in Fortran 77: The Art of Scientific Computing. Cambridge University Press, 2 edition, 1992
1992
-
[36]
Baschnagel and F
J. Baschnagel and F. Varnik. Computer simulations of supercooled polymer melts in the bulk and in confined geometry.Journal of Physics: Condensed Matter, 17:R851, 2005
2005
-
[37]
Grest and K
G.S. Grest and K. Kremer. Molecular dynamics simulation for polymers in the presence of a heat bath.Physical Review A, 33:3628, 1986
1986
-
[38]
Kremer and G.S
K. Kremer and G.S. Grest. Dynamics of entangled linear polymer melts: a molecular-dynamics simulation.The Journal of Chemical Physics, 92:5057, 1990
1990
-
[39]
M. D. Hanwell, D. E. Curtis, D. C. Lonie, T. Vandermeersch, E. Zurek, and G. R. Hutchison;. Avogadro: An advanced semantic chemical editor, visualization, and analysis platform.Journal of Cheminformatics, 4:17, 2012
2012
-
[40]
Humphrey, et
H. Humphrey, et. al. VMD: Visual Molecular Dynamics,Journal of Molecular Graphics, 14, 33, 1996
1996
-
[41]
Barrat and L
J.-L. Barrat and L. Bocquet. Influence of Wetting Properties on Hydrodynamic Boundary Conditions at a Fluid/Solid Interface,Faraday Discussions, 112, 119, 1999
1999
-
[42]
M. J. P. Nijmeijer, A. F. Bakker, and C. Bruin. A molecular dynamics simulation of the Lennard-Jones liquid-vapor interface.Journal of Chemical Physics, 89:3789, 1988
1988
-
[43]
P. Orea, Y. Duda, and J. Alejandre. Surface tension of a square well fluid.Journal of Chemical Physics, 118:5635, 2003
2003
-
[44]
and Smit, B.,Understanding Molecular Simulation: From Algorithms to Applications, 3rd Edition, Academic Press, 2023
Frenkel, D. and Smit, B.,Understanding Molecular Simulation: From Algorithms to Applications, 3rd Edition, Academic Press, 2023. p-32
2023
Reviewed July 10, 2026 · model on record in the stance chip above.
Discussion (0). Continue with ORCID to comment.