REVIEW 5 minor 1 cited by
What is estimated in cluster randomized crossover trials with informative sizes? -- A survey of estimands and common estimators
T0 review · 0 major / 5 minor · reviewed 2026-08-16 · deepseek-v4-flash
Pith's one-line read This paper asks what common estimators in two-period cluster randomized crossover (CRXO) trials actually estimate when cluster, period, or cluster-period sizes carry information about treatment effects, and derives which estimators…
desk verdict A careful, useful mapping of CRXO estimators to causal estimands under informative sizes; the consistency table is the real contribution, and the paper deserves serious peer review. read the letter →
The pith
A machine-rendered reading of the paper's core claim, the machinery that carries it, and where it could break.
The reading
What carries the argument
The central object is the family of weighted average treatment effect estimands, $wATE=\sum_{i,j,k}w_{ijk}(Y_{ijk}(1)-Y_{ijk}(0))/\sum_{i,j,k}w_{ijk}$, with weights $1$, $1/K_{ij}$, $1/\sum_j K_{ij}$, and $1/\sum_i K_{ij}$ selecting the iATE, cpATE, cATE, and pATE. The consistency proofs expand each estimator's probability limit under the i.i.d. cluster superpopulation assumption and check which limit equals one of these weighted forms. For the nested exchangeable mixed model, the limiting per-cluster weight is proportional to $1/[1+(K_{i-}-1)\rho_{wp}-K_{i-}\rho_{bp}]$, so whenever this factor varies with cluster-period size the limit is a data-dependent weighted average outside the named estimand family.
What would settle it
Under the paper's own assumptions, simulate a 2-period CRXO with treatment effects that depend on cluster-period size, e.g. $Y_{ijk}(1)-Y_{ijk}(0)=a+bK_{ij}$, and compute the unweighted IEE estimate as $I$ grows; for the central claim to hold, it must converge to $\mathbb{E}[\sum_{j,k}(a+bK_{ij})]/\mathbb{E}[\sum_j K_{ij}]$, the individual-average limit, not to the equally weighted cluster-period average. A data-generating process satisfying cluster i.i.d. sampling and independent randomization that produces a different probability limit would refute the always-consistency result.
Extended reading notes
Core claim
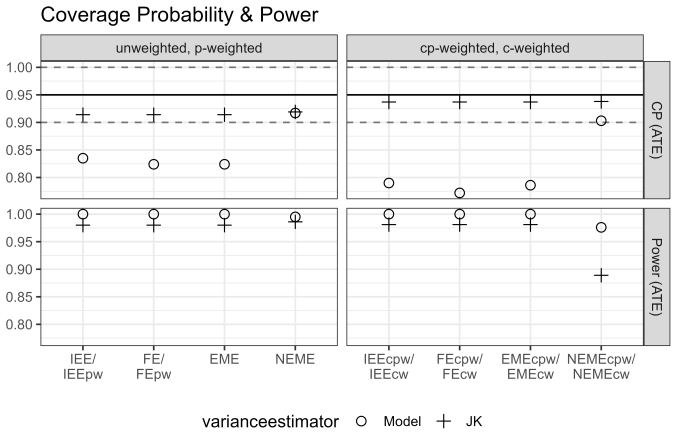
The paper claims that, in a 2-period, 2-sequence cross-sectional CRXO trial with continuous outcomes and clusters drawn as i.i.d. superpopulation units, the unweighted IEE estimator is always consistent for the iATE, $\mathbb{E}[\sum_{j=1}^2\sum_{k=1}^{K_{ij}}(Y_{ijk}(1)-Y_{ijk}(0))]/\mathbb{E}[\sum_{j=1}^2 K_{ij}]$, and the IEEcpw, IEEcw, and IEEpw estimators are always consistent for the cpATE, cATE, and pATE, respectively, regardless of informative sizes. The same is true of the FEcpw estimator for cpATE. The exchangeable mixed effects model is consistent for iATE (and its inverse-size weighted forms for cpATE/cATE) only when cluster-period sizes are equal within clusters, $K_{i1}=K_{i2}$ for all $i$; the fixed effects model generally converges to pATE rather than iATE unless a constant period-size ratio $\lambda_i=\lambda$ holds. The nested exchangeable mixed effects model, unweighted or weighted, converges to limits like $\mathbb{E}\{ [1+(K_{i-}-1)\rho_{wp}-K_{i-}\rho_{bp}]^{-1} \sum_{j,k}(Y_{ijk}(1)-Y_{ijk}(0))\}/\mathbb{E}\{2K_{i-}[1+(K_{i-}-1)\rho_{wp}-K_{i-}\rho_{bp}]^{-1}\}$, which depends on cluster sizes and on estimated within- and between-period ICCs and is generally not iATE, cpATE, cATE, or pATE. Simulations confirm the derived relative biases, and a reanalysis of a 49-cluster CRXO trial shows NEME estimates drifting from the IEE-based estimates.
Load-bearing premise
All stated probability limits assume clusters are independent, identically distributed draws from an infinite superpopulation and that the treatment sequence is independent of potential outcomes and all cluster-period sizes; the GLS limits also assume the variance components converge to fixed values rather than being re-estimated in a way that shifts the weights.
Editorial extensions
If this is right
- When informative sizes are plausible, the unweighted IEE estimator gives a defensible estimate of the individual-average treatment effect without requiring a no-informative-sizes assumption.
- Weighted IEE estimators (IEEcpw, IEEcw, IEEpw) give defensible estimates of cluster-period, cluster, and period average effects, so a pre-specified analysis can use them to answer each level of hypothesis.
- NEME-based estimates should not be interpreted as targeting any of the four estimands if treatment effects vary with cluster, period, or cluster-period size; a notable gap between NEME and IEE estimates may itself signal informative sizes.
- Fixed effects and exchangeable mixed models are usable for their intended estimands only under restrictions such as $K_{i1}=K_{i2}$ (or a constant period-size ratio for fixed effects); otherwise an FE analysis may be estimating the period-average rather than the individual-average effect.
Reading between the lines
- A natural testable extension is a sensitivity diagnostic that reports IEE, IEEcw, IEEpw, and IEEcpw estimates side by side; under the paper's consistency map, material differences among them indicate which sizes are informative, although the paper explicitly notes it does not provide a formal statistical test.
- The FE result suggests that protocols pre-specifying fixed-effects analyses in CRXO trials should also pre-specify the target as pATE (or verify a constant period-size ratio), since the FE estimator's estimand depends on the balance of period sizes rather than on the analyst's intent.
- One can quantify how far a NEME estimate is from any named estimand by plugging estimated ICCs and observed cluster sizes into the limiting weight $1/[1+(K_{i-}-1)\hat{\rho}_{wp}-K_{i-}\hat{\rho}_{bp}]$ and reporting the implied weighted average as a sensitivity target.
Signed reviews
Editorial analysis
A structured set of objections, weighed in public.
Referee Report
Summary. This paper studies four target estimands for 2-period cross-sectional cluster randomized crossover (CRXO) trials with continuous outcomes: the individual-average (iATE), cluster-period-average (cpATE), cluster-average (cATE), and period-average (pATE) treatment effects. It formalizes informative cluster, period, and cluster-period sizes, and derives the probability limits of unweighted and inverse-size-weighted versions of the independence estimating equation (IEE), fixed effects (FE), exchangeable mixed effects (EME), and nested exchangeable mixed effects (NEME) estimators under an iid superpopulation model in which sequence assignment is independent of potential outcomes and cluster-period sizes. The central results are: the unweighted IEE is always consistent for the iATE, and its inverse cluster-period, inverse cluster, and inverse period size weighted counterparts are always consistent for the cpATE, cATE, and pATE; EME and weighted EME are consistent for iATE, cpATE, and cATE when Ki1=Ki2; NEME and its weighted versions generally converge to weighted estimands with data-dependent weights and are not consistent for any of the four estimands; and FE results require lambda_i=lambda for all i and often target the pATE or cpATE instead of the iATE or cATE. A simulation study and a reanalysis of the PEPTIC CRXO trial illustrate and apply these results.
Significance. If the results hold, the paper provides a practical and theory-grounded map from common estimators to well-defined causal estimands in CRXO trials, and it sharpens warnings about the use of NEME in the presence of informative sizes. The algebra in Appendices C through F is detailed, and the simulation results are consistent with the stated theory in the specified DGP. The finite-population versus superpopulation distinction is explicitly acknowledged as a scope condition, and the derivations rely on clearly stated assumptions. I could not identify a load-bearing error in the central consistency mapping. The main caveat is that the exact NEME limits are derived for GLS weights with fixed variance components; the manuscript acknowledges the dependence on probability limits of estimated ICCs, which is sufficient for the qualitative conclusion but should be stated more precisely.
minor comments (5)
- [Section 5.2 and Appendix H] The DGP description states delta_2 = 0.6, but the formulas and numerical values immediately afterward use delta_2 = 0.5 (for example, the iATE formula yielding 0.53 uses delta_2 = 0.6, while the following parenthetical says delta_2 = 0.5); please reconcile the two values, since the reported bias results correspond to only one specification.
- [Section 4.2.1, Eq. (26)] The probability limit is derived for GLS weights with fixed variance components, while in practice the NEME weights use estimated ICCs; please state explicitly that Eq. (26) is the limit under variance components fixed at their probability limits and that the feasible GLS estimator is assumed to share this limit.
- [Appendix B] The proof of Proposition 1.2 is described as a proof by induction, but it proceeds by constructing an example; please correct the wording to 'by example' or 'by construction.'
- [Data Availability Statement] The statement 'no new data were created or analyzed' conflicts with the reanalysis of the PEPTIC trial dataset in Section 6; please amend the statement to reflect that existing trial data were reanalyzed.
- [Section 3.3] The NEME covariance matrix block is defined only under Ki1 = Ki2, and this restriction is later used for the NEME results; please flag the equal-within-cluster-period-size assumption at the first definition to avoid confusion for readers who encounter the restriction only in Section 4.
Circularity Check
No significant circularity identified; consistency results are derived from explicitly stated randomization and superpopulation assumptions rather than from fitted constants or self-citation.
full rationale
The paper's central claims are derivations, not definitions in disguise. The estimands iATE, cpATE, cATE, and pATE are defined in Section 2 and Table 1 directly from potential outcomes Y_ijk(1)-Y_ijk(0) with explicit individual-level weights w_ijk, independently of any estimator. The estimators in Section 3 are standard OLS/GLS/weighted estimating-equation estimators, and the consistency claims in Section 4 and Appendices C-F follow by taking probability limits under the stated superpopulation model with independent and identically distributed clusters and sequence independence S_i ⊥ Ω = {Y_ijk(0), Y_ijk(1), K_ij}. For example, Equation (17) is the probability limit of the explicit IEE estimator in Equation (16), not a fitted parameter renamed as a prediction; similarly, (19), (22), and (24) are limits of the explicitly weighted IEE estimators. The NEME limits in (26) and (28) are stated for GLS weights and the paper explicitly notes that the data-dependent weights involve the probability limits of model-based ICC estimators, which is a technical caveat about misspecification rather than circularity. Self-citations to prior P-CRT and PB-CRT work [17, 18] and to the wATE family [10] are used as background and motivation; the CRXO-specific results are derived in the paper's own appendices and do not rest on an unverified self-citation chain or an imported uniqueness theorem. No step in the derivation reduces to its own input by construction.
Assumptions & free parameters
assumptions (6)
- domain assumption Clusters are independent and identically distributed draws from an infinite superpopulation of clusters.
- domain assumption Cluster-level Stable Unit Treatment Value Assumption: Y_ijk = S_i Y_ijk(1) + (1 - S_i) Y_ijk(0), no interference between units.
- domain assumption Randomization: the sequence indicator S_i is independent of potential outcomes and cluster-period sizes, S_i independent of Omega.
- domain assumption For GLS estimators (EME, NEME), the estimated variance components converge in probability to fixed limits (rho_wp, rho_bp) so plug-in weights yield the stated limits.
- standard math Regularity conditions for laws of large numbers applied to i.i.d. cluster-level quantities (K_i1, K_i2, potential outcomes), with finite expectations.
- domain assumption A 2-period, 2-sequence CRXO design with equal allocation of clusters to sequences (I/2 per sequence) and cross-sectional sampling of individuals.
Cite this review
Pith. "Pith review of What is estimated in cluster randomized crossover trials with informative sizes? -- A survey of estimands and common estimators." pith.science (2026). https://pith.science/paper/5EGMV4OC
@misc{pith2026250500925,
  author       = {Pith},
  title        = {Pith review of: What is estimated in cluster randomized crossover trials with informative sizes? -- A survey of estimands and common estimators},
  year         = {2026},
  howpublished = {\url{https://pith.science/paper/5EGMV4OC}},
  note         = {Machine review of arXiv:2505.00925}
}
read the original abstract
In the analysis of cluster randomized trials (CRTs), previous work has defined two meaningful estimands: the individual-average treatment effect (iATE) and cluster-average treatment effect (cATE) estimand, to address individual and cluster-level hypotheses. In multi-period CRT designs, such as the cluster randomized crossover (CRXO) trial, additional weighted average treatment effect estimands help fully reflect the longitudinal nature of these trial designs, namely the cluster-period-average treatment effect (cpATE) and period-average treatment effect (pATE). We define different forms of informative sizes, where the treatment effects vary according to cluster, period, and/or cluster-period sizes, which subsequently cause these estimands to differ in magnitude. Under such conditions, we demonstrate which of the unweighted, inverse cluster-period size weighted, inverse cluster size weighted, and inverse period size weighted: (i.) independence estimating equation, (ii.) fixed effects model, (iii.) exchangeable mixed effects model, and (iv.) nested exchangeable mixed effects model treatment effect estimators are consistent for the aforementioned estimands in 2-period cross-sectional CRXO designs with continuous outcomes. We report a simulation study and conclude with a reanalysis of a CRXO trial testing different treatments on hospital length of stay among patients receiving invasive mechanical ventilation. Notably, with informative sizes, the unweighted and weighted nested exchangeable mixed effects model estimators are not consistent for any meaningful estimand and can yield biased results. In contrast, the unweighted and weighted independence estimating equation, and under specific scenarios, the fixed effects model and exchangeable mixed effects model, can yield consistent and empirically unbiased estimators for meaningful estimands in 2-period CRXO trials.
Figures


Figures from the paper (12 more)



Forward citations
Cited by 1 Pith paper
-
Model-robust standardization in stepped wedge cluster randomized trials
A model-robust standardization framework estimates four distinct average treatment effect estimands in stepped-wedge cluster randomized trials, remaining consistent under working model misspecification.
Reference graph
Works this paper leans on
-
[1]
Turner EL, Prague M, Gallis JA, Li F, Murray DM. Review of Recent Methodological Developments in Group-Randomized Trials: Part 2—Analysis.American Journal of Public Health.2017;107(7):1078–
work page 2017
-
[2]
Arnup SJ, McKenzie JE, Hemming K, Pilcher D, Forbes AB. Understanding the cluster randomised crossover design: a graphical illustration of the components of variation and a sample size tutorial. Trials.2017;18(1):381. doi: 10.1186/s13063-017-2113-2
-
[3]
Hemming K, Taljaard M, Weijer C, Forbes AB. Use of multiple period, cluster randomised, crossover trial designs for comparative effectiveness research.BMJ.2020;371:m3800. Publisher: British Medical Journal Publishing Group Section: Research Methods & Reportingdoi: 10.1136/bmj.m3800
-
[4]
McKenzie JE, Taljaard M, Hemming K, et al. Reporting of cluster randomised crossover trials: ex- tension of the CONSORT 2010 statement with explanation and elaboration.BMJ.2025:e080472. doi: 10.1136/bmj-2024-080472
-
[5]
Grantham KL, Kasza J, Heritier S, Hemming K, Litton E, Forbes AB. How many times should a cluster randomized crossover trial cross over?.Statistics in Medicine.2019;38(25):5021–5033. eprint: https://onlinelibrary.wiley.com/doi/pdf/10.1002/sim.8349doi: 10.1002/sim.8349
-
[6]
Turner RM, White IR, Croudace T. Analysis of cluster randomized cross-over trial data: a comparison of methods.Statistics in Medicine.2007;26(2):274–289. eprint: https://onlinelibrary.wiley.com/doi/pdf/10.1002/sim.2537doi: 10.1002/sim.2537 39
-
[7]
Li F, Forbes AB, Turner EL, Preisser JS. Power and sample size requirements for GEE anal- yses of cluster randomized crossover trials.Statistics in Medicine.2019;38(4):636–649. eprint: https://onlinelibrary.wiley.com/doi/pdf/10.1002/sim.7995doi: 10.1002/sim.7995
-
[8]
Morgan KE, Forbes AB, Keogh RH, Jairath V, Kahan BC. Choosing appropriate analysis methods for cluster randomised cross-over trials with a binary outcome.Statistics in Medicine.2017;36(2):318–333. doi: 10.1002/sim.7137
Show all 46 references
-
[9]
Model-Assisted Analyses of Cluster-Randomized Experiments.Journal of the Royal Sta- tistical Society Series B: Statistical Methodology.2021;83(5):994–1015
Su F, Ding P. Model-Assisted Analyses of Cluster-Randomized Experiments.Journal of the Royal Sta- tistical Society Series B: Statistical Methodology.2021;83(5):994–1015. doi: 10.1111/rssb.12468
2021 doi
-
[10]
Model-assisted analysis of covariance estimators for stepped wedge clus- ter randomized experiments.Scandinavian Journal of Statistics.2025;52(1):416–446
Chen X, Li F. Model-assisted analysis of covariance estimators for stepped wedge clus- ter randomized experiments.Scandinavian Journal of Statistics.2025;52(1):416–446. eprint: https://onlinelibrary.wiley.com/doi/pdf/10.1111/sjos.12755doi: 10.1111/sjos.12755
2025 doi
-
[11]
Demystifying estimands in cluster-randomised tri- als.Statistical Methods in Medical Research.2024;33(7):1211–1232
Kahan BC, Blette BS, Harhay MO, et al. Demystifying estimands in cluster-randomised tri- als.Statistical Methods in Medical Research.2024;33(7):1211–1232. arXiv:2303.13960 [stat]doi: 10.1177/09622802241254197
2024 arXiv
-
[12]
Informative cluster size in cluster-randomised trials: A case study from the TRIGGER trial.Clinical Trials (London, England).2023;20(6):661–669
Kahan BC, Li F, Blette B, Jairath V, Copas A, Harhay M. Informative cluster size in cluster-randomised trials: A case study from the TRIGGER trial.Clinical Trials (London, England).2023;20(6):661–669. doi: 10.1177/17407745231186094
2023 doi
-
[13]
The Essential Role of Pair Matching in Cluster-Randomized Experiments, with Application to the Mexican Universal Health Insurance Evaluation.Statistical Science.2009;24(1):29–53
Imai K, King G, Nall C. The Essential Role of Pair Matching in Cluster-Randomized Experiments, with Application to the Mexican Universal Health Insurance Evaluation.Statistical Science.2009;24(1):29–53. Publisher: Institute of Mathematical Statisticsdoi: 10.1214/08-STS274
2009 doi
-
[14]
Marginal Analyses of Clustered Data When Cluster Size is Infor- mative.Biometrics.2003;59(1):36–42
Williamson JM, Datta S, Satten GA. Marginal Analyses of Clustered Data When Cluster Size is Infor- mative.Biometrics.2003;59(1):36–42. doi: 10.1111/1541-0420.00005
2003
-
[15]
Inference for Cluster Randomized Experiments with Non-ignorable Cluster Sizes
Bugni F, Canay I, Shaikh A, Tabord-Meehan M. Inference for Cluster Randomized Experiments with Non-ignorable Cluster Sizes. 2024. arXiv:2204.08356 [econ, stat]
2024 arXiv
-
[16]
Model-Robust and Efficient Covariate Adjustment for Cluster-Randomized Experiments.Journal of the American Statistical Association.2024;0(0):1–
Wang B, Park C, Small DS, Li F. Model-Robust and Efficient Covariate Adjustment for Cluster-Randomized Experiments.Journal of the American Statistical Association.2024;0(0):1–
2024
-
[17]
Two weights make a wrong: Cluster randomized trials with variable cluster sizes and heterogeneous treatment effects.Contemporary Clinical Trials.2022;114:106702
Wang X, Turner EL, Li F, et al. Two weights make a wrong: Cluster randomized trials with variable cluster sizes and heterogeneous treatment effects.Contemporary Clinical Trials.2022;114:106702. doi: 10.1016/j.cct.2022.106702 40
2022
-
[18]
Publisher: Taylor & Francis eprint: https://doi.org/10.1080/01621459.2023.2289693doi: 10.1080/01621459.2023.2289693
2023
-
[19]
Estimands in cluster-randomized trials: choosing analy- ses that answer the right question.International Journal of Epidemiology.2023;52(1):107–118
Kahan BC, Li F, Copas AJ, Harhay MO. Estimands in cluster-randomized trials: choosing analy- ses that answer the right question.International Journal of Epidemiology.2023;52(1):107–118. doi: 10.1093/ije/dyac131
2023 doi
-
[20]
How Should Parallel Cluster Randomized Trials With a Baseline Period be An- alyzed?—A Survey of Estimands and Common Estimators.Biometrical Journal.2025;67(3):e70052
Lee KM, Li F. How Should Parallel Cluster Randomized Trials With a Baseline Period be An- alyzed?—A Survey of Estimands and Common Estimators.Biometrical Journal.2025;67(3):e70052. eprint: https://onlinelibrary.wiley.com/doi/pdf/10.1002/bimj.70052doi: 10.1002/bimj.70052
2025 doi
-
[21]
Cluster randomized trial designs for modeling time-varying intervention effects
Lee KM, Cheung YB. Cluster randomized trial designs for modeling time-varying intervention effects. Statistics in Medicine.2024;43(1):49–60. doi: 10.1002/sim.9941
2024 doi
-
[22]
Analysis of Stepped-Wedge Cluster Randomized Trials when treatment effect varies by exposure time or calendar time
Lee KM, Turner EL, Kenny A. Analysis of Stepped-Wedge Cluster Randomized Trials when treatment effect varies by exposure time or calendar time. 2024. arXiv:2409.14706
2024 arXiv
-
[23]
Stepped wedge designs: insights from a design of experiments perspective
Matthews JNS, Forbes AB. Stepped wedge designs: insights from a design of experiments perspective. Statistics in Medicine.2017;36(24):3772–3790. doi: 10.1002/sim.7403
2017 doi
-
[24]
Appropriate statistical methods were infrequently used in cluster-randomized crossover trials.Journal of Clinical Epidemiology.2016;74:40–
Arnup SJ, Forbes AB, Kahan BC, Morgan KE, McKenzie JE. Appropriate statistical methods were infrequently used in cluster-randomized crossover trials.Journal of Clinical Epidemiology.2016;74:40–
2016
-
[25]
Allison PD.Fixed Effects Regression Models, 2009
2009
-
[26]
The fixed-effects model for robust analysis of stepped-wedge cluster trials with a small number of clusters and continuous outcomes: a simulation study.Trials.2024;25(1):718
Lee KM, Cheung YB. The fixed-effects model for robust analysis of stepped-wedge cluster trials with a small number of clusters and continuous outcomes: a simulation study.Trials.2024;25(1):718. doi: 10.1186/s13063-024-08572-1
2024 doi
-
[27]
On the Pooling of Time Series and Cross Section Data.Econometrica.1978;46(1):69–85
Mundlak Y. On the Pooling of Time Series and Cross Section Data.Econometrica.1978;46(1):69–85. Publisher: [Wiley, Econometric Society]doi: 10.2307/1913646
1978 doi
-
[28]
Lee KM, Yang GM, Cheung YB. Inclusion of unexposed clusters improves the precision of fixed effects analysis of stepped-wedge cluster randomized trials with binary and count outcomes.BMC Medical Research Methodology.2024;24(1):254. doi: 10.1186/s12874-024-02379-z
2024 doi
-
[29]
Using simulation studies to evalu- ate statistical methods.Statistics in Medicine.2019;38(11):2074–2102
Morris TP, White IR, Crowther MJ. Using simulation studies to evalu- ate statistical methods.Statistics in Medicine.2019;38(11):2074–2102. eprint: https://onlinelibrary.wiley.com/doi/pdf/10.1002/sim.8086doi: 10.1002/sim.8086 41
2019 doi
-
[30]
Inclusion of unexposed clusters improves the precision of fixed effects analysis of stepped-wedge cluster randomized trials.Statistics in Medicine.2022:sim.9394
Lee KM, Ma X, Yang GM, Cheung YB. Inclusion of unexposed clusters improves the precision of fixed effects analysis of stepped-wedge cluster randomized trials.Statistics in Medicine.2022:sim.9394. doi: 10.1002/sim.9394
2022 doi
-
[31]
Bias reduction in standard errors for linear regression with multi-stage samples
Bell RM, McCaffrey DF. Bias reduction in standard errors for linear regression with multi-stage samples. Survey Methodology.2002;28(2):169–182
2002
-
[32]
Maintaining the validity of inference from linear mixed models in stepped-wedge cluster randomized trials under misspecified random-effects structures
Ouyang Y, Taljaard M, Forbes AB, Li F. Maintaining the validity of inference from linear mixed models in stepped-wedge cluster randomized trials under misspecified random-effects structures. 2024. arXiv:2308.07248 [stat]
2024 arXiv
-
[33]
WeMix: Weighted Mixed-Effects Models Using Multilevel Pseudo Maximum Likelihood Estimation
Bailey P, Webb B, Kelley C, Nguyen T, Huo H. WeMix: Weighted Mixed-Effects Models Using Multilevel Pseudo Maximum Likelihood Estimation. 2018. Institution: Comprehensive R Archive Network Pages: 4.0.3
2018
-
[34]
Small-Sample Methods for Cluster-Robust Variance Estimation and Hy- pothesis Testing in Fixed Effects Models.Journal of Business & Economic Statistics.2018;36(4):672–
Pustejovsky JE, Tipton E. Small-Sample Methods for Cluster-Robust Variance Estimation and Hy- pothesis Testing in Fixed Effects Models.Journal of Business & Economic Statistics.2018;36(4):672–
2018
-
[35]
clubSandwich: Cluster-Robust (Sandwich) Variance Estimators with Small-Sample Cor- rections
Pustejovsky J. clubSandwich: Cluster-Robust (Sandwich) Variance Estimators with Small-Sample Cor- rections. 2016. Institution: Comprehensive R Archive Network Pages: 0.5.11
2016
-
[36]
Longitudinal data analysis using generalized linear models.Biometrika
Liang KY, Zeger SL. Longitudinal data analysis using generalized linear models.Biometrika. 1986;73(1):13–22. doi: 10.1093/biomet/73.1.13
1986 doi
-
[37]
The PEPTIC Investigators for the Australian and New Zealand Intensive Care Society Clinical Trials Group, Alberta Health Services Critical Care Strategic Clinical Network, and the Irish Critical Care Trials Group , Young PJ, Bagshaw SM, et al. Effect of Stress Ulcer Prophylaxi...
2020
-
[38]
P2 j=1 PKij k=1 [Yijk(1)−Y ijk(0)] P2 j=1Kij # =E
Giraudeau B, Ravaud P, Donner A. Sample size calculation for cluster ran- domized cross-over trials.Statistics in Medicine.2008;27(27):5578–5585. eprint: https://onlinelibrary.wiley.com/doi/pdf/10.1002/sim.3383doi: 10.1002/sim.3383 42 A General conditions under which the descr...
2008 doi
-
[40]
Sample size determination for GEE analyses of stepped wedge cluster randomized trials.Biometrics.2018;74(4):1450–1458
Li F, Turner EL, Preisser JS. Sample size determination for GEE analyses of stepped wedge cluster randomized trials.Biometrics.2018;74(4):1450–1458. eprint: https://onlinelibrary.wiley.com/doi/pdf/10.1111/biom.12918doi: 10.1111/biom.12918
2018 doi
-
[43]
We assume that the sample of clusters is a simple random sample from a superpopulation of clusters
Accordingly: E[ˆδIEEcpw|Ω] = 1 I IX i=1 1 2 PKi1 k=1Yi1k(1) Ki1 + PKi2 k=1Yi2k(1) Ki2 − PKi1 k=1Yi1k(0) Ki1 − PKi2 k=1Yi2k(0) Ki2 !! = 1 I IX i=1 1 2 2X j=1 PKij k=1Yijk(1) Kij − PKij k=1Yijk(0) Kij ! . We assume that the sample of clusters is a simple random sample from...
-
[44]
(E[Ai|Si] +E[Ci|1−S i]) ((E[Ai|Si] +E[Ci|1−S i])E[Bi]−(E[B i|1−S i] +E[Ci|Si])E[Ci]) +( 1
-
[45]
(E[Bi|1−S i] +E[Ci|Si]) ((E[Ai|Si] +E[Ci|1−S i])E[Ci]−(E[B i|1−S i] +E[Ci|Si])E[Ai]). −1 × E[Ai]E[Bi]−E[C i]2 E h PKi1 k=1Yi1k(1) Ai Ki1 |Si i +E h PKi2 k=1Yi2k(0) Ci Ki2 |Si i +E h PKi1 k=1Yi1k(0) Ci Ki1 |1−S i i +E h ...
-
[46]
PKi1 k=1Yi1k(1)P2 j=1Kij − PKi1 k=1Yi1k(0)P2 j=1Kij # + 1 1 +λE
Accordingly: E[ˆδFEcpw|Ω] = 1 I IX i=1 1 2 PKi1 k=1Yi1k(1) Ki1 + PKi2 k=1Yi2k(1) Ki2 − PKi1 k=1Yi1k(0) Ki1 − PKi2 k=1Yi2k(0) Ki2 !! = 1 I IX i=1 1 2 2X j=1 PKij k=1Yijk(1) Kij − PKij k=1Yijk(0) Kij ! . We assume that the sample of clusters is a simple random sample from ...
-
[50]
doi: 10.1016/j.jclinepi.2015.11.013
2015 doi
-
[683]
Publisher: Taylor & Francis eprint: https://doi.org/10.1080/07350015.2016.1247004doi: 10.1080/07350015.2016.1247004
2016
-
[1086]
doi: 10.2105/AJPH.2017.303707
2017
Reviewed August 16, 2026 · model on record in the stance chip above.
Discussion (0). Continue with ORCID to comment.