REVIEW 4 major objections 6 minor 12 references
Chest Disease Detection In X-Ray Images Using Deep Learning Classification Method
T0 review · 4 major / 6 minor · reviewed 2026-08-07 · deepseek-v4-flash
Pith's one-line read Fine-tuned CNNs classify chest X-rays into four classes at 96–98% test accuracy, and Grad-CAM heatmaps show which image regions drive each decision.
desk verdict Table 2's Xception row is mathematically impossible, so the paper's headline metric claims don't hold as printed, despite an honestly reported dataset and Grad-CAM caveats. read the letter →
The pith
A machine-rendered reading of the paper's core claim, the machinery that carries it, and where it could break.
The reading
What carries the argument
The central machinery is transfer learning: ImageNet-pretrained CNN backbones (ResNet50, VGG16, Xception, EfficientNetV2B0) with their final layers fine-tuned on the aggregated X-ray dataset, plus hyperparameter-tuned dense heads. The companion mechanism is Grad-CAM, which computes a class-discriminative saliency map from the gradient of the class score with respect to the last convolutional feature maps, producing the heatmaps that show where each model looks. Transfer learning carries the accuracy claim; Grad-CAM carries the explainability claim.
What would settle it
Compute perceptual hashes of all 57,111 images and check train/test duplicates: near-duplicate images crossing the split, or a patient-disjoint re-test with accuracy dropping materially below 96%, would falsify the generalization claim.
Extended reading notes
Core claim
On its own terms, the paper's central discovery is that fine-tuned transfer-learning CNN classifiers—ResNet50, VGG16, Xception, and EfficientNetV2B0—all exceed 96% test accuracy on a four-class chest X-ray task, with EfficientNetV2B0 highest at 98.24% and ResNet50 chosen as the best overall for stable training and strong generalization. The paper further reports that Grad-CAM visualizations can highlight lung regions a medical student also flagged as diagnostic, while also revealing that some classifications rest on class-correlated artifacts outside the lungs, meaning the models are not purely learning disease signal. The authors conclude it is possible to improve the explainability of high-performing models, with the remaining work being removal of dataset idiosyncrasies before clinical deployment.
Load-bearing premise
The accuracy claim rests on the assumption that the random split into train, validation, and test sets is fair—no duplicate or same-patient images cross the boundary and the test set represents the disease population—so if that split leaks, all reported numbers are inflated.
Editorial extensions
If this is right
- ImageNet-pretrained backbones plus a small amount of fine-tuning can produce four-class chest X-ray classifiers at 96% or better test accuracy, so a heavy custom architecture is not required.
- Grad-CAM provides a practical audit signal: when heatmaps fall outside the lungs, the model is likely exploiting dataset artifacts rather than disease signal.
- ResNet50 with only its last ten layers trainable offers a strong balance of accuracy and stability, supporting deployment where compute is limited.
- Before deployment, models need preprocessing to remove PII masks and rebalancing of patient age across classes, because those cues currently leak into classification.
Reading between the lines
- If the random image-level split is not patient-disjoint or duplicate-free, the reported 96–98% accuracy is an upper bound; a patient-exclusive split would be needed to confirm generalization.
- Because the normal class skews pediatric and several classes contain PII boxes, a model trained on this dataset is likely to transfer poorly to hospital X-rays without those artifacts; cropping and age-balancing are testable fixes.
- The Grad-CAM agreement with a single clinician on a single TB image is proof-of-concept; computing a quantitative overlap score over hundreds of images would turn this into a measurable claim.
- Public dataset aggregation of this kind likely contains near-duplicate images across sources; a deduplication pass before splitting would be the cheapest way to test how much of the accuracy is memorization.
Editorial analysis
A structured set of objections, weighed in public.
Referee Report
Summary. This manuscript reports a transfer-learning study for chest X-ray classification into four classes (COVID-19, normal, pneumonia, tuberculosis) using a combined dataset of 57,111 images. Four pre-trained CNNs (ResNet50, VGG16, Xception, EfficientNetV2B0) are fine-tuned and evaluated, and Grad-CAM is used for interpretability. The paper claims state-of-the-art accuracy, AUC, F1-score, recall, and precision on this dataset, and argues that the work improves the explainability and generalizability of high-performing models. A single medical student (SME) comparison on one tuberculosis image is presented to support the interpretability claim, and the paper candidly reports that Grad-CAM revealed class-correlated dataset artifacts such as PII boxes and arm tissue.
Significance. If the reported results were fully supported, the manuscript would provide a large multi-source benchmark for four-class chest X-ray classification, a practical comparison of four transfer-learning backbones, and a useful demonstration of Grad-CAM as a tool for surfacing dataset artifacts. The authors' honest discussion of spurious correlations in Section 6.8 is a genuine strength. However, the central empirical claims are not currently established: Table 2 contains a mathematically impossible metric combination, Section 3.1 does not describe how the train/test split was generated or whether patients were deduplicated, and the state-of-the-art claim is asserted without any head-to-head comparison to prior models on a shared benchmark. The interpretability claim rests on a single anecdotal image. The significance is therefore conditional on substantial revision.
major comments (4)
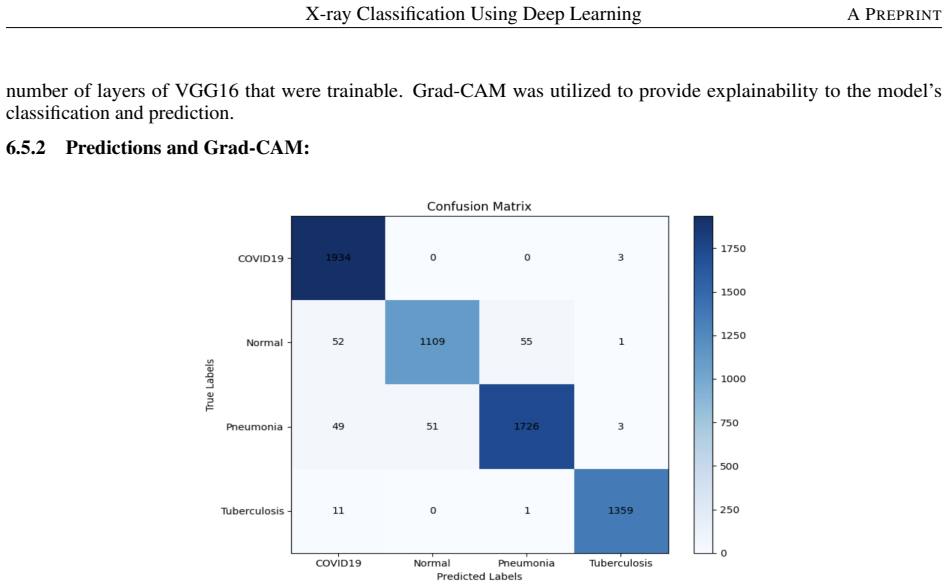
- [Table 2] Table 2, Xception row: the reported F1-score of 97.02% is mutually inconsistent with precision 69.80% and recall 99.51%. Under the standard definition F1 = 2PR/(P+R), substituting P = 0.6980 and R = 0.9951 gives F1 ≈ 0.820, not 0.9702; even a macro-average over four classes cannot reach 0.9702 in this situation unless most classes have F1 = 1.0, which conflicts with the row's aggregated precision. At least one cell in this row is numerically impossible. Because Section 6 uses these metrics to assert state-of-the-art performance and Section 7 repeats the claim, the main empirical evidence cannot be accepted as reported. Please correct the metrics, provide the confusion matrices, and state the exact averaging scheme used.
- [Section 3.1] Section 3.1 reports only folder counts for train, validation, and test splits and does not describe how the split was generated, whether duplicate images were removed across the three source datasets, or whether images from the same patient can appear in more than one split. Since the dataset combines two Kaggle sources plus TB Portal data, patient-level leakage is a real risk. If duplicate or same-patient images cross the train/test boundary, the reported test accuracies are inflated. Please describe the split procedure (random image-level vs patient-level), any deduplication steps, and how the authors verified that no individual appears in both training and test sets. This is load-bearing for the generalization claims in Sections 6 and 7.
- [Section 6 and Section 7] The claim of 'state of the art accuracy, AUC, F1-score, recall, and precision' is not supported by the experiments as reported. No prior model is evaluated on the same test split, and the literature reviewed in Section 4 uses different datasets, class sets, and evaluation protocols. The statement in Section 6 that the dataset is the largest for this four-class task does not by itself establish state-of-the-art performance. To support the claim, the paper should either include direct head-to-head comparisons on a shared benchmark or substantially scope the claim down to 'high accuracy on this aggregated dataset.' Without such a comparison, the central novelty claim is unsubstantiated.
- [Sections 6.3 and 6.8] The interpretability claim is supported by a single anecdotal comparison of one tuberculosis image in Section 6.3. Section 6.8 itself reports that Grad-CAM frequently highlighted non-diagnostic features such as PII boxes and arm tissue, and the authors note instability in heatmap generation. With one image, no quantitative overlap metric, and no systematic evaluation across classes, the conclusion in Section 7 that the work improves the explainability of high-performing models is not established. A quantitative evaluation, e.g., Grad-CAM overlap with expert annotations on multiple images per class or a localization benchmark, would be needed to support this claim.
minor comments (6)
- [Abstract and Section 3.1] The manuscript contains grammatical errors and typos, e.g., 'on a labeled medical x-ray images' in the Abstract and 'to a be significant challenge' in Section 3.1. The paper should be carefully proofread.
- [Figure 3] Figure 3 shows an elephant image from the Keras Grad-CAM example, which is irrelevant to chest X-ray analysis. Replace it with a chest X-ray example or remove it.
- [Section 6.4.1 and 6.7.1] There are typos such as 'cov2' (should be 'conv2') and 'Notablly' (should be 'Notably'). These should be corrected.
- [Section 6.2] Section 6.2 selects ResNet50 as the best model based on validation performance, but Table 2 shows EfficientNetV2B0 has higher test accuracy (98.24% vs 97.99%). The selection rule should be stated more explicitly and consistently.
- [Section 6.8] Section 6.8 notes that Grad-CAM heatmaps differed depending on whether a single image or a group of images was displayed. This is a reproducibility concern; please clarify the technical cause and how results were generated consistently, or move this to a clearly labeled limitation.
- [Section 5.1] The exact pretrained model versions and deep learning framework (e.g., Keras/TensorFlow) are not specified. Please provide this information for reproducibility, including any preprocessing normalize details for each architecture.
Circularity Check
No circular derivation: test metrics are measured on a held-out split; the Xception metric inconsistency and SOTA overclaim are correctness issues, not circularity.
full rationale
The paper is an empirical transfer-learning study, not a derivation. The central results in Section 6 and Table 2 (accuracy, AUC, F1-score, recall, precision) are measurements on a held-out test folder, and the models are standard pre-trained CNNs fine-tuned on a separate training folder. There is no fitted parameter renamed as a prediction and no equation that reduces a claimed output to its own input. The Grad-CAM analysis is qualitative and does not constitute a derivation. The phrase 'state of the art accuracy ... using our bespoke dataset' is an overclaim because no external benchmark or shared comparison set is used, but that is a validity or framing problem, not circularity. Likewise, the internally inconsistent Xception row (F1 = 97.02% with precision 69.80% and recall 99.51% is arithmetically impossible under standard micro-averaging and implausible under macro-averaging) is a correctness risk in the reported evidence, not a circularity of reasoning. No load-bearing self-citation appears: the cited prior works are external, and the paper's own empirical loop is standard supervised learning with an independent test split.
Assumptions & free parameters
free parameters (4)
- Validation-selected hyperparameters (dense layer size, activation, learning rate, trainable layer count) =
Not fully reported; EfficientNetV2B0 example: 225 neurons, 0.4 dropout, learning rate 1e-4 then 5e-5
- Fixed training duration and early stopping behavior =
10 epochs; early stopping and ReduceLROnPlateau used without stated patience
- Dataset split assignment =
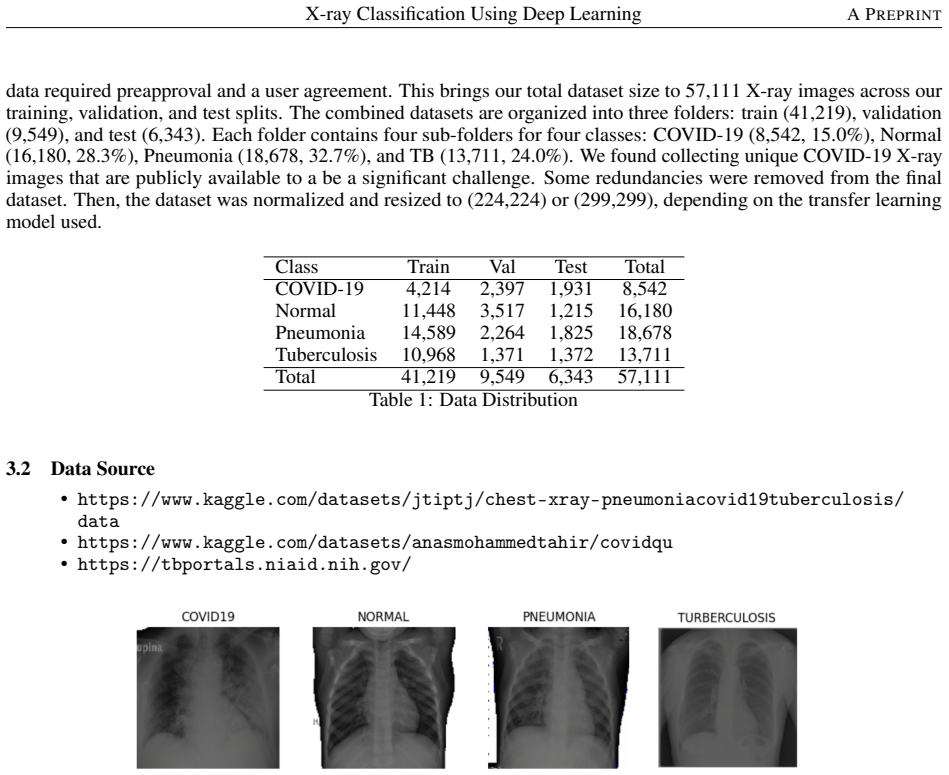
Train 41,219, validation 9,549, test 6,343 images
- Added TB samples and class composition =
10,374 TB images added; class shares COVID 15.0%, Normal 28.3%, Pneumonia 32.7%, TB 24.0%
assumptions (5)
- domain assumption ImageNet-pretrained weights transfer useful visual features to chest X-rays.
- domain assumption Source dataset labels (Kaggle and TB Portal) are correct ground truth.
- domain assumption The train/validation/test folders are independent and free of patient overlap.
- standard math Gradient descent on these architectures reaches a sufficiently good optimum within 10 epochs.
- ad hoc to paper A larger dataset than comparable prior work implies stronger generalization.
Cite this review
Pith. "Pith review of Chest Disease Detection In X-Ray Images Using Deep Learning Classification Method." pith.science (2026). https://pith.science/paper/5EPAJHR4
@misc{pith2026250522609,
  author       = {Pith},
  title        = {Pith review of: Chest Disease Detection In X-Ray Images Using Deep Learning Classification Method},
  year         = {2026},
  howpublished = {\url{https://pith.science/paper/5EPAJHR4}},
  note         = {Machine review of arXiv:2505.22609}
}
read the original abstract
In this work, we investigate the performance across multiple classification models to classify chest X-ray images into four categories of COVID-19, pneumonia, tuberculosis (TB), and normal cases. We leveraged transfer learning techniques with state-of-the-art pre-trained Convolutional Neural Networks (CNNs) models. We fine-tuned these pre-trained architectures on a labeled medical x-ray images. The initial results are promising with high accuracy and strong performance in key classification metrics such as precision, recall, and F1 score. We applied Gradient-weighted Class Activation Mapping (Grad-CAM) for model interpretability to provide visual explanations for classification decisions, improving trust and transparency in clinical applications.
Figures


Figures from the paper (11 more)




Reference graph
Works this paper leans on
-
[1]
Alex Rosenthal, Andrei Gabrielian, Eric Engle, Darrell E Hurt, Sofia Alexandru, Valeriu Crudu, Eugene Sergueev, Valery Kirichenko, Vladzimir Lapitskii, Eduard Snezhko, Vassili Kovalev, Andrei Astrovko, Alena Skrahina, Jessica Taaffe, Michael Harris, Alyssa Long, Kurt Wollenberg, Irada Akhundova, Sharafat Ismayilova, Aliaksandr Skrahin, Elcan Mammadbayov, ...
work page 2017
-
[2]
C.V. Aravinda, Meng Lin, K.R. Udaya Kumar Reddy, and G. Amar Prabhu. A demystifying convolutional neural networks using grad- CAM for prediction of coronavirus disease ( COVID -19) on x-ray images. In Data Science for COVID -19 , pages 429--450. Elsevier, 2021. ISBN 9780128245361. doi:10.1016/B978-0-12-824536-1.00037-X. URL https://linkinghub.elsevier.com...
-
[3]
Kavita Thakur, Manjot Kaur, and Yogesh Kumar. A comprehensive analysis of deep learning-based approaches for prediction and prognosis of infectious diseases. Archives of computational methods in engineering : state of the art reviews, pages 1--21, jun 2023. doi:10.1007/s11831-023-09952-7. URL http://dx.doi.org/10.1007/s11831-023-09952-7
-
[4]
Inception-v4, inception- ResNet and the impact of residual connections on learning
Christian Szegedy, Sergey Ioffe, Vincent Vanhoucke, and Alex Alemi. Inception-v4, inception- ResNet and the impact of residual connections on learning. arXiv, 2016. doi:10.48550/arxiv.1602.07261. URL https://arxiv.org/abs/1602.07261
-
[5]
Deep residual learning for image recognition
Kaiming He, Xiangyu Zhang, Shaoqing Ren, and Jian Sun. Deep residual learning for image recognition. arXiv, 2015. doi:10.48550/arxiv.1512.03385. URL https://arxiv.org/abs/1512.03385
-
[6]
Very deep convolutional networks for large-scale image recognition
Karen Simonyan and Andrew Zisserman. Very deep convolutional networks for large-scale image recognition. arXiv, 2014. doi:10.48550/arxiv.1409.1556. URL https://arxiv.org/abs/1409.1556
-
[7]
Linda Wang, Zhong Qiu Lin, and Alexander Wong. COVID -net: a tailored deep convolutional neural network design for detection of COVID -19 cases from chest x-ray images. Scientific Reports, 10 0 (1): 0 19549, nov 2020. doi:10.1038/s41598-020-76550-z. URL http://dx.doi.org/10.1038/s41598-020-76550-z
-
[8]
Hassaan Malik, Tayyaba Anees, Muizzud Din, and Ahmad Naeem. CDC\_Net : multi-classification convolutional neural network model for detection of COVID -19, pneumothorax, pneumonia, lung cancer, and tuberculosis using chest x-rays. Multimedia tools and applications, 82 0 (9): 0 13855--13880, 2023. doi:10.1007/s11042-022-13843-7. URL http://dx.doi.org/10.100...
Show all 12 references
-
[9]
COVID ‑19 detection from chest x-ray images using transfer learning
Enas M F El Houby. COVID ‑19 detection from chest x-ray images using transfer learning. Scientific Reports, 14 0 (1): 0 11639, may 2024. doi:10.1038/s41598-024-61693-0. URL http://dx.doi.org/10.1038/s41598-024-61693-0
2024 doi
-
[10]
Detection of COVID -19 based on chest x-rays using deep learning
Walaa Gouda, Maram Almurafeh, Mamoona Humayun, and Noor Zaman Jhanjhi. Detection of COVID -19 based on chest x-rays using deep learning. Healthcare (Basel), 10 0 (2), feb 2022. doi:10.3390/healthcare10020343. URL http://dx.doi.org/10.3390/healthcare10020343
2022 doi
-
[11]
Hands-On Machine Learning with Scikit-Learn, Keras, and TensorFlow : Concepts, Tools, and Techniques to Build Intelligent Systems
Aurélien Géron. Hands-On Machine Learning with Scikit-Learn, Keras, and TensorFlow : Concepts, Tools, and Techniques to Build Intelligent Systems . O'Reilly Media, Beijing [China], 2 edition, nov 2019. ISBN 9781492032649
2019
- [12]
Reviewed August 7, 2026 · model on record in the stance chip above.
Discussion (0). Sign in to comment.