REVIEW 3 major objections 5 minor 47 references
Commissioning of the MIRAC-5 Mid-Infrared Instrument on the MMT
T0 review · 3 major / 5 minor · reviewed 2026-08-11 · deepseek-v4-flash
Pith's one-line read MIRAC-5, a new mid-infrared camera on the MMT, reaches about 10 percent end-to-end throughput and, after a dichroic swap, should reach background-limited magnitudes of 18.0, 15.6, and 12.6 in L', M', and N' for 8-hour SNR=5 observations.
desk verdict Solid measured on-sky performance, but the headline future-dichroic sensitivities are model extrapolations, not yet validated independently. read the letter →
The pith
A machine-rendered reading of the paper's core claim, the machinery that carries it, and where it could break.
The reading
What carries the argument
The load-bearing element is the GeoSnap 1024x1024 HgCdTe detector, sensitive from 2 to 13 microns with 65 percent average quantum efficiency, deep wells, and readout rates up to 85 Hz. Its main liability, 1/f noise, is handled by the instrument's internal pupil-plane chopper and telescope nodding: pair-subtracting nearby frames reduces the 1/f term below a tenth of the Poisson shot noise of the sky and telescope background, and the paper models this with an empirical power-law term, $sigma^{2}$_1/f = $g^{2}$ k_f (nu_chopper / nu_detector)^$\alpha$, in the SNR equation. The second key component is the temporary 50:50 dichroic that currently limits throughput and adds background; the paper's projected sensitivities are computed for a planned replacement with greater than 90 percent transmission.
What would settle it
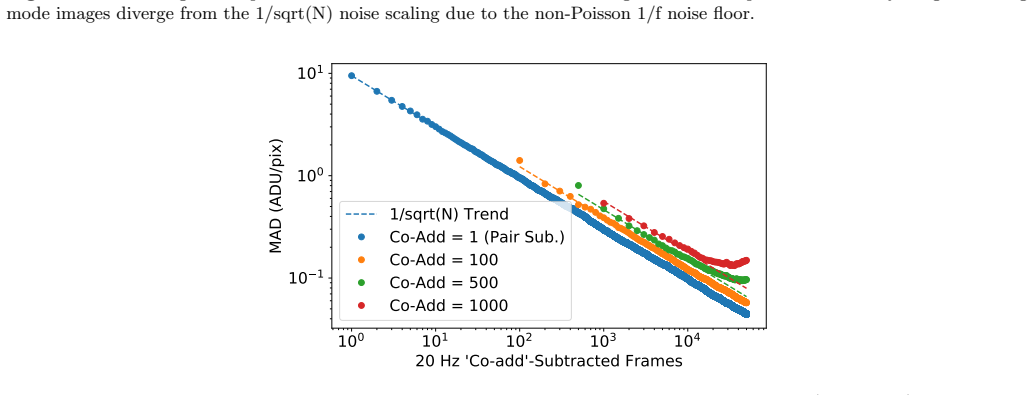
Take an 8-hour N' integration with the new dichroic installed, reduce it without temporal co-adding, and compare the median per-pixel MAD against the 1/sqrt(N) trend from Figure 5; if the noise floor departs from that trend, as the paper itself warns is possible, the quoted limiting magnitudes would need to be revised. A shorter check would be to compare the exposure time calculator's predicted background and throughput for L', M', and N' against a single night of photometry of a standard star taken after the dichroic swap.
Extended reading notes
Core claim
On the paper's own terms, the central discovery is that a ground-based mid-IR imager built around the GeoSnap detector can be made to work on a 6.5-m telescope: the measured system throughput is roughly 5 to 13 percent across the L' through N' bands, the N' point-spread function already has a 0.75 Strehl compared to an ideal Airy pattern, and the noise in chopped-and-nodded data follows 1/sqrt(N) for at least 83 minutes of integration. The same data calibrate an exposure time calculator whose predictions agree with the May 2024 Alpha Boo observations to within 10 percent. The paper's projected performance, namely L', M', and N' limiting magnitudes of 18.0, 15.6, and 12.6 at SNR=5 in 8 hours after the dichroic swap, is the quantitative statement that would make MIRAC-5 competitive for warm-companion and disk science.
Load-bearing premise
The load-bearing premise is that the noise continues to scale as 1/sqrt(N) from the measured 83-minute baseline out to 8-hour integrations, and that the empirical per-band corrections fitted to one night of Alpha Boo data remain valid for the new dichroic and for other observing conditions.
Editorial extensions
If this is right
- If the throughput and noise scaling hold, MIRAC-5 can observe warm wide-orbit companions now, before the adaptive optics and coronagraph are fully commissioned.
- After the dichroic replacement, L' and M' observations will be limited by ambient dark current and telescope and instrument emission, with limiting magnitudes of 18.0 and 15.6.
- With the AGPM coronagraph and MAPS adaptive optics, the instrument should reach contrast-limited performance comparable to JWST's MIRI for close-in companions, enabling searches for ammonia at 10.6 microns.
- The calibrated exposure time calculator lets observers optimize chopper frequency and nod timing, since a 1 Hz chopper gives lower total observing time than higher frequencies for N' half-well data.
- Observing efficiency in chop and nod mode is around 90 percent, and avoiding temporal co-adding preserves the 1/sqrt(N) noise scaling.
Reading between the lines
- If the 8-hour 1/sqrt(N) extrapolation fails only mildly, MIRAC-5 would still outperform VISIR without adaptive optics, but it might fall short of the quoted 18.0 L' limit; a dedicated long-integration test would settle this.
- The same 1/f suppression by rapid modulation should carry over to GeoSnap-based instruments on extremely large telescopes, where chopper overhead may favor slower chop frequencies than naive noise arguments suggest.
- The measurement that telescope and instrument emission dominates over atmospheric emission in the N-band implies that reducing dichroic emissivity is more valuable for this instrument than observing at a drier site.
- A testable extension is that, because 1/f noise scales with number of frames rather than elapsed time, the optimal chop frequency depends on detector frame rate; future instruments could use the paper's equations to pick frequencies that maximize real SNR per wall-clock hour.
Editorial analysis
A structured set of objections, weighed in public.
Referee Report
Summary. The paper reports commissioning results for MIRAC-5, a ground-based mid-infrared imager on the 6.5-m MMT, built around a GeoSnap HgCdTe detector and supported by the MAPS adaptive optics system. The authors characterize the detector dark current, read noise, 1/f noise, pixel-to-pixel QE variations, effective sky/telescope/instrument backgrounds, on-sky throughputs, and delivered image quality using Alpha Boo data from May 2024 and additional data from other runs. They present an exposure-time calculator (ETC) calibrated to these on-sky measurements and use it to predict background-limited sensitivities. The central quantitative claims are a total current throughput of roughly 10%, a future throughput of about 20% after a dichroic upgrade, and SNR=5, 8-hour limiting magnitudes of 18.0 (L'), 15.6 (M'), and 12.6 (N') for the future configuration.
Significance. If the measured throughput, background, and image-quality characterizations are reliable, this paper provides valuable, quantitative information for the ground-based mid-infrared community, particularly regarding the GeoSnap detector's on-sky behavior and the practical mitigation of 1/f noise through chop/nod scheduling. The public exposure-time calculator is a useful tool for planning observations, and the paper makes falsifiable predictions for the planned dichroic upgrade. The strongest measured results—the backgrounds, 1/f scaling over 83 minutes, and N-band image quality—are supported by a clear reduction pipeline and on-sky data. However, the headline sensitivity numbers are ETC model outputs, not direct measurements, and their dependence on empirical corrections fitted to the same calibration dataset and on untested 8-hour noise scaling means the competitive-sensitivity claim is not yet fully established.
major comments (3)
- [§4.2 and Table 8] The future-dichroic limiting magnitudes in Table 8 are produced by the exposure-time calculator using per-bandpass empirical throughput and background corrections fitted to the May 2024 Alpha Boo data (Section 4.2). The quoted 'within 10%' agreement therefore tests internal consistency with the calibration dataset, not independent predictive accuracy. The Nov 2024 no-dichroic L' and N' data, which could serve as an external check, appear only in a footnote to Table 7 and are not used to validate the ETC or update the Table 8 predictions; the throughputs reported there (19.5% L', 12.3% N') lie below the future-dichroic predictions (22% and 17%). Please report uncertainties on the limiting magnitudes and either validate the ETC against the Nov 2024 data or present the Table 8 values explicitly as model projections that remain to be verified on sky.
- [§5.1 and Figure 5] The 8-hour limiting magnitudes assume that noise scales as 1/sqrt(N) out to 8 hours, but the longest on-sky noise-scaling measurement shown is 83 minutes (Figure 5). The authors themselves caution in Section 5.1 that 'several hour integrations may not continuously scale as 1/sqrt(t) owing to noise sources with non-Poisson distributions,' and Figure 5 demonstrates an early departure from 1/sqrt(N) when data are temporally co-added before subtraction. The abstract's headline limiting magnitudes are therefore extrapolations. Please add a quantitative discussion of how a non-Poisson noise floor or systematic background drift would affect the Table 8 limiting magnitudes, or explicitly label these numbers as optimistic projections.
- [Table 7] The throughput values in Table 7 are quoted without uncertainties, despite being derived from aperture photometry of Alpha Boo with known magnitude uncertainties (0.01-0.03 mag), a PSF with extended wings, and nod-pair subtraction with frame rejection. The abstract's central claim of 'approximately 10%' throughput and the future 20% estimate scale directly from these numbers. Please provide at least the statistical photometric uncertainties and propagate the standard-star magnitude uncertainties so that the measured throughputs can be assessed quantitatively.
minor comments (5)
- [Abstract and §1] The abstract states that MIRAC-5 was used on 'six engineering observing runs,' while Section 1 says 'five observing runs'; please harmonize the count.
- [§3.2] When reporting that effective background levels changed 'at only about a 2.5% level,' please clarify whether this is an RMS scatter or a peak-to-peak variation across the night.
- [§5.1 and Table 8] The text says the limiting magnitude calculation assumes 'an 8 hour observing window at 100% efficiency,' but Table 8 lists observing efficiencies between 91.5% and 97%. Please clarify that the 8 hours refers to science exposure time, with overheads accounted separately.
- [§2.1] Typo: 'close-loop heater control' should be 'closed-loop heater control.'
- [Table 3] The future dichroic transmission for H-band is 0.004, which is a dramatic change from the current value; a brief note explaining that the new dichroic is not intended for H-band operation would remove potential confusion.
Circularity Check
No significant circularity: the ETC is honestly calibrated to on-sky data, and the future-dichroic limiting magnitudes are extrapolations, not circular derivations.
full rationale
The derivation chain is self-contained with respect to the main instrument-performance claims. Throughputs (Table 7) are direct aperture-photometry measurements of Alpha Boo relative to the Cohen et al. (1995) model magnitudes; effective backgrounds (Table 6) are measured from dark-subtracted sky frames; read noise, dark current, 1/f noise, QE variations, and PSF/encircled-energy profiles are all derived from the paper's own on-sky and dark datasets. The exposure time calculator (Section 4.2) is explicitly described as calibrated to these results: per-bandpass empirical background and throughput adjustments are applied to 'match the program to observations,' so the quoted 'within 10%' agreement is a consistency check with the calibration data rather than an independent validation. The headline future-dichroic limiting magnitudes (18.0, 15.6, 12.6) are generated by the same ETC after applying external dichroic transmission/emission scalings, making them extrapolations; the paper itself flags the long-integration risk in Section 5.1 ('it is possible several hour integrations may not continuously scale as 1/sqrt(t) owing to noise sources with non-Poisson distributions'). This is a robustness/correctness concern, not circularity: the limiting magnitudes are new derived quantities from measured throughputs and backgrounds, not the fitted parameters themselves renamed, and no equation defines a prediction in terms of its own input. Self-citations (e.g., Leisenring et al. 2023 for GeoSnap properties and 1/f scaling) are backed in this paper by independent re-measurements, including the 83-minute November 2024 noise-scaling dataset in Figure 5. Overall, the paper is a commissioning characterization with calibrated projections rather than a circular derivation.
Assumptions & free parameters
free parameters (5)
- kf (1/f noise amplitude) =
0.012 (ADU/pix)^2
- alpha (1/f noise exponent) =
-1.348
- Empirical background adjustment per bandpass =
e.g., L' x0.94, M' x2.65, N' x0.48
- Empirical throughput adjustment per bandpass =
not tabulated
- Staring mode noise floor =
approximately 0.4 ADU/pix
assumptions (4)
- domain assumption Noise scales as 1/sqrt(N) with number of independent frames for up to 8 hours.
- domain assumption SkyCalc atmospheric emission and transmission at Paranal (2640 m) approximate conditions at MMT (2616 m) sufficiently well.
- domain assumption The current dichroic is the dominant emissive element and its replacement with a higher-transmission dichroic will scale both throughput and background as modeled.
- domain assumption Gain of 83 e-/ADU and other detector characteristics from Leisenring et al. (2023) are correct.
Cite this review
Pith. "Pith review of Commissioning of the MIRAC-5 Mid-Infrared Instrument on the MMT." pith.science (2026). https://pith.science/paper/5KCNMVC4
@misc{pith2026241210189,
  author       = {Pith},
  title        = {Pith review of: Commissioning of the MIRAC-5 Mid-Infrared Instrument on the MMT},
  year         = {2026},
  howpublished = {\url{https://pith.science/paper/5KCNMVC4}},
  note         = {Machine review of arXiv:2412.10189}
}
read the original abstract
We present results from commissioning observations of the mid-IR instrument, MIRAC-5, on the 6.5-m MMT telescope. MIRAC-5 is a novel ground-based instrument that utilizes a state-of-the-art GeoSnap (2 - 13 microns) HgCdTe detector with adaptive optics support from MAPS to study protoplanetary disks, wide-orbit brown dwarfs, planetary companions in the contrast-limit, and a wide range of other astrophysical objects. We have used MIRAC-5 on six engineering observing runs, improving its performance and defining operating procedures. We characterize key aspects of MIRAC-5's performance, including verification that the total telescope, atmosphere, instrument, and detector throughput is approximately 10%. Following a planned dichroic upgrade, the system will have a throughput of 20% and background limiting magnitudes (for SNR = 5 and 8 hour exposure times) of 18.0, 15.6, and 12.6 for the L', M', and N' filters, respectively. The detector pixels experience 1/f noise but, if the astrophysical scene is properly modulated via chopping and nodding sequences, it is less than 10% the Poisson noise from the observed background in an 85 Hz frame. We achieve close to diffraction-limited performance in the N-band and all bands are expected to reach diffraction-limited performance following the adaptive optics system commissioning. We also present an exposure time calculator calibrated to the on-sky results. In its current state, MIRAC-5 will be capable of achieving several scientific objectives including the observation of warm wide-orbit companions. Once the adaptive optics is commissioned and a coronagraph installed in 2025, MIRAC-5 will have contrast-limited performance comparable to JWST, opening new and complementary science investigations for close-in companions.
Figures


Figures from the paper (9 more)



Reference graph
Works this paper leans on
-
[1]
J., Schoeller, M., & Gondoin, P
Absil, O., Bakker, E. J., Schoeller, M., & Gondoin, P. A. 2004, in New Frontiers in Stellar Interferometry, ed. W. A. Traub, Vol. 5491, International Society for Optics and Photonics (SPIE), 1320 – 1332, doi: 10.1117/12.549311
-
[2]
Allen, D. A., & Barton, J. R. 1981, PASP, 93, 381, doi: 10.1086/130842
- [3]
-
[4]
2020, PASP, 132, 015002, doi: 10.1088/1538-3873/ab5066
Beichman, C., Ygouf, M., Llop Sayson, J., et al. 2020, PASP, 132, 015002, doi: 10.1088/1538-3873/ab5066
-
[5]
2022, A&A, 667, A165, doi: 10.1051/0004-6361/202244578
Boccaletti, A., Cossou, C., Baudoz, P., et al. 2022, A&A, 667, A165, doi: 10.1051/0004-6361/202244578
- [6]
-
[7]
Evans, J. J. Bryant, & K. Motohara, 1144737, doi: 10.1117/12.2562995
-
[8]
Bowens, R., Meyer, M. R., Delacroix, C., et al. 2021, A&A, 653, A8, doi: 10.1051/0004-6361/202141109
Show all 47 references
-
[9]
2022, in Society of Photo-Optical Instrumentation Engineers (SPIE) Conference Series, Vol
Bowens, R., Leisenring, J., Meyer, M., et al. 2022, in Society of Photo-Optical Instrumentation Engineers (SPIE) Conference Series, Vol. 12184, Ground-based and Airborne Instrumentation for Astronomy IX, ed. C. J
2022
-
[10]
Evans, J. J. Bryant, & K. Motohara, 121841U, doi: 10.1117/12.2628953
- [11]
-
[12]
M., Hinz, P
Bowens-Rubin, R., Akana Murphy, J. M., Hinz, P. M., et al. 2023, AJ, 166, 260, doi: 10.3847/1538-3881/ad03e5
2023 doi
-
[13]
2021, The Messenger, 182, 22, doi: 10.18727/0722-6691/5218
Brandl, B., Bettonvil, F., van Boekel, R., et al. 2021, The Messenger, 182, 22, doi: 10.18727/0722-6691/5218
2021 doi
-
[14]
R., Bettonvil, F., van Boekel, R., et al
Brandl, B. R., Bettonvil, F., van Boekel, R., et al. 2024, in Ground-based and Airborne Instrumentation for Astronomy X, ed. J. J. Bryant, K. Motohara, & J. R. D
2024
-
[15]
13096, International Society for Optics and Photonics (SPIE), 1309612, doi: 10.1117/12.3018975 22
Vernet, Vol. 13096, International Society for Optics and Photonics (SPIE), 1309612, doi: 10.1117/12.3018975 22
-
[16]
C., Walker, R
Cohen, M., Witteborn, F. C., Walker, R. G., Bregman, J. D., & Wooden, D. H. 1995, AJ, 110, 275, doi: 10.1086/117517
1995 doi
-
[17]
2012, ARA&A, 50, 305, doi: 10.1146/annurev-astro-081811-125447
Davies, R., & Kasper, M. 2012, ARA&A, 50, 305, doi: 10.1146/annurev-astro-081811-125447
2012 doi
-
[18]
Downey, E. C. 2007, INDI: Instrument-Neutral Distributed Interface, https://www.clearskyinstitute.com/INDI/INDI.pdf
2007
- [19]
-
[20]
2018, Annual Review of Astronomy and Astrophysics, 56, 315, doi: 10.1146/annurev-astro-081817-052000
Guyon, O. 2018, Annual Review of Astronomy and Astrophysics, 56, 315, doi: 10.1146/annurev-astro-081817-052000
2018 doi
-
[21]
2012, in Society of Photo-Optical Instrumentation Engineers (SPIE) Conference Series, Vol
Hinz, P., Codona, J., Guyon, O., et al. 2012, in Society of Photo-Optical Instrumentation Engineers (SPIE) Conference Series, Vol. 8446, Ground-based and Airborne Instrumentation for Astronomy IV, ed. I. S. McLean, S. K. Ramsay, & H. Takami, 84461P, doi: 10.1117/12.926751
2012 doi
-
[22]
M., Angel, J
Hinz, P. M., Angel, J. R. P., Woolf, N. J., Hoffmann, W. F., & McCarthy, D. W. 2000, in Society of Photo-Optical Instrumentation Engineers (SPIE) Conference Series, Vol. 4006, Interferometry in Optical Astronomy, ed. P. L´ ena & A. Quirrenbach, 349–353, doi: 10.1117/12.390225
2000 doi
-
[23]
M., Solheid, E., Durney, O., & Hoffmann, W
Hinz, P. M., Solheid, E., Durney, O., & Hoffmann, W. F. 2008, in Optical and Infrared Interferometry, ed. M. Sch¨ oller, W. C. Danchi, & F. Delplancke, Vol. 7013, International Society for Optics and Photonics (SPIE), 701339, doi: 10.1117/12.790242
2008 doi
-
[24]
F., Fazio, G
Hoffmann, W. F., Fazio, G. G., Shivanandan, K., Hora, J. L., & Deutsch, L. K. 1994, Infrared Physics & Technology, 35, 175, doi: https://doi.org/10.1016/1350-4495(94)90079-5
1994 doi
-
[25]
F., Hora, J
Hoffmann, W. F., Hora, J. L., Fazio, G. G., Deutsch, L. K., & Dayal, A. 1998, in Society of Photo-Optical Instrumentation Engineers (SPIE) Conference Series, Vol. 3354, Infrared Astronomical Instrumentation, ed. A. M. Fowler, 647–658, doi: 10.1117/12.317327
1998 doi
-
[26]
2017, A&A, 600, A46, doi: 10.1051/0004-6361/201630232
Huby, E., Bottom, M., Femenia, B., et al. 2017, A&A, 600, A46, doi: 10.1051/0004-6361/201630232
2017 doi
-
[27]
2013, A&A, 560, A91, doi: 10.1051/0004-6361/201322433
Kimeswenger, S. 2013, A&A, 560, A91, doi: 10.1051/0004-6361/201322433
2013 doi
- [28]
-
[29]
M., Skrutskie, M
Leisenring, J. M., Skrutskie, M. F., Hinz, P. M., et al. 2012, in Society of Photo-Optical Instrumentation Engineers (SPIE) Conference Series, Vol. 8446, Ground-based and Airborne Instrumentation for Astronomy IV, ed. I. S
2012
-
[30]
McLean, S. K. Ramsay, & H. Takami, 84464F, doi: 10.1117/12.924814
-
[31]
M., Atkinson, D., Bowens, R., et al
Leisenring, J. M., Atkinson, D., Bowens, R., et al. 2023, Astronomische Nachrichten, 344, e20230103, doi: 10.1002/asna.20230103
2023 doi
-
[32]
Lord, S. D. 1992, A new software tool for computing Earth’s atmospheric transmission of near- and far-infrared radiation, NASA Technical Memorandum 103957
1992
-
[33]
2005, ApJ, 633, 1191, doi: 10.1086/462409 Meier Vald´ es, E
Mawet, D., Riaud, P., Absil, O., & Surdej, J. 2005, ApJ, 633, 1191, doi: 10.1086/462409 Meier Vald´ es, E. A., Morris, B. M., & Demory, B. O. 2021, A&A, 649, A132, doi: 10.1051/0004-6361/202039629
2005 doi
-
[34]
M., Montoya, M., Fellows, C., et al
Morzinski, K. M., Montoya, M., Fellows, C., et al. 2020, in Society of Photo-Optical Instrumentation Engineers (SPIE) Conference Series, Vol. 11448, Adaptive Optics Systems VII, ed. L. Schreiber, D. Schmidt, & E. Vernet, 114481L, doi: 10.1117/12.2563178
2020 doi
-
[35]
M., Montoya, M., Patience, J., et al
Morzinski, K. M., Montoya, M., Patience, J., et al. 2024, in Adaptive Optics Systems IX, ed. K. J. Jackson, D. Schmidt, & E. Vernet, Vol. 13097, International Society for Optics and Photonics (SPIE), 130970D, doi: 10.1117/12.3019524
2024 doi
-
[36]
2012, A&A, 543, A92, doi: 10.1051/0004-6361/201219040
Noll, S., Kausch, W., Barden, M., et al. 2012, A&A, 543, A92, doi: 10.1051/0004-6361/201219040
2012 doi
-
[37]
2012, in Society of Photo-Optical Instrumentation Engineers (SPIE) Conference Series, Vol
Packham, C., Honda, M., Richter, M., et al. 2012, in Society of Photo-Optical Instrumentation Engineers (SPIE) Conference Series, Vol. 8446, Ground-based and Airborne Instrumentation for Astronomy IV, ed. I. S
2012
-
[38]
McLean, S. K. Ramsay, & H. Takami, 84467G, doi: 10.1117/12.924996
-
[39]
Pathak, P., Petit dit de la Roche, D. J. M., Kasper, M., et al. 2021, arXiv e-prints, arXiv:2104.13032. https://arxiv.org/abs/2104.13032
2021 arXiv
-
[40]
R., Brandner, W., Heidt, J., & Cantalloube, F
Sauter, J. R., Brandner, W., Heidt, J., & Cantalloube, F. 2024, PASP, 136, 095001, doi: 10.1088/1538-3873/ad6f45
2024 doi
-
[41]
W., et al
Schlawin, E., Leisenring, J., McElwain, M. W., et al. 2021, AJ, 161, 115, doi: 10.3847/1538-3881/abd8d4
2021 doi
-
[42]
M., Zavodny, M., Rahmer, G., & Bonati, M
Smith, R. M., Zavodny, M., Rahmer, G., & Bonati, M. 2008, in Society of Photo-Optical Instrumentation Engineers (SPIE) Conference Series, Vol. 7021, High
2008
-
[43]
Energy, Optical, and Infrared Detectors for Astronomy III, ed. D. A. Dorn & A. D. Holland, 70210J, doi: 10.1117/12.789372
-
[44]
J., Quanz, S
Stolker, T., Bonse, M. J., Quanz, S. P., et al. 2019, A&A, 621, A59, doi: 10.1051/0004-6361/201834136 23
2019 doi
-
[45]
A., & Oppenheimer, B
Traub, W. A., & Oppenheimer, B. R. 2010, Direct Imaging of Exoplanets, ed. S. Seager, 111–156
2010
-
[46]
2021, Nature Communications, 12, 922, doi: 10.1038/s41467-021-21176-6
Wagner, K., Boehle, A., Pathak, P., et al. 2021, Nature Communications, 12, 922, doi: 10.1038/s41467-021-21176-6
2021 doi
-
[47]
W., Roellig, T
Werner, M. W., Roellig, T. L., Low, F. J., et al. 2004, ApJS, 154, 1, doi: 10.1086/422992
2004 doi
Reviewed August 11, 2026 · model on record in the stance chip above.
Discussion (0). Continue with ORCID to comment.