REVIEW 4 major objections 4 minor 13 references
Comparing unsupervised learning methods for local structural identification in colloidal systems
T0 review · 4 major / 4 minor · reviewed 2026-08-04 · deepseek-v4-flash
Pith's one-line read On bulk crystals and confined colloidal clusters, UMAP separates local structural classes more cleanly than PCA, autoencoders, or q4/q6 order parameters, with or without labels.
desk verdict Useful bulk benchmark, but the supraparticle comparison stacks the deck for UMAP and the 'consistently outperforms' claim outruns the evidence. read the letter →
The pith
A machine-rendered reading of the paper's core claim, the machinery that carries it, and where it could break.
The reading
What carries the argument
The load-bearing mechanism is the unsupervised pipeline: each particle is described by 13 rotation-invariant scalars, twelve averaged bond-orientational order parameters q_l (l=2..12) and a new local centricity measure delta_r, the normalized distance between a particle and the center of mass of its solid-angle nearest neighbors. These descriptors are compressed to two or three dimensions by PCA, an autoencoder, or UMAP, where UMAP models the data as a fuzzy topological graph and minimizes cross-entropy between high- and low-dimensional neighborhoods. The reduced space is then clustered with a Gaussian mixture model, and components are merged using the entropy-based merging scheme, with the
What would settle it
Run the identical pipeline on a simulated mixture with known labels but complex coexisting motifs (for example, a confined supraparticle annotated by a human or by a supervised classifier) while forcing all methods to the same number of clusters, chosen by the same rule; if UMAP's NMI or silhouette no longer exceeds AE and PCA by the reported margins, the claim of consistent superiority fails. A cheaper check: on the supraparticle data, recalculate silhouette scores with cluster counts equalized at 8, 11, and 16 for every method and see whether UMAP still leads.
Extended reading notes
Core claim
The paper's central claim is that UMAP, applied to a 13-dimensional descriptor vector (twelve locally averaged bond-orientational invariants q2..q12 plus a new center-of-mass asymmetry parameter delta_r), yields cleaner unsupervised structural classes than PCA, autoencoders, or q4/q6 alone. The evidence is two-fold: in labeled bulk crystals UMAP achieves an NMI of 0.985 and a silhouette score of 0.766 with essentially perfect confusion matrices, while in unlabeled confined supraparticles it separates surface, first-shell, transition, and core domains across radial and planar cuts, with silhouette 0.391 versus 0.151 (AE), 0.091 (PCA), and -0.068 (q4/q6). The experimental STED supraparticle co
Load-bearing premise
The ranking assumes that picking final cluster counts by eye from entropy-curve elbows, at unequal counts across methods (8, 11, and 16), is a fair basis for comparison, and in the unlabeled supraparticle case it assumes the visually identified surface/core features are the true structures.
Editorial extensions
If this is right
- For bulk crystalline classification, UMAP separates FCC, HCP, BCC, and fluid into pure clusters, so the pipeline can replace hand-tuned order parameters for distinguishing known polymorphs.
- On spherically confined hard spheres, UMAP autonomously resolves surface fivefold regions, a transition layer, tetrahedral cores, and interfacial tubes, making those structures discoverable without labels.
- The same UMAP pipeline transfers to experimental 3D STED images, meaning structural motifs can be identified directly from confocal data without simulation labels.
- Because UMAP has effectively one tunable hyperparameter, the method is deployable where autoencoder hyperparameter tuning is impractical, especially on large single-particle datasets.
- The new asymmetry descriptor delta_r adds information beyond angular order and can be reused in other descriptor sets.
Reading between the lines
- If UMAP consistently wins on both labeled and unlabeled colloidal datasets, the local structural variation in these dense systems likely lives on a low-dimensional nonlinear manifold, so linear methods such as PCA will lag regardless of descriptor choice.
- The same pipeline could be applied to time-resolved trajectories to identify structural transitions between motifs, since the clustering is frame-agnostic and fast enough for large datasets.
- A testable extension is to replace the visual elbow selection with an automated knee-finder; doing so would remove the main subjective step and could change the relative rankings, possibly shrinking UMAP's margin.
Signed reviews
Editorial analysis
A structured set of objections, weighed in public.
Referee Report
Summary. The paper compares three unsupervised dimensionality-reduction methods (PCA, autoencoder, UMAP) plus a q4/q6 baseline for classifying local particle environments in colloidal systems. Descriptors are averaged bond-orientational order parameters q_l (l=2..12) plus a centrosymmetry measure δr; after embedding, GMM clustering with entropy-based merging assigns structural classes. In a labeled bulk dataset (FCC, HCP, BCC, fluid), UMAP gives the highest NMI and silhouette scores, with autoencoders close behind. In an unlabeled icosahedral supraparticle dataset, UMAP is claimed to give the best separation based on silhouette scores and qualitative radial/planar cuts; a single experimental STED supraparticle is analyzed with UMAP. The paper concludes UMAP consistently outperforms the other methods.
Significance. If the performance claim held, the paper would provide a useful practical recommendation: UMAP + GMM with entropy merging as a default unsupervised structural-discovery pipeline. The bulk benchmark is a genuine strength: it uses a physically meaningful labeled dataset, reports confusion matrices and NMI, and shows nonlinear embeddings outperform q4/q6 and PCA. The main limitation is that the unlabeled supraparticle comparison is not yet a fair test of the central claim, because cluster counts and evaluation metrics are method-dependent. The experimental demonstration is suggestive but not quantitative. With a redesigned comparison, the manuscript would be a solid contribution to the soft-matter ML toolbox.
major comments (4)
- [§III.B, Figs. 10,12,13,15 and Fig. 17] The supraparticle comparison uses different final cluster counts chosen by visual inspection: 8 (q4/q6), 8 (PCA), 11 (AE), 16 (UMAP). Silhouette scores (Eq. 12) are not comparable across these settings: silhouette generally increases with the number of clusters in a given space, and here the distances d(i,j) are computed in different embeddings (original q4/q6 plane, PCA space, AE latent space, UMAP space). UMAP specifically optimizes local neighborhood separation, so a high silhouette in the UMAP space is by construction more likely. To support 'consistently outperforms,' the cluster count must be fixed across methods (or chosen by a single automated criterion), and the comparison should be repeated with a label-free metric less dependent on the embedding's metric or with a held-out physical validation (e.g., ability to predict particle mobility or known shell structure).
- [§III.A, Fig. 8(e)] The bulk benchmark is the most trustworthy part, but the claimed consistency is not strongly supported by the numbers: UMAP NMI is 0.985 versus 0.978 for AE, and the confusion matrices are nearly identical (Fig. 8(c,d)). No uncertainty quantification is provided (e.g., bootstrap over particles/configurations or multiple independent simulation seeds). The silhouette advantage (0.766 vs 0.636) is larger but is again computed in the dimension-reduced space of each method, which favors UMAP's embedding objective. The paper should either add error bars / repeated runs and a test of statistical significance, or temper the 'consistently outperforms' claim to 'performs comparably or slightly better on bulk data.'
- [§III.C, Fig. 20] The experimental section states that UMAP is 'the only one of the three' that accurately captures the structure, but figure 20 shows only UMAP results. To make this claim, the PCA and AE classifications for the same experimental supraparticle must be shown, and the evaluation needs a quantitative criterion (e.g., agreement with simulated radial-shell assignments or with known symmetry landmarks). As written, this part is anecdotal and cannot independently support the central claim.
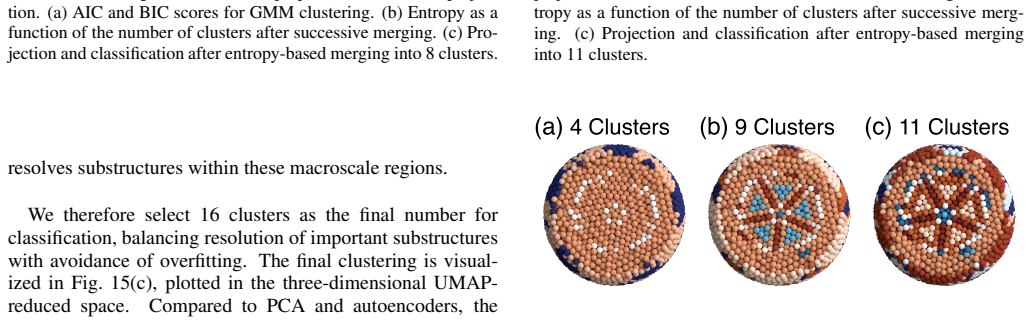
- [§II.C, entropy merging] The entropy-based merging procedure is presented as an objective way to choose cluster number, but the actual choice is made by visual inspection of elbows/transitions (Figs. 10(b), 12(b), 13(b), 15(b)), and the same visual inspection is used to assert that the resulting clusters are meaningful. For the unlabeled supraparticle data this creates a selection loop: cluster counts that produce visually appealing patterns are chosen, then the method is praised for producing those patterns. Please automate the elbow detection (e.g., L-method with a formal breakpoint) or report the sensitivity of all downstream conclusions to the chosen cluster count.
minor comments (4)
- [Abstract, Introduction] The phrase 'noa priori' appears with a missing space in the abstract and in the introduction. This is a typographical issue.
- [§II.B.2] No numerical details are given for the autoencoder training (learning rate, epochs, batch size, regularization, activation functions). For reproducibility, these hyperparameters should be specified in the text or in a supplementary table.
- [§III.B, Figs. 18-19] The cluster color maps are not described in the captions, and it is unclear whether the same colors represent the same cluster classes across different panels and methods. A shared color legend or consistent cluster labels would make the qualitative comparison much easier to evaluate.
- [§III.C] The text first says 'we use the UMAP algorithm to study the structure' and later refers to 'the only one of the three'—please clarify whether PCA and AE were actually run on the experimental data and, if so, why their results are not shown with the same level of detail.
Circularity Check
Supraparticle benchmark has a selection/evaluation loop: UMAP's silhouette advantage partly reduces to its own objective.
-
other
[Section III.B (PCA/AE/UMAP clustering selection) and Section III.B.4, Fig. 17 with Eq. (12)]
"After visual inspection of the clustering, we select 8 as the final number of clusters to capture the major structural diversity present. ... We therefore select 16 clusters as the final number for classification, balancing resolution of important substructures with avoidance of overfitting. ... As shown in Fig. 17, none of the silhouette scores are extremely high. However, UMAP achieves the highest score (0.391), followed by the autoencoder (0.151), and PCA (0.091)."
The final cluster number is chosen per method by visually inspecting the same low-dimensional embedding that is later scored (8, 8, 11, 16 clusters for q4/q6, PCA, AE, UMAP). The silhouette score of Eq. (12) is then computed with distances in that same method-specific reduced space. For UMAP, this is a direct reflection of its training objective: the cross-entropy loss in Eq. (6) explicitly pushes non-neighbor points apart in the low-dimensional embedding, which is exactly the separation that silhouette's b(i)-a(i) rewards. Thus UMAP's higher silhouette score in the unlabeled supraparticle test is substantially forced by the evaluation protocol, not an independent measurement of structure discovery. The qualitative radial cuts are also interpreted after knowing which embedding produced the
full rationale
The bulk crystalline benchmark (Section III.A) is an independent, externally labeled test: confusion matrices, NMI, and silhouette are computed against known FCC/HCP/BCC/fluid labels. That part is self-contained and gives UMAP the highest NMI (0.985 vs 0.978 for AE), though the margin is tiny. No fitted parameter is passed off as a prediction there, and no load-bearing self-citation is used; Ref. 37 is cited only for the AE architecture. The circularity concern is confined to the unlabeled supraparticle comparison (Section III.B). There, the cluster count is selected by visual inspection of the embedding that is later evaluated, and silhouette is computed in each method's own reduced space. Because UMAP's loss function directly optimizes low-dimensional separation, its superior silhouette score is partly a consequence of the method's objective rather than of superior structural discovery. This is a partial selection/evaluation loop, not a full derivation collapse, so the score is 4 rather than 6+.
Assumptions & free parameters
free parameters (5)
- UMAP n_neighbors =
25
- UMAP min_dist =
1e-4
- Final cluster count (supraparticle) =
8 (q4/q6), 8 (PCA), 11 (AE), 16 (UMAP)
- Initial GMM component count =
7-8 (bulk), 15 (PCA), 20 (AE/UMAP)
- AE architecture hyperparameters =
not given (from Ref. 37)
assumptions (5)
- standard math UMAP correctly models the data as lying on a low-dimensional Riemannian manifold
- domain assumption 13-dimensional descriptor vector (q_l for l=2..12 plus delta-r) is sufficient to distinguish the relevant local environments
- domain assumption Entropy-based merging and the L-method identify the physically meaningful number of clusters
- domain assumption Labels for bulk phases (FCC, HCP, BCC, fluid) are correct
- domain assumption GMM components are a valid representation of structural classes in the reduced space
Cite this review
Pith. "Pith review of Comparing unsupervised learning methods for local structural identification in colloidal systems." pith.science (2026). https://pith.science/paper/5OOB524O
@misc{pith2026250907186,
  author       = {Pith},
  title        = {Pith review of: Comparing unsupervised learning methods for local structural identification in colloidal systems},
  year         = {2026},
  howpublished = {\url{https://pith.science/paper/5OOB524O}},
  note         = {Machine review of arXiv:2509.07186}
}
read the original abstract
Quantifying local structures in self-assembled systems is a central challenge in soft matter and materials science. When no a priori knowledge of the relevant structures is available, traditional order parameters often fall short. Unsupervised machine learning provides a convenient route to autonomously uncover structural motifs directly from particle configurations. In this work, we systematically compare three popular dimensionality reduction techniques; Principal Component Analysis (PCA), Autoencoders (AE), and Uniform Manifold Approximation and Projection (UMAP), for classifying local environments in self-assembled systems. We first apply these methods to fluid and crystal configurations of hard and charged spheres. Thereafter, we apply it to an icosahedral arrangement of spheres that self-assembled in spherical confinement, both from simulations as well as from experiments. We demonstrate that UMAP consistently outperforms the other methods in capturing complex structural features, offering a robust tool for structural classification without supervision.
Figures


Figures from the paper (16 more)




Reference graph
Works this paper leans on
-
[1]
Principal component analysis (PCA) PCA is a linear dimensionality reduction technique that identifies directions in feature space along which the variance of the data is maximized34. It achieves this by computing the eigenvectors of the covariance matrix of the input data and projecting each data point onto the leading eigenvectors (prin- cipal components...
-
[2]
Autoencoder (AE) Autoencoders are a class of artificial neural networks de- signed to learn efficient representations of input data41,42. An autoencoder consists of two parts: an encoder that maps high- dimensional inputs to a low-dimensional latent space (the bot- tleneck), and a decoder that attempts to reconstruct the orig- inal inputs from this latent...
-
[3]
Uniform manifold approximation and projection (UMAP) UMAP is a nonlinear dimensionality reduction algorithm introduced in 2018 36 that constructs a low-dimensional rep- resentation of high-dimensional data by modeling its intrinsic geometry. At its core, UMAP assumes that the data lies on a low- dimensional Riemannian manifold embedded in a higher- dimens...
work page 2018
-
[4]
Supraparticle formation The particles were made in three steps, where small sil- ica seeds are created in the first step, to provide a reason- ably monodisperse starting point. In the second step, a fluorescent shell was grown around the particles, through which the particles could be detected with confocal/STED microscopy. Finally, a larger non-fluoresce...
-
[5]
The supra- particles were index-matched within 0.002 using a mixture of 82.5 wt% glycerol/water
Supraparticle Analysis After several washing steps to remove surfactants, all supra- particles were dried on a #1.5H high precision cover slip (Menzel Gläser), glued to a standard microscopy slide (Men- zel Gläser) in which a 8 mm hole was drilled. The supra- particles were index-matched within 0.002 using a mixture of 82.5 wt% glycerol/water. All confoca...
-
[6]
We first analyze the variance explained by each principal component
Principal component analysis Next, we assess the performance of PCA as a dimension- ality reduction technique for the classification of bulk crys- talline structures. We first analyze the variance explained by each principal component. As shown in Fig.4(a), the first two principal com- ponents account for a substantial fraction of the total variance. The ...
-
[7]
Autoencoders We now turn to autoencoders (AE) as a nonlinear dimen- sionality reduction technique for structural classification. Mo- tivated by the results of the PCA analysis, we design the autoencoder to project the structural descriptors into a two- dimensional latent space. After training the network to min- imize reconstruction loss, we project the d...
-
[8]
Based on the PCA analysis, we project the data onto a two-dimensional space
Uniform Manifold Approximation and Projection Finally, we evaluate the performance of UMAP as a non- linear dimensionality reduction method for the bulk structural classification. Based on the PCA analysis, we project the data onto a two-dimensional space. After training UMAP using 25 nearest-neighbors and expected minimum distance 10 −4 as hyperparameter...
Show all 13 references
-
[9]
Summary of Bulk Structure Classification Since we tested each method on labeled data here (data aris- ing from simulations of the individual phases), we have access to model accuracies. As a first way to estimate the accuracy, we calculate the confusion matrices, which list fo...
-
[10]
The variance explained by each principal component, shown in Fig.11(a), indicates that the first three principal components capture a substantial fraction of the total variance
Principal component analysis We next apply PCA to the supraparticle dataset. The variance explained by each principal component, shown in Fig.11(a), indicates that the first three principal components capture a substantial fraction of the total variance. The cumu- lative expla...
-
[11]
Autoencoders We next apply a neural network-based autoencoder to per- form nonlinear dimensionality reduction on the supraparti- 10 FIG. 10. Clustering of icosahedral supraparticles in the q4 vs. q6 plane. (a) AIC and BIC scores for GMM clustering. (b) Entropy as a function of...
-
[12]
The GMM clustering procedure is shown in Fig
Uniform Manifold Approximation and Projection We now apply UMAP to the supraparticle dataset using the same hyperparameters that we use for the bulk structures, and again project onto three dimensions. The GMM clustering procedure is shown in Fig. 15(a), where both the AIC and...
-
[13]
soft-matter/trackpy: v0.6.4,
Summary of Supraparticle Structure Classification To quantitatively evaluate the performance of the differ- ent dimensionality reduction methods on the supraparticle dataset, we compute the silhouette score for each method. Re- call that the silhouette score quantifies the deg...
2019 arXiv
Reviewed August 4, 2026 · model on record in the stance chip above.
Discussion (0). Continue with ORCID to comment.