REVIEW 2 major objections 5 minor 42 references
4TaStiC: Time and trend traveling time series clustering for classifying long-term type 2 diabetes patients
T0 review · 2 major / 5 minor · reviewed 2026-08-15 · deepseek-v4-flash
Pith's one-line read 4TaStiC defines a dissimilarity that shifts and tilts time series, and the paper reports that it outperforms seven existing methods on the hardest synthetic medical-like datasets and splits 1,989 diabetes patients into seven clinically…
desk verdict Novel trend-traveling dissimilarity with a clean real-data application, but the headline numbers are inflated by tuning on the test set and the unpenalized tilt can merge clinically distinct trajectories. read the letter →
The pith
A machine-rendered reading of the paper's core claim, the machinery that carries it, and where it could break.
The reading
What carries the argument
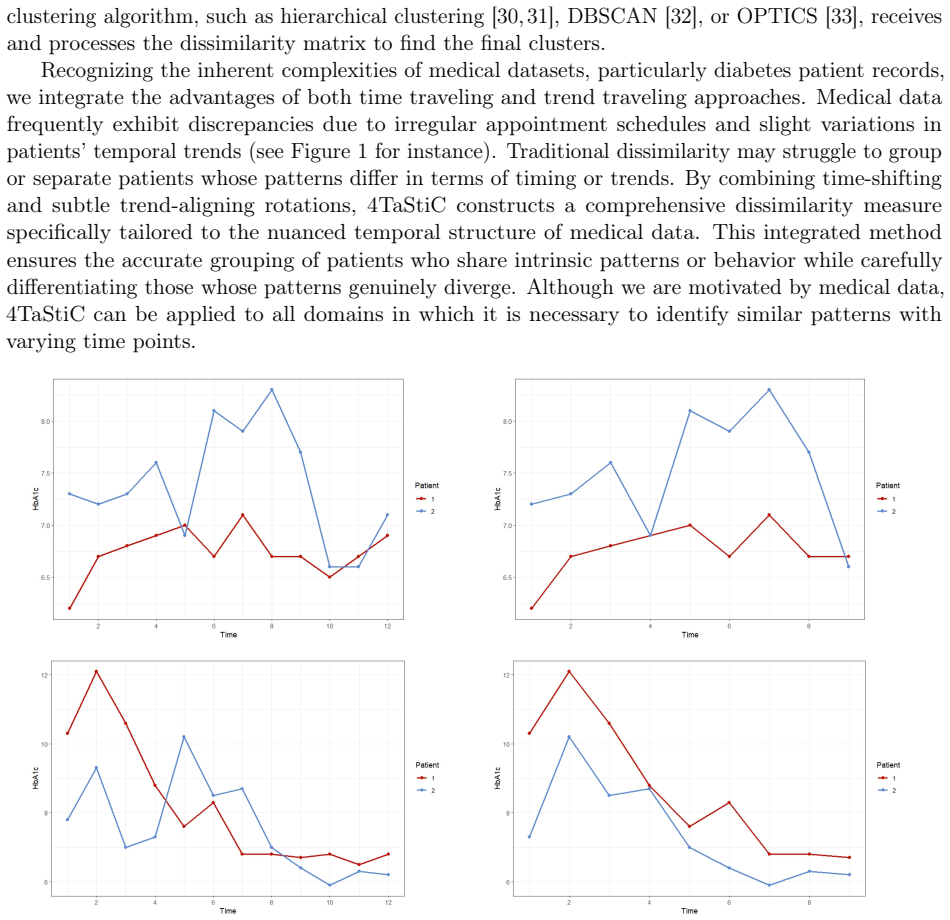
The central object is the 4TaStiC dissimilarity $d_{L,E}(X,Y)=\min_{l\in\{0,\ldots,L\},\,\epsilon\in E}\;\{d(X^{(l-,0)},Y^{(l+,\epsilon)}),d(X^{(l+,0)},Y^{(l-,\epsilon)})\}$, where $d$ blends the weighted Euclidean distance with the Pearson-correlation dissimilarity, the latter penalized by $e^{-C|\epsilon|}$ for large tilts. The time shift $l$ realigns visits that fall on different calendars; the tilt $\epsilon$ rotates one series so that nearly parallel trends can be recognized as the same pattern. Taking the best match over all allowed shifts and tilts is the mechanism that lets level and trajectory be considered in one number, and it is what changes the dendrogram in the paper's illustrative example.
What would settle it
A decisive check is to rerun 4TaStiC with the trend-traveling tilt disabled ($E=\{0\}$) on the Class 3 datasets and on the real cohort; if the accuracy and ARI gains, or the seven-group structure, largely remain, then trend traveling is not the source of the claim, and if they vanish, the reported clusters rest on the unpenalized rotation.
Extended reading notes
Core claim
The paper's central claim is that replacing ordinary pairwise distances with the time-and-trend-traveling dissimilarity is enough to cluster long, irregularly sampled laboratory time series into interpretable groups. On three synthetic datasets designed to imitate the hardest features of patient records, 4TaStiC with both time and trend traveling reaches accuracies of 0.97, 0.90 and 0.98 and adjusted Rand indices of 0.93, 0.84 and 0.93, which are the best among the eight methods compared. Applied to 1,989 type 2 diabetes patients, it separates seven groups whose HbA1c levels, recent trends, and diabetic-retinopathy rates are coherent, such as a stable group, a recovering group, and an extremely high increasing group. The intended upshot is that a doctor could be shown each patient's group label and trajectory summary instead of being asked to review the full sequence of records.
Load-bearing premise
The method assumes that letting one patient's HbA1c curve be tilted up or down by up to 0.825 percentage points, with no penalty, to force a better correlation only creates matches that are clinically meaningful, not spurious.
Editorial extensions
If this is right
- If the synthetic results carry over, 4TaStiC becomes a candidate default for clustering irregularly sampled medical time series, because it handles level and trajectory in one dissimilarity rather than in two separate steps.
- The seven-group partition would let clinicians act on trajectory information: patients in increasing-trend groups can be flagged for closer monitoring, while stable and recovering groups can be given maintenance advice.
- Because the method only produces a dissimilarity matrix, the same measure can be inserted into any distance-based clustering algorithm, so its usefulness is not tied to the particular hierarchical clustering used in the paper.
- The paper's own sensitivity table shows the method is stable only for a limited range of the tilt parameter, so users of unpenalized trend traveling need to check that the chosen epsilon matches their clinical tolerance for what counts as the same trajectory.
Reading between the lines
- Editorial inference: with C=0, trend traveling is equivalent to correlating after an unpenalized linear detrending of one series; an ablation that clusters the detrended series under the same time shifting would reveal whether the tilt parameter adds anything beyond that.
- Editorial inference: the retinopathy rates in the paper imply a prospective test: if trajectory groups are medically meaningful, the increasing-trend groups should show higher new complication rates in later follow-up data, which the paper does not provide.
- Editorial inference: the method should transfer to other intermittently measured biomarkers such as blood pressure or kidney function whenever both level and trajectory matter; the paper asserts this applicability but does not demonstrate it outside HbA1c.
Signed reviews
Editorial analysis
A structured set of objections, weighed in public.
Referee Report
Summary. The paper proposes 4TaStiC, a dissimilarity measure for time series clustering that aligns series by allowing small time shifts (time traveling) and small rotations of the trend (trend traveling), then combines a weighted Euclidean distance with a Pearson-correlation dissimilarity (Eqs. (1)-(8)). The authors prove three basic properties, evaluate the method on nine synthetic datasets against seven existing methods, and apply it to cluster 1,989 type 2 diabetes patients from Siriraj Hospital into seven groups summarized in Table 7 and Figure 6. An R package is provided on GitHub.
Significance. If the claims are validated, 4TaStiC is a useful and interpretable dissimilarity for longitudinal laboratory data with irregular visit timing, and the paper contributes small proofs, open-source code, and a real clinical case study. The central idea of combining time shifts with a controlled trend tilt is clearly presented and can be plugged into any distance-based clustering algorithm. However, the current evaluation does not yet establish the headline performance or the clinical validity of the seven groups, because of the in-sample parameter selection and the unpenalized trend traveling discussed below.
major comments (2)
- [4.1-4.2] The hyperparameters p=0.09, epsilon=0.075, and C=0 are selected in Section 4.1 by maximizing or balancing accuracy and ARI on the three G3 datasets, and the same datasets are then used in Table 5 to report the Class 3 performance of 4TaStiC. This makes the headline claim of superior performance on Class 3 an in-sample result, not evidence of generalization. Moreover, the synthetic Class 3 datasets are constructed to contain the time-shift and trend-tilt structures that 4TaStiC is designed to exploit, so a comparison against methods not designed for those structures is inherently optimistic. Please provide a nested or held-out evaluation, for example tuning on one synthetic class and reporting Table 5 on the remaining datasets, or reporting results for all 45 parameter combinations across all nine datasets; without this, the numbers in Table 5 do not support the stated conclusion that 4TaStiC outperforms the compared methods.
- [3.3, 4.1, 5.2] With C=0 in Eq. (7), the penalty term e^{-C|epsilon|} equals 1, so the correlation term after tilting is unpenalized. Because Eq. (8) with p=0.09 can make alpha close to 1, the Euclidean term is downweighted by the factor (1-alpha), and the dissimilarity is then dominated by 1-Corr after tilting. A stable series at 7.0 and a linearly increasing series from 7.0 to 7.8 become nearly perfectly correlated after tilting the stable series by 0.075 per step (a cumulative tilt of 0.825 over 11 steps, within the 1.5 range stated in Section 4.1), so the two can be merged even though their trajectories are clinically distinct. This directly threatens the interpretation in Section 5.2 that the seven groups reflect meaningful HbA1c trajectories. Section 6.1 itself warns that trend traveling is 'sensitive to small changes' and must be clinically meaningful. Please report the actual alpha values for the synthetic and real datasets, the proportion of pairs for which the optimal epsilon is nonzero, and a comparison of the real-data clustering with E={0} or with C>0, including the ARI between the resulting partitions, to show that the seven groups are not created by the unpenalized tilt.
minor comments (5)
- [3.5, proof of Proposition 3.2] The proof states that dCorr((a,0,0),(b,0,0))=0 for any nonzero a≠b; this is only true when a and b have the same sign, so the statement or the example should be corrected.
- [2.1] The list of predetermined parameters (alpha, L, E, C) omits p from Eq. (8) and the number of clusters K, both of which are user-chosen in the experiments; please make the parameter list complete.
- [2.4] The body refers to the weighted Euclidean distance 'defined in Table 2', but the formula is not reproduced in the text I reviewed; please include it explicitly so that Eq. (7) is self-contained.
- [4.1] The sentence 'With 12 time steps and as in (4), this rotates the last time point by 11×epsilon' is imprecise: Eq. (4) is the trend-traveling minimization, while the rotation is actually given by Eqs. (1)-(2) with l=0; please clarify.
- [6.1] The warning that trend traveling is 'sensitive to small changes' appears only in the conclusion; it should be moved to the sensitivity analysis and explicitly connected to the choice C=0.
Circularity Check
Class 3 performance is in-sample: p=0.09, E={-0.075,0,0.075}, C=0 were selected on G3_1-G3_3 and then reported as superior on the same datasets.
-
fitted input called prediction
[Section 4.1 (sensitivity analysis on G3 datasets) to Section 4.2 (Table 5, Class 3 performance)]
"The combination of parameters p = 0.09, epsilon = 0.075, and C = 0 yields one of the most balanced performances overall across the three datasets. ... This explains why we used this combination of parameters for the diabetes patients' data. ... we test 4TaStiC's performance with the parameters p = 0.09 and E = {-0.075, 0, 0.075} on nine artificial datasets ... 4TaStiC with both time and trend traveling achieves a superior performance on the datasets in Class 3, with accuracies of 0.97, 0.9, and 0.98"
The sensitivity analysis in Section 4.1 evaluates accuracy and ARI for 45 parameter combinations on the three Class 3 datasets and selects p=0.09, epsilon=0.075, C=0 as a balanced performer on those very datasets. Section 4.2 then reports 'superior performance' on 'the datasets in Class 3' using exactly the selected parameters. The reported accuracies and ARIs are therefore in-sample evaluations of a configuration chosen by maximizing performance on the same data, not out-of-sample predictions. The central claim that 4TaStiC outperforms seven methods on Class 3 is statistically forced by the selection procedure and provides no independent validation for the method.
full rationale
The dissimilarity definition in Eqs. (1)-(8) is self-contained and does not use cluster labels; the mathematical propositions in Section 3.5 are internal consistency results rather than disguised inputs. The self-citations to [34], [38], and [39] are contextual (prior work on combining metrics and on cluster validity indices) and are not load-bearing for the proposed measure. The main circularity is confined to the evaluation protocol: the hyperparameters of 4TaStiC were tuned on the same Class 3 datasets that are later presented as evidence of superiority, so the headline performance claim is an in-sample fit rather than a prediction. The Siriraj application is unsupervised, and the seven-group interpretation is post hoc; Section 6.1's own warning that trend traveling is 'sensitive to small changes' raises a validity concern about tilt artifacts but is not itself circularity. Because the paper's central comparative claim reduces to a selected configuration evaluated on the selection set, the analysis is partially circular, with score 6.
Assumptions & free parameters
free parameters (5)
- L (maximum time shift) =
3
- E (tilt angle set) =
{-0.075, 0, 0.075}
- C (penalty coefficient) =
0
- p (percentile in alpha formula) =
0.09
- K (number of clusters) =
7
assumptions (3)
- ad hoc to paper Trend traveling (rotating one series by a small angle) while leaving the other fixed preserves the clinical meaning of HbA1c patterns; i.e., series with similar shape but slightly different slopes are legitimately similar.
- domain assumption The synthetic datasets in Class 3 are a valid proxy for the real Siriraj HbA1c time series, so hyperparameters tuned on them transfer to real patients.
- domain assumption The elbow method identifies the true number of clusters K=7 for the real data.
Cite this review
Pith. "Pith review of 4TaStiC: Time and trend traveling time series clustering for classifying long-term type 2 diabetes patients." pith.science (2026). https://pith.science/paper/5PKJ6GIT
@misc{pith2026250507702,
  author       = {Pith},
  title        = {Pith review of: 4TaStiC: Time and trend traveling time series clustering for classifying long-term type 2 diabetes patients},
  year         = {2026},
  howpublished = {\url{https://pith.science/paper/5PKJ6GIT}},
  note         = {Machine review of arXiv:2505.07702}
}
read the original abstract
Diabetes is one of the most prevalent diseases worldwide, characterized by persistently high blood sugar levels, capable of damaging various internal organs and systems. Diabetes patients require routine check-ups, resulting in a time series of laboratory records, such as hemoglobin A1c, which reflects each patient's health behavior over time and informs their doctor's recommendations. Clustering patients into groups based on their entire time series data assists doctors in making recommendations and choosing treatments without the need to review all records. However, time series clustering of this type of dataset introduces some challenges; patients visit their doctors at different time points, making it difficult to capture and match trends, peaks, and patterns. Additionally, two aspects must be considered: differences in the levels of laboratory results and differences in trends and patterns. To address these challenges, we introduce a new clustering algorithm called Time and Trend Traveling Time Series Clustering (4TaStiC), using a base dissimilarity measure combined with Euclidean and Pearson correlation metrics. We evaluated this algorithm on artificial datasets, comparing its performance with that of seven existing methods. The results show that 4TaStiC outperformed the other methods on the targeted datasets. Finally, we applied 4TaStiC to cluster a cohort of 1,989 type 2 diabetes patients at Siriraj Hospital. Each group of patients exhibits clear characteristics that will benefit doctors in making efficient clinical decisions. Furthermore, the proposed algorithm can be applied to contexts outside the medical field.
Figures


Figures from the paper (5 more)


Reference graph
Works this paper leans on
-
[1]
M.A.B. Khan, M.J. Hashim, J.K. King, R.D. Govender, H. Mustafa, J. Al Kaabi, Epidemiology of type 2 diabetes - global burden of disease and forecasted trends. Journal of Epidemiology and Global Health10(1), 107–111 (2020). https://doi.org/10.2991/jegh.k.191028.001
-
[2]
Urgent action needed as global diabetes cases increase four-fold over past decades (2024)
World Health Organization. Urgent action needed as global diabetes cases increase four-fold over past decades (2024). URL https://www.who.int/news/item/ 13-11-2024-urgent-action-needed-as-global-diabetes-cases-increase-four-fold-over-past-decades
work page 2024
-
[3]
Puangmee, Nursing of diabetic retinopathy in type 2 diabetes patients
N. Puangmee, Nursing of diabetic retinopathy in type 2 diabetes patients. Kuakarun Journal of Nursing 25(1), 217–227 (2018). URL https://he01.tci-thaijo.org/index.php/kcn/ article/view/131951
work page 2018
-
[4]
S.G. Schorr, H.P. Hammes, U.A. M¨ uller, H.H. Abholz, R. Landgraf, B. Bertram, The prevention and treatment of retinal complications in diabetes. Dtsch. Arztebl. Int.113(48), 816–823 (2016)
work page 2016
-
[5]
R.D. Leslie, R.C.W. Ma, P.W. Franks, K.J. Nadeau, E.R. Pearson, M.J. Redondo, Understanding diabetes heterogeneity: key steps towards precision medicine in diabetes. The Lancet Diabetes & Endocrinology 11(11), 848–860 (2023).https://doi.org/10.1016/S2213-8587(23)00159-6
-
[6]
R.B. Prasad, L. Groop, Precision medicine in type 2 diabetes. J. Intern. Med.285(1), 40–48 (2019). https://doi.org/10.1111/joim.12859 22
-
[7]
World Health Organization. Regional Office for the Western Pacific, Asia Pacific Observatory on Health Systems and Policies,Thailand health system review, vol. 13 (WHO Regional Office for the Western Pacific, Manila, Philippines, 2024)
work page 2024
-
[8]
N. Kakandee, A. Cheevakasemsook, D. Triwichitkhun, Job burnout of generation y professional nurses at a government hospital. Journal of The Royal Thai Army Nurses21(1), 293–301 (2020). URL https://he01.tci-thaijo.org/index.php/JRTAN/article/view/241573
work page 2020
Show all 42 references
-
[9]
th/en/news-events/siriraj-hospital-thailands-excellent-medical-hub/ (2022)
Siriraj hospital – thailand’s excellent medical hub - SIRIRAJ.https://www2.si.mahidol.ac. th/en/news-events/siriraj-hospital-thailands-excellent-medical-hub/ (2022)
2022
-
[10]
Sammut, G.I
C. Sammut, G.I. Webb (eds.),Clustering (Springer US, Boston, MA, 2010), pp. 180–180. https://doi.org/10.1007/978-0-387-30164-8_124
2010 doi
-
[11]
J. Li, S. Chen, X. Pan, Y. Yuan, H.B. Shen, Cell clustering for spatial transcriptomics data with graph neural networks. Nature Computational Science2(6), 399–408 (2022)
2022
-
[12]
Dominguez Mantes, D
A. Dominguez Mantes, D. Mas Montserrat, C.D. Bustamante, X. Gir´ o-i Nieto, A.G. Ioannidis, Neural admixture for rapid genomic clustering. Nature computational science3(7), 621–629 (2023)
2023
-
[13]
L. Xue, Y. Liu, Z.Q. Gu, Z.H. Li, X.P. Guan, Joint design of clustering and in-cluster data route for heterogeneous wireless sensor networks. International Journal of Automation and Computing 14(6), 637–649 (2017)
2017
-
[14]
D.G. Xu, P.L. Zhao, C.H. Yang, W.H. Gui, J.J. He, A novel minkowski-distance-based consensus clustering algorithm. International Journal of Automation and Computing14(1), 33–44 (2017)
2017
-
[15]
Warren Liao, Clustering of time series data—a survey
T. Warren Liao, Clustering of time series data—a survey. Pattern Recognition38(11), 1857–1874 (2005). https://doi.org/https://doi.org/10.1016/j.patcog.2005.01.025
2005 doi
-
[16]
X. Yu, L. Lu, J. Qi, Y. Qian, L. Zhao, C. Tan, Y. Chen, Z. Han, A clustering fractional-order grey model in short-term electrical load forecasting. Scientific Reports15(1), 6207 (2025)
2025
-
[17]
Alsalem, A hybrid time series forecasting approach integrating fuzzy clustering and machine learning for enhanced power consumption prediction
K. Alsalem, A hybrid time series forecasting approach integrating fuzzy clustering and machine learning for enhanced power consumption prediction. Scientific Reports15(1), 6447 (2025)
2025
-
[18]
Pattarin, S
F. Pattarin, S. Paterlini, T. Minerva, Clustering financial time series: an application to mutual funds style analysis. Computational Statistics & Data Analysis47(2), 353–372 (2004)
2004
-
[19]
J. Lin, E. Keogh, L. Wei, S. Lonardi, Experiencing SAX: a novel symbolic representation of time series. Data Min. Knowl. Discov.15(2), 107–144 (2007)
2007
-
[20]
J. Qiu, Y. Hu, L. Li, A.M. Erzurumluoglu, I. Braenne, C. Whitehurst, J. Schmitz, J. Arora, B.A. Bartholdy, S. Gandhi, P. Khoueiry, S. Mueller, B. Noyvert, Z. Ding, J.N. Jensen, J. de Jong, Deep representation learning for clustering longitudinal survival data from electronic h...
2025 doi
-
[21]
Saito, H
H. Saito, H. Yoshimura, K. Tanaka, H. Kimura, K. Watanabe, M. Tsubokura, H. Ejiri, T. Zhao, A. Ozaki, S. Kazama, M. Shimabukuro, K. Asahi, T. Watanabe, J.J. Kazama, Predicting CKD progression using time-series clustering and light gradient boosting machines. Sci. Rep.14(1), 17...
2024 doi
-
[22]
Bahadori, Z.C
M.T. Bahadori, Z.C. Lipton, Temporal-clustering invariance in irregular healthcare time series. arXiv preprint arXiv:1904.12206 (2019) 23
2019 arXiv
-
[23]
Bhavani, L
S.V. Bhavani, L. Xiong, A. Pius, M. Semler, E.T. Qian, P.A. Verhoef, C. Robichaux, C.M. Coopersmith, M.M. Churpek, Comparison of time series clustering methods for identifying novel subphenotypes of patients with infection. Journal of the American Medical Informatics Associati...
2023 doi
-
[24]
Borges, M.P
V. Borges, M.P. Duque, J.V. Martins, P. Vasconcelos, R. Ferreira, D. Sobral, A. Pelerito, I.L. de Carvalho, M.S. N´ uncio, M.J. Borrego, et al., Viral genetic clustering and transmission dynamics of the 2022 mpox outbreak in portugal. Nature Medicine29(10), 2509–2517 (2023)
2023
-
[25]
Velichko, N
V. Velichko, N. Zagoruyko, Automatic recognition of 200 words. International Journal of Man-Machine Studies2(3), 223–234 (1970). https://doi.org/https://doi.org/10.1016/ S0020-7373(70)80008-6
1970
-
[26]
Sakoe, S
H. Sakoe, S. Chiba, Dynamic programming algorithm optimization for spoken word recognition. IEEE Transactions on Acoustics, Speech, and Signal Processing26(1), 43–49 (1978).https: //doi.org/10.1109/TASSP.1978.1163055
1978
-
[27]
Cuturi,Fast global alignment kernels(Omnipress, Madison, WI, USA, 2011), ICML’11, p
M. Cuturi,Fast global alignment kernels(Omnipress, Madison, WI, USA, 2011), ICML’11, p. 929–936
2011
-
[28]
A. Egri, I. Horv´ ath, F. Kov´ acs, R. Molontay, K. Varga,Cross-correlation based clustering and dimension reduction of multivariate time series, in2017 IEEE 21st International Conference on Intelligent Engineering Systems (INES)(2017), pp. 000241–000246. https://doi.org/10. 1...
2017
-
[29]
Chandereng, A
T. Chandereng, A. Gitter, Lag penalized weighted correlation for time series clustering. BMC Bioinformatics 21(1), 21 (2020). https://doi.org/https://doi.org/10.1186/ s12859-019-3324-1
2020
-
[30]
Sibson, Slink: An optimally efficient algorithm for the single-link cluster method
R. Sibson, Slink: An optimally efficient algorithm for the single-link cluster method. The Computer Journal16(1), 30–34 (1973). https://doi.org/10.1093/comjnl/16.1.30
1973 doi
-
[31]
Defays, An efficient algorithm for a complete link method
D. Defays, An efficient algorithm for a complete link method. The Computer Journal20(4), 364–366 (1977). https://doi.org/10.1093/comjnl/20.4.364
1977 doi
-
[32]
Ester, H.P
M. Ester, H.P. Kriegel, J. Sander, X. Xu, et al.,A density-based algorithm for discovering clusters in large spatial databases with noise, inkdd, vol. 96 (1996), pp. 226–231
1996
-
[33]
Ankerst, M.M
M. Ankerst, M.M. Breunig, H.P. Kriegel, J. Sander, Optics: Ordering points to identify the clustering structure. ACM Sigmod record28(2), 49–60 (1999)
1999
-
[34]
Charoensuk, N
C. Charoensuk, N. Wiroonsri. Ranked differences pearson correlation dissimilarity with an application to electricity users time series clustering (2025). URLhttps://arxiv.org/abs/ 2505.02173
2025 arXiv
-
[35]
RStudio, PBC., Boston, MA (2020)
RStudio Team,RStudio: Integrated Development Environment for R. RStudio, PBC., Boston, MA (2020)
2020
-
[36]
Sard´ a-Espinosa, Time-series clustering in r using the dtwclust package
A. Sard´ a-Espinosa, Time-series clustering in r using the dtwclust package. The R Journal (2019). https://doi.org/10.32614/RJ-2019-023
2019 doi
-
[37]
R package version 1.0.0 24
T.Chandereng, A.Gitter, LPWC: Lag Penalized Weighted Correlation for Time Series Clustering (2020). R package version 1.0.0 24
2020
-
[38]
Wiroonsri, Clustering performance analysis using a new correlation-based cluster validity index
N. Wiroonsri, Clustering performance analysis using a new correlation-based cluster validity index. Pattern Recognition145, 109910 (2024).https://doi.org/https://doi.org/10.1016/ j.patcog.2023.109910
2024
-
[39]
Preedasawakul, N
O. Preedasawakul, N. Wiroonsri, A bayesian cluster validity index. Computational Statistics & Data Analysis202, 108053 (2025).https://doi.org/https://doi.org/10.1016/j.csda. 2024.108053
2025
-
[40]
Lloyd, Least squares quantization in pcm
S.P. Lloyd, Least squares quantization in pcm. IEEE Trans. Inf. Theory28, 129–136 (1982). URL https://api.semanticscholar.org/CorpusID:10833328
1982
-
[41]
MacQueen,Some methods for classification and analysis of multivariate observations(1967)
J. MacQueen,Some methods for classification and analysis of multivariate observations(1967). URL https://api.semanticscholar.org/CorpusID:6278891
1967
-
[42]
Rand, Objective criteria for the evaluation of clustering methods
W.M. Rand, Objective criteria for the evaluation of clustering methods. Journal of the American Statistical Association66(336), 846–850 (1971). https://doi.org/10.1080/01621459.1971. 10482356. 25
1971
Reviewed August 15, 2026 · model on record in the stance chip above.
Discussion (0). Continue with ORCID to comment.