REVIEW 3 major objections 4 minor 26 references
Step-like spectral distribution of photoelectrons at the percolation threshold in heavily $p$-doped GaAs
T0 review · 3 major / 4 minor · reviewed 2026-08-14 · deepseek-v4-flash
Pith's one-line read The sharp high-energy edge in the photoluminescence of heavily p-doped GaAs is set by a step-like occupation of conduction-band electrons at the percolation threshold, not by the hole Fermi distribution alone.
desk verdict A well-executed experiment pointing to a new electron-distribution mechanism at the high-energy PL edge, but the percolation interpretation rests on an inferred two-population decomposition that needs stiffer evidence. read the letter →
The pith
A machine-rendered reading of the paper's core claim, the machinery that carries it, and where it could break.
The reading
What carries the argument
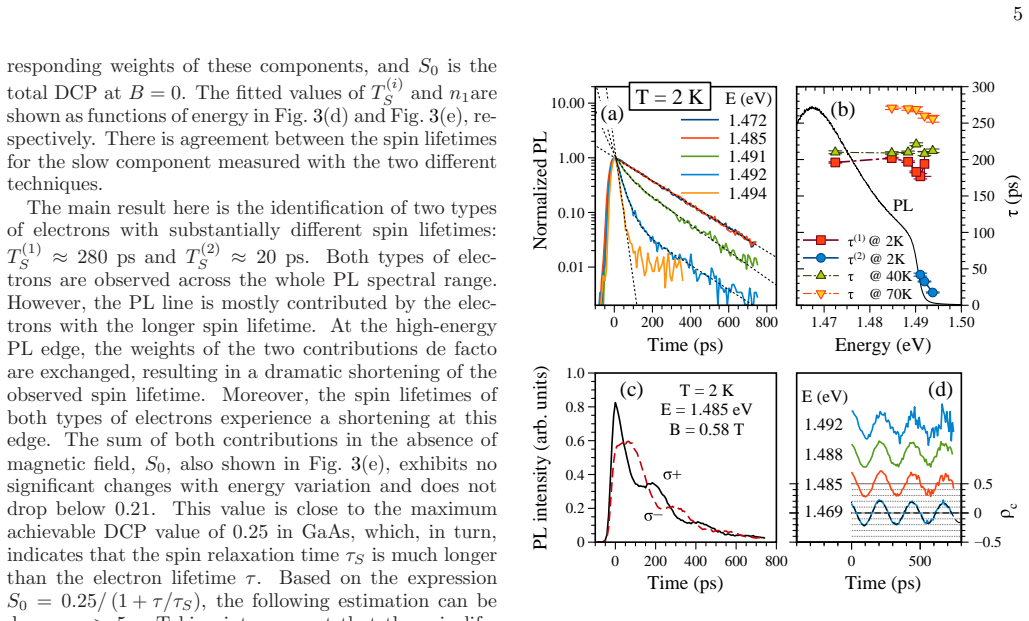
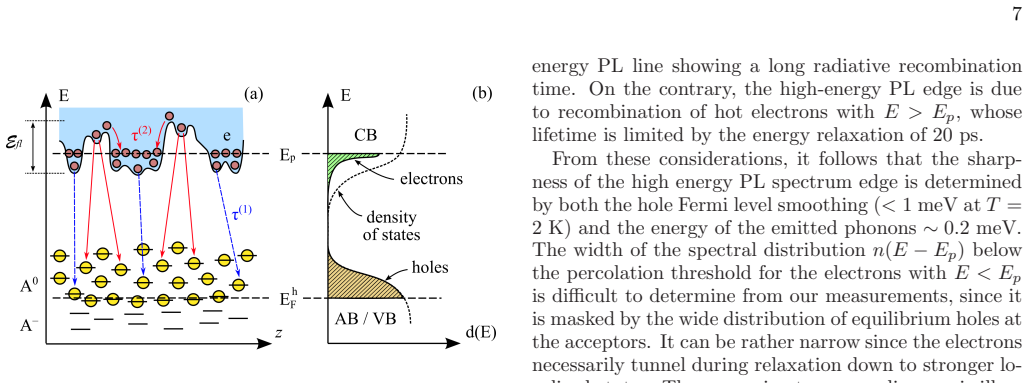
The load-bearing object is the percolation threshold $E_p$ in the conduction band, the energy that separates spatially localized electron states (below $E_p$) from delocalized states (above $E_p$) in the random potential created by ionized impurities. The mechanism the authors use is a two-population decomposition: delocalized electrons above $E_p$ relax by phonon emission in small steps ($\hbar\omega_q \approx k_BT \approx 0.2$ meV) and are trapped at $E_p$ within about 20 ps, while localized electrons below $E_p$ have suppressed relaxation and recombine radiatively in about 280 ps. The experimental machinery is a set of spin-sensitive optical techniques—Hanle depolarization in transverse magnetic fields, time-resolved photoluminescence, and pump-probe Faraday rotation—that let the authors measure spin lifetimes through the resonance broadening and spin precession, and thereby separate the two populations spectrally.
What would settle it
Measure the PL step energy and the two spin lifetimes in samples with the same acceptor density but different compensation (concentration of ionized impurities) and with passivated surfaces. If the step is the percolation threshold, its position and the 20 ps/280 ps lifetimes should follow the estimated potential-fluctuation scale; if they instead track surface quality or acceptor species, the percolation assignment fails. A second check is resonant excitation directly below the high-energy edge: on the percolation picture the fast 20 ps component should disappear because delocalized states are not populated.
Extended reading notes
Core claim
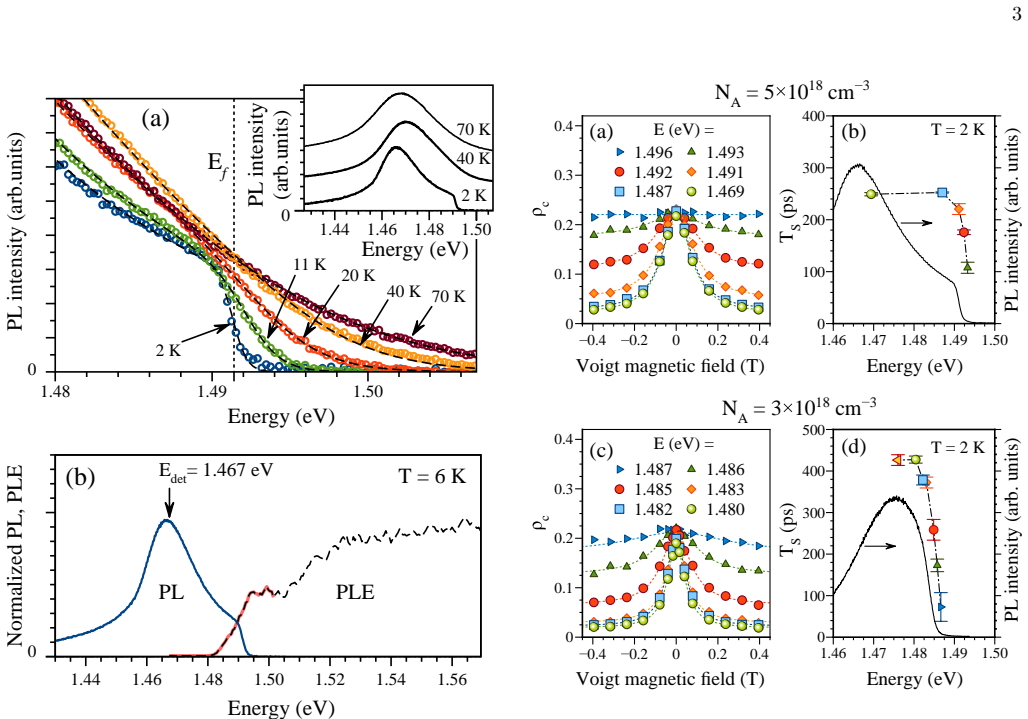
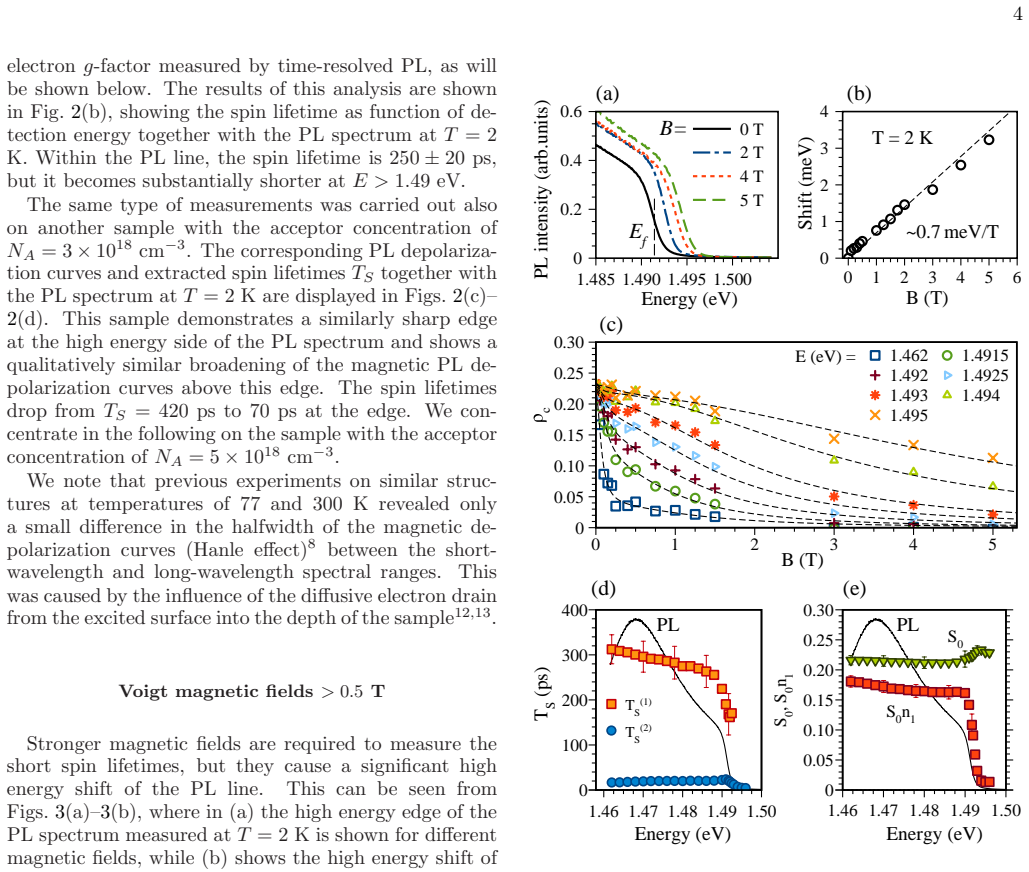
The central claim is that the high-energy edge in the PL spectrum of heavily $p$-doped GaAs with acceptor density $N_A \approx 5\times10^{18}$ cm$^{-3}$ reflects a sharp step in the occupation of conduction-band electrons at the percolation threshold $E_p$, combined with the Fermi-Dirac tail of the equilibrium holes. For $E > E_p$, electrons are delocalized and lose energy rapidly by acoustic-phonon emission, so the states stay essentially empty; for $E < E_p$, the states are localized and the energy-relaxation rate drops, so electrons pile up and recombine slowly with holes at the acceptors. The measured spin lifetimes, $T_S^{(1)} \approx 280$ ps and $T_S^{(2)} \approx 20$ ps, correspond to these two populations, and their relative weights change abruptly at the PL step. This step, with width $\Gamma < 1$ meV at 2 K, is much sharper than the conduction-band potential fluctuations (about 5 meV), which is why a single-particle percolation level, not simply the disorder-broadened band edge, is invoked.
Load-bearing premise
The interpretation rests on assigning the two measured spin lifetimes—about 280 ps and 20 ps—to electrons localized below and delocalized above a sharp percolation threshold; if these lifetimes instead come from different recombination channels, surface losses, or energy-dependent capture by acceptors, the percolation explanation of the sharp PL edge loses its main experimental support.
Editorial extensions
If this is right
- The sharp low-temperature PL edge in heavily $p$-doped GaAs is a direct optical readout of the electron percolation threshold, not merely a thermometer for the hole Fermi distribution.
- The step width is bounded by the holes' Fermi smoothing (below 1 meV at 2 K) plus the acoustic-phonon energy of about 0.2 meV, so sub-Kelvin measurements could sharpen the edge further and test this bound.
- Electron spin relaxation is much slower than electron recombination ($\tau_S > 5\tau$), so the measured spin lifetimes are electron lifetimes, and the two populations can be used as spin carriers with widely different dwell times.
- Raising the temperature washes out the step and removes the fast component, consistent with thermal activation of electrons across $E_p$, which links the optical step to the metal-insulator transition.
Reading between the lines
- If the step energy is a percolation threshold, it should shift in a predictable way with acceptor concentration and compensation; a systematic sample series could turn the PL edge into a quantitative probe of the disorder landscape.
- The same two-ensemble physics may appear in the photoluminescence edges of other heavily doped direct-gap semiconductors, where a similar sharp tail is observed; the Hanle contrast between localized and delocalized electrons could be used as a general diagnostic.
- Excitation with photon energy tuned below $E_p$ should suppress the 20 ps component entirely, offering a direct experimental separation of the two electron populations without magnetic-field analysis.
Signed reviews
Editorial analysis
A structured set of objections, weighed in public.
Referee Report
Summary. The paper investigates the sharp step-like high-energy edge in the low-temperature photoluminescence (PL) spectrum of heavily p-doped GaAs with acceptor densities of 3 and 5×10^18 cm^-3. Using Hanle depolarization, time-resolved PL, and pump-probe Faraday rotation, the authors identify two electron populations with spin lifetimes of about 20 ps and 280 ps. They find that the relative weight of the short-lived component rises abruptly at the high-energy PL edge. They attribute this to a percolation threshold in the conduction band: electrons above the threshold are delocalized and relax quickly (20 ps), while electrons below it are localized and recombine slowly (~280 ps). The paper thus claims that the sharp PL edge is not solely a mirror of the hole Fermi-Dirac distribution, but also reflects a step-like occupation function n(E - E_p) of photoexcited electrons.
Significance. If the interpretation is correct, this is a valuable experimental contribution: it proposes an optical signature of the percolation threshold in a disordered semiconductor and argues that the long-standing explanation of the sharp PL edge in heavily p-doped GaAs (hole Fermi-level cutoff) is incomplete. The strength of the paper is its multi-technique approach: two independent Hanle methods, time-resolved PL, and time-resolved Faraday rotation give mutually consistent lifetimes, and the electron g-factor is measured rather than assumed. The step position is not obtained from a fit to the model, so there is no circularity from fitted parameters. However, the central claim rests on the assignment of the two measured lifetimes to localized and delocalized electron states, and this assignment is inferred rather than directly demonstrated. The paper itself acknowledges that further experiments are needed to separate the hole Fermi-level contribution from the electron percolation-threshold contribution.
major comments (3)
- [Experimental Results, Voigt magnetic fields > 0.5 T (Eq. 4)] The central claim that the two spin lifetimes T_S^(1) ≈ 280 ps and T_S^(2) ≈ 20 ps correspond to electrons below and above a sharp percolation threshold is not uniquely established by the data. The two-Lorentzian decomposition in Eq. (4) shows only that two spin-decay components are present; any two non-equivalent electron populations, such as a fast surface or acceptor-capture channel, would produce equally good fits. The paper does not provide a control experiment that rules out such alternatives. I ask the authors to propose and, if possible, perform a discriminating test—for example, measuring TRPL with excitation energy tuned below the proposed threshold, or studying the excitation-density dependence of the fast component and its weight n1.
- [Experimental Results, Time-resolved photoluminescence (Fig. 4)] There is an apparent inconsistency between the TRPL statement that the fast (≈20 ps) component is absent for E < 1.49 eV and the Hanle statement in Sec. II.B that 'both types of electrons are observed across the whole PL spectral range' (Fig. 3(e)). The authors should reconcile these statements, for example by quantifying the detection limit of a 20 ps component with the streak-camera setup at low energies, or by explicitly testing whether a small fast component improves the fit of the Hanle curves below 1.49 eV. Without this reconciliation, the energy-dependent two-population decomposition is not fully controlled.
- [Discussion and Conclusions] The paper's own concluding remark that 'distinction between the contributions from the hole Fermi level and the electron percolation threshold requires further experimental efforts' is an important caveat. Since the step-like n(E - E_p) is not directly measured but reconstructed from the energy-dependent weights n1 and 1 - n1 in Eq. (4), the authors should state explicitly which experimental observable would distinguish their percolation model from a model in which the PL edge is caused by an energy-dependent electron lifetime alone, without a genuine discontinuity in the occupation function.
minor comments (4)
- [Eq. (1)] The parameter E_f is called an 'energy gap' but is used as an energy offset in a Fermi-Dirac-like fit. Please clarify whether E_f denotes the hole Fermi level or an empirical onset energy, to avoid confusion with the actual band gap.
- [Experimental Results, Time-resolved photoluminescence] The phrase 'E /greaterorsimilar1.49 eV' appears to be a formatting artifact; please ensure the correct relation symbol is used.
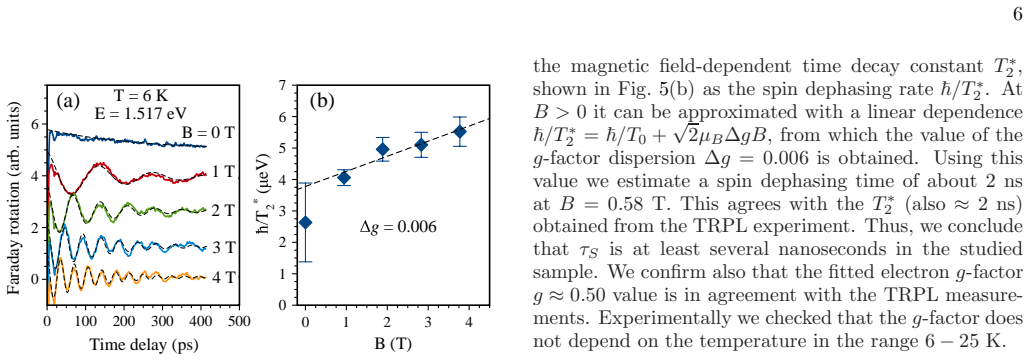
- [Experimental Results, Time-resolved Faraday rotation (Fig. 5)] In the fit expression for the spin dephasing rate, the factor √2 in front of μ_B Δg B is not defined in the text. Please state explicitly why this factor appears.
- [Experimental Results, Time-resolved photoluminescence] The TRPL data were averaged over spectral windows of 0.5 nm. A short comment on whether spectral diffusion within this window could affect the apparent absence of the fast component at low energies would be helpful.
Circularity Check
No significant circularity; the step-like electron distribution is inferred from independent Hanle and TRPL measurements, not from the PL lineshape fit itself.
full rationale
The paper's central claim is that the sharp PL edge in heavily p-doped GaAs reflects a step-like energy distribution of photoexcited electrons caused by a percolation threshold in the conduction band, in addition to the hole Fermi-Dirac distribution. The PL edge is first characterized with Eq. (1), a phenomenological Fermi-Dirac form with fitted parameters Ef, EW, and Tc; this is an input characterization, not a prediction that is then used to define the percolation threshold. The step-like electron distribution is instead inferred from independent measurements: Hanle depolarization curves fitted with Eq. (4) yield two well-separated spin lifetimes of about 280 ps and 20 ps, and TRPL shows a fast component appearing only for E greater than about 1.49 eV. The spectral exchange of the weights n1 and 1-n1 at the PL edge is an experimentally extracted dependence, not a quantity forced by the PL fit. The identification of the short-lived component with delocalized electrons above a percolation threshold and the long-lived component with localized electrons below it is an interpretation, and the paper states in the Conclusions that distinguishing the hole Fermi-level contribution from the electron percolation threshold requires further experimental efforts. That stated limitation is a caveat, not evidence of circularity. The self-citations present, namely Ref. [13] and Ref. [15], are used for measurement techniques and earlier Hanle-diffusion observations; they are not load-bearing definitions of the percolation threshold and do not smuggle in the conclusion. No equation constructs the predicted electron step from the same data used to validate it, and external checks such as the PL-versus-PLE width comparison and the independent g-factor measurement provide support outside the fitted values. Residual concerns about the two-Lorentzian decomposition being model-dependent belong to robustness or correctness assessment, not to circularity.
Assumptions & free parameters
free parameters (7)
- Ef (energy gap in Eq. 1) =
1.4914 eV
- EW (exponential decay parameter in Eq. 1) =
0.016 ± 0.002 eV
- Tc (hole temperature in Eq. 1) =
close to lattice temperature
- T_S^(1) and T_S^(2) (spin lifetimes of the two electron components) =
280 ps and 20 ps for NA = 5e18 cm-3; 420 ps and 70 ps for NA = 3e18 cm-3
- n1 (weight of the slow spin component in Eq. 4) =
energy-dependent, not tabulated
- Electron g-factor =
0.53 ± 0.01
- Delta g (g-factor dispersion) =
0.006
assumptions (2)
- domain assumption A sharp percolation threshold Ep exists in the disordered conduction band of heavily p-doped GaAs, separating localized from delocalized electron states.
- ad hoc to paper Photoexcited electrons above Ep relax by emitting acoustic phonons with energy ~0.2 meV and accumulate at Ep, while electrons below Ep relax very slowly.
Cite this review
Pith. "Pith review of Step-like spectral distribution of photoelectrons at the percolation threshold in heavily $p$-doped GaAs." pith.science (2026). https://pith.science/paper/5RZQS7N6
@misc{pith2026190805487,
  author       = {Pith},
  title        = {Pith review of: Step-like spectral distribution of photoelectrons at the percolation threshold in heavily $p$-doped GaAs},
  year         = {2026},
  howpublished = {\url{https://pith.science/paper/5RZQS7N6}},
  note         = {Machine review of arXiv:1908.05487}
}
abstract
We study the origin of the step-like shoulder on the high energy side of the low temperature photoluminescence spectrum of heavily $p$-doped GaAs. We show experimentally that it is controlled by the Fermi-Dirac distribution of the holes and by the energy distribution of the photoexcited electrons showing a sharp step-like dependence. This step is attributed to the percolation threshold in the conduction band separating localized from delocalized electron states. A comprehensive set of optical techniques based on spin orientation of electrons, namely the Hanle effect, time- and polarization-resolved photoluminescence, as well as transient pump-probe Faraday rotation are used for these studies. We identify two different electron ensembles with substantially different spin lifetimes of 20 and 280~ps, limited by the lifetime of the electrons. Their spin relaxation times are longer than 2~ns. The relative contribution of short- and long-lived photoexcited electrons to the emission spectrum changes abruptly at the high-energy photoluminescence step-like tail. For energies above the percolation threshold the electron states are empty due to fast energy relaxation, while for lower energies the relaxation is suppressed and the majority of photoelectrons populate these states.
Figures
Figures from the paper (2 more)
Reference graph
Works this paper leans on
-
[1]
O. Madelung and B. Taylor, Introduction to Solid-State Theory (Springer, Berlin, 1996)
work page 1996
-
[2]
B. I. Shklovskii and A. L. Efros, Electronic Properties of Doped Semiconductors (Springer-Verlag, Berlin, 1984)
work page 1984
-
[3]
P. W. Anderson, Absence of diffusion in certain random lattices, Phys. Rev. 109, 1492 (1958)
1958
-
[4]
K. v. Klitzing, G. Dorda, M. Pepper, New Method for High-Accuracy Determination of the Fine-Structure Constant Based on Quantized Hall Resistance, Phys. Rev. Lett. 45 , 494 (1980)
work page 1980
-
[5]
D. Olego and M. Cardona, Photoluminescence in heavily doped GaAs. I. Temperature and hole-concentration dependence, Phys. Rev. B 22, 886 (1980)
work page 1980
-
[6]
R. C. Miller, D. A. Kleinman, W. A. Nordland, Jr., and R. A. Logan, Electron spin relaxation and photoluminescence of Zn-doped GaAs, Phys. Rev. B 23, 4399 (1981)
work page 1981
-
[7]
P. Y. Yu and M. Cardona, Fundamentals of Semiconductors: Physics and Materials Properties , 3rd ed., p. 354. (Springer, 2005)
work page 2005
-
[8]
F. Meier and B. P. Zakharchenya, Optical Orientation (Elsevier Science Publishers, Amsterdam, 1984)
work page 1984
Show all 26 references
-
[9]
M. K. Hudait, P. Modak, K. S. R. K. Rao, and S. B. Krupanidhi, Low temperature photoluminescence properties of Zn-doped GaAs, Mater. Sci. Eng. B 57, 62 (1998)
1998
-
[10]
Ku c era and J
M. Ku c era and J. Nov\' a k, Optical characterization of gallium antimonide highly doped with manganese, J. Phys. Chem. Solids 67, 1724 (2006)
2006
-
[11]
Ferreira da Silva, I
A. Ferreira da Silva, I. Pepe, Bo E. Sernelius, C. Persson, R. Ahuja, J. P. de Souza, Y. Suzuki, and Y. Yang, Electrical resistivity of acceptor carbon in GaAs, J. Appl. Phys. 95, 2532 (2004)
2004
-
[12]
D. T. Pierce, F. Meier, and P. Z\"urcher, Negative electron affinity GaAs: A new source of spin‐polarized electrons, Appl. Phys. Lett. 26, 670 (1975)
1975
-
[13]
R. I. Dzhioev, B. P. Zakharchenya, R. R. Ichkitidze, K. V. Kavokin, and P. E. Pak, Spectral dependence of the Hanle effect due to diffusion of optically oriented electrons in p -type semiconductors, Phys. Solid State 10, 1336 (1993)
1993
-
[14]
A. P. Heberle, W. W. Ruhle, and K. Ploog, Quantum beats of electron Larmor precession in GaAs wells, Phys. Rev. Lett. 72, 3887 (1994)
1994
-
[15]
I. A. Akimov, R. I. Dzhioev, V. L. Korenev, Y. G. Kusrayev, E. A. Zhukov, D. R. Yakovlev, and M. Bayer, Electron-spin dynamics in Mn-doped GaAs using time-resolved magneto-optical techniques, Phys. Rev. B 80, 081203(R) (2009)
2009
-
[16]
Weisbuch and C
C. Weisbuch and C. Hermann, Optical detection of conduction-electron spin resonance in GaAs, Ga _ 1-x In _x As, and Ga _ 1-x Al _x As, Phys. Rev. B 15, 816 (1977)
1977
-
[17]
Oestreich and W
M. Oestreich and W. W. R\"uhle, Temperature Dependence of the Electron Land\'e g Factor in GaAs, Phys. Rev. Lett. 74, 2315 (1995)
1995
-
[18]
N. F. Mott and E. A. Davis, Electronic Processes In Non-Crystalline Materials (Oxford University Press, New York, 1979)
1979
-
[19]
Pankove, Absorption edge of impure gallium arsenide, Phys
J. Pankove, Absorption edge of impure gallium arsenide, Phys. Rev. 140, A2059 (1965)
1965
-
[20]
Zhang, K
D. Zhang, K. Radhakrishnan, S. Yoon, and Z. Han, Photoluminescence in degenerate p -type GaAs layers grown by molecular beam epitaxy, Mater. Sci. Eng. B 35, 44 (1995)
1995
-
[21]
Andr\' e , P
J. Andr\' e , P. Guittard, J. Hallais, and C. Piaget, GaAs photocathodes for low light level imaging, J. Cryst. Growth 55, 235 (1981)
1981
-
[22]
V. L. Alperovich, D. A. Orlov, V. G. Grishaev, S. N. Kosolobov, A. S. Jaroshevich, H. E. Scheibler, and A. S. Terekhov, Compact vacuum tubes with GaAs(Cs,O) photocathodes for studying spin-dependent phenomena, Proc. of SPIE 7398, 739818 (2009)
2009
-
[23]
R. I. Dzhioev, M. Kotur, and N. K. Poletaev, Diagnostic of semiconductor device structures by spin-labeled electrons, J. Phys.: Conf. Series 1038, 012087 (2018)
2018
-
[24]
Paget, Optical detection of NMR in high-purity GaAs under optical pumping: Efficient spin-exchange averaging between electronic states, Phys
D. Paget, Optical detection of NMR in high-purity GaAs under optical pumping: Efficient spin-exchange averaging between electronic states, Phys. Rev. B 24, 3776 (1981)
1981
-
[25]
Uemura, K
M. Uemura, K. Honda, Y. Yasue, S. L. Lu, P. Dai, and A. Tackeuchi, Picosecond spin relaxation in low-temperature-grown GaAs, Appl. Phys. Lett. 104, 122403 (2014)
2014
-
[26]
D. T. Pierce and F. Meier, Photoemission of spin-polarized electrons from GaAs, Phys. Rev. B 13, 5484 (1976)
1976
Reviewed August 14, 2026 · model on record in the stance chip above.
Discussion (0). Continue with ORCID to comment.