REVIEW 3 major objections 5 minor 53 references
Determining phase transition using potential energy distribution and surface energy of Pd nanoparticles
T0 review · 3 major / 5 minor · reviewed 2026-08-14 · deepseek-v4-flash
Pith's one-line read The paper proposes that the ratio of total potential energy to bulk cohesive energy gives the surface energy of a Pd nanoparticle, marking melting and cub-to-ico transitions without computing surface area.
desk verdict A careful MD comparison of Pd nanoparticle melting criteria is undermined by an unvalidated, sign-inconsistent surface-energy proxy that simply rescales the total potential energy. read the letter →
The pith
A machine-rendered reading of the paper's core claim, the machinery that carries it, and where it could break.
The reading
What carries the argument
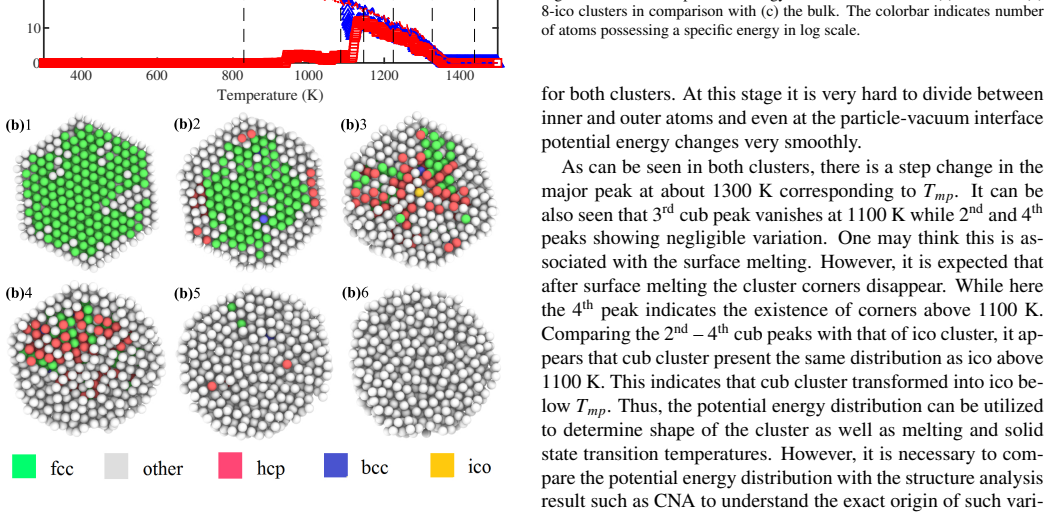
The identity $\gamma_p/\gamma_b = U/E_c$ is the load-bearing object: $U$ is the total potential energy of the cluster, $E_c$ is the per-atom cohesive energy of the bulk, and $\gamma_p/\gamma_b$ is the cluster-to-bulk surface-energy ratio. The paper obtains it by substituting $U$ for the cluster cohesive energy in an existing broken-bond formula for size-dependent surface energy, and the substitution removes the need to estimate cluster surface area. A second tool is the potential-energy-distribution histogram, which resolves surface atoms by site type, namely plane, edge, and corner atoms, and therefore carries the argument that surface-sensitive phase changes can be read from energy spectra.
What would settle it
Take one of the simulated clusters, for example the 8-cub or 8-ico cluster, compute the surface energy at several temperatures by an independent method that actually measures the surface area or uses a finite-temperature slab, and compare the result with $U/E_c$ from the same trajectory; a systematic disagreement in magnitude or in the sign of $\partial\gamma_p/\partial T$ would falsify Eq. (9).
Extended reading notes
Core claim
The paper's central claim is that $\gamma_p/\gamma_b = U/E_c$, obtained by replacing the cluster cohesive energy in a broken-bond size-dependent surface-energy model with the cluster's total potential energy $U$, predicts the surface energy of a hot, finite nanoparticle. On this basis, $\gamma_p$ falls with temperature, rises sharply at the cub-to-ico shape transition, and drops at melting, with the predicted size dependence following the established nonlinear size-dependent trend rather than the linear slab-model trend. The same simulation data show that a histogram of per-atom potential energies has separate peaks for interior, plane, edge, and corner atoms at low temperature; the disappearance of the corner or edge features near 1100 K flags the allotropic transition, while the main peak shifts near 1300 K at melting. Common-neighbor analysis and the radial distribution function, by contrast, cannot by themselves separate surface melting from an allotropic change.
Load-bearing premise
The load-bearing premise is that the cluster's total potential energy divided by the bulk cohesive energy ($U/E_c$) really equals its surface-energy ratio, a substitution asserted from a broken-bond model that the paper does not independently derive or verify.
Editorial extensions
If this is right
- Surface energy of Pd nanoparticles can be monitored throughout a heating run from the same potential-energy trajectory used for caloric curves, with no separate surface-area calculation.
- Cub-to-ico transitions appear as a local minimum in $\gamma_p$ and a minor peak in $C_p$, so allotropic changes no longer need to be inferred solely from structure analysis.
- The simple slab-model expression, which gives increasing $\gamma_p$ with temperature and a linear size dependence, is shown to contradict both empirical temperature behavior and established size dependence; the normalized-ratio form corrects this.
- For small clusters of about 2 to 8 shells, the cub structure transforms to ico during relaxation or before melting, so size-dependent melting models that assume a fixed static shape systematically misestimate $T_{mp}$.
Reading between the lines
- If the identity $\gamma_p/\gamma_b = U/E_c$ holds generally, similar normalized-potential-energy diagnostics could be applied to other metals and alloys, and possibly to estimate surface stress or evaluate shape stability at finite temperature.
- Because per-atom potential energy is inexpensive to histogram, the method could scale to larger nanocrystals or long annealing runs where structural classification becomes costly.
- A direct test on a single cluster would be to compute the surface energy independently via a finite-temperature slab or thermodynamic integration and compare it with $U/E_c$; the paper does not provide that check.
Signed reviews
Editorial analysis
A structured set of objections, weighed in public.
Referee Report
Summary. The manuscript reports molecular dynamics simulations of Pd nanoparticles in cuboctahedral and icosahedral shapes (55-28741 atoms) using an EAM potential, with simulated heating at 1.4e12 K/s in the NVT ensemble. It compares conventional melting diagnostics (potential energy caloric curves, C_p, G(r), CNA) with two proposed diagnostics: per-atom potential energy distributions (PED) and a surface-energy ratio gamma_p/gamma_b defined by Eq. (9) as U/E_c. The PED analysis identifies interior, plane, edge, and corner atoms and shows the cub-to-ico transition as the disappearance of the third surface peak. The authors claim Eq. (9) avoids surface-area estimation and predicts correct temperature and size trends consistent with Guggenheim-Katayama and Tolman, in contrast to the slab model Eq. (4). Size-dependent melting temperatures and enthalpies are also compared with prior simulations and models.
Significance. The PED diagnostic is a genuine contribution: it is a simple, surface-sensitive descriptor that can distinguish surface sites and shows a clear signature of the allotropic transition. If Eq. (9) were valid, the surface-area-free gamma_p proxy would be practically useful. However, the paper's central surface-energy claim rests on an unproven substitution and, as written, a sign inconsistency; the agreement with Guggenheim-Katayama and Tolman is largely a restatement of the temperature and size dependence of U. The manuscript also lacks uncertainty estimates for transition temperatures and C_p. The work is therefore of moderate significance in its present form, with the PED part salvageable and the gamma_p part requiring substantial additional validation.
major comments (3)
- [3.2.5, Eq. (9)] The identity gamma_p/gamma_b = U/E_c is asserted by substituting the instantaneous total potential energy U for the cluster cohesive energy E_p in Jiang-Lu's Eq. (8). This substitution is not derived, and it conflates two distinct quantities: E_p is a 0 K cohesive energy per atom, while U is a finite-temperature total potential energy per atom that includes vibrational and configurational contributions. Moreover, U is negative in Fig. 2, so Eq. (9) as written gives a negative gamma_p/gamma_b, while Fig. 6 reports positive gamma_p values in mJ/m^2; an unstated absolute value or sign convention is needed. With either sign, gamma_p is proportional to U, so the negative temperature slope, the size trend, and the local minimum at the cub-to-ico transition in Fig. 6 are inherited from U(T), not independent surface-energy predictions. The authors should either derive Eq. (9) from a physical model or validate it against a direct finite-temperature surface-energy calculation (e.g., from the surface-area-dependent Eq. (4) or an explicit surface construction). Without this, the claimed agreement with Guggenheim-Katayama and Tolman is not established.
- [3.3.3, Fig. 9] The size-dependent comparison in Fig. 9 does not validate Eq. (9). At fixed T, Eq. (9) is simply U/E_c; its increase toward unity with diameter is the well-known size dependence of the average potential energy of the cluster, not a new surface-energy result. The figure compares Eq. (9) with Eq. (8), which has the same functional dependence on E_p, and with the slab-model Eq. (4), which gives a different trend; no independent gamma_p measurement at finite temperature is provided. Thus the statement that Eq. (9) 'predicts the correct temperature and size-dependent trend' is a restatement of U's behavior. The authors should provide a quantitative comparison with an independent surface-energy estimator and report the actual numerical values of gamma_p/gamma_b, not just normalized curves.
- [3.2.1, 3.2.5, Figs. 2 and 6] Transition temperatures and the claim that the allotropic transition appears more clearly in C_p and gamma_p are based on visual inspection without uncertainty quantification. C_p is computed as a numerical derivative of averaged U, but no convergence tests with respect to sampling length, block size, or heating rate are reported, and no error bars are given for T_mp or for the local minimum in gamma_p. Because the central advantage claimed for gamma_p over U is that the transition 'appears more clearly,' the authors need a quantitative criterion (e.g., peak height relative to noise, or a statistical test) to support this comparison. The same applies to the step at ~1070 K in the caloric curve and the CNA percentages.
minor comments (5)
- [Fig. 6] The y-axis is in mJ/m^2, while Eq. (9) defines a dimensionless ratio gamma_p/gamma_b; state explicitly how the ratio is converted to absolute values (presumably multiplying by gamma_b = 2050 mJ/m^2).
- [Throughout] There are several typos: 'slop' should be 'slope' in Sec. 3.2.5 and Sec. 4; 'clusterss' in the Fig. 1 caption should be 'clusters'; and in ref. [16], 'M. tukesh' appears to be a typo that should be verified.
- [3.3.1] The text says '2-8-cub clusters are showing a different trend,' but earlier it is stated that 2-cub and 4-cub transform to ico during relaxation; clarify which structures are actually used in the T_mp comparison.
- [Fig. 7] The legend entries '12', '13', and '14' are unexplained; these appear to be cluster sizes from ref. [44] but should be labeled for the reader.
- [Data Availability] The statement that raw/processed data cannot be shared limits reproducibility; providing at least representative trajectories or derived data for the key figures would strengthen the manuscript.
Circularity Check
Eq. (9) defines gamma_p/gamma_b as U/E_c, so the claimed Guggenheim-Katayama and Tolman agreement merely restates the temperature and size dependence of the total potential energy.
-
self definitional
[Section 3.2.5, Eq. (9), and the trend claims in the abstract and Fig. 6]
"One can adopt Eq. (8) by substituting E p with U: γp/γb = U/Ec (9) The main advantage of Eq. (9) is the fact that it does not need the estimation of the cluster surface area. ... It can be seen that Eq. (9) predicts the correct slop i.e. ∂γp/∂T < 0."
Equation (9) defines the new surface-energy proxy as the ratio of the cluster's total potential energy U to the bulk cohesive energy E_c. U is exactly the quantity whose caloric curve is shown in Fig. 2 and whose size dependence underlies Fig. 9. Therefore every temperature slope, isotherm step, and size trend of gamma_p/gamma_b in Fig. 6 and Fig. 9 is inherited from U by construction. The claimed agreement with Guggenheim-Katayama (temperature) and Tolman (size) is not an independent test of a surface-energy quantity; it is a restatement of the measured behavior of U. No independent surface-area calculation, direct finite-temperature surface-energy computation, or comparison with Eq. (4) for the same temperature series is used to validate the substitution.
full rationale
The circularity is localized to the paper's central new surface-energy formula, Eq. (9). The authors replace the zero-temperature cluster cohesive energy E_p in the Jiang-Lu relation (Eq. 8) with the finite-temperature total potential energy U and then present the resulting gamma_p/gamma_b = U/E_c as a method that 'predicts the correct temperature and size-dependent trend.' Because gamma_p/gamma_b is defined to be proportional to U, the claimed successes are consequences of the definition rather than empirical or theoretical validations of a surface-energy proxy. This is a genuine self-definitional reduction. However, the paper also contains non-circular components: the potential energy distribution analysis (Fig. 5) is an independent visualization of per-atom energies, the C_p and CNA comparisons are standard observables, and the melting temperatures are benchmarked against previous MD and MC results. The self-citation of the authors' prior work (Ref. [2]) is used for interpreting the cub-to-ico transition but is not the load-bearing step for Eq. (9), so it does not raise the score further. The score of 6 reflects that one central prediction reduces by construction, while the rest of the paper has independent content. A separate correctness concern, not counted as circularity, is that Eq. (9) as written gives a negative ratio for the negative potential energies shown in Fig. 2, so the plotted positive values imply an unstated sign convention.
Assumptions & free parameters
assumptions (6)
- domain assumption The EAM potential (Foiles et al., 1986) accurately describes Pd interatomic interactions, including melting and surface energies.
- domain assumption Nose-Hoover thermostat with 30 fs damping and 300 ps relaxation at 300 K yields canonical sampling adequate for thermodynamics.
- domain assumption Magic-number construction (Eq. 2) produces the full-shell cub and ico clusters that represent experimental Pd nanoparticles.
- domain assumption The Jiang-Lu broken-bond model (Eq. 8) is a valid description of size-dependent surface energy for Pd clusters.
- ad hoc to paper Replacing E_p with U in Eq. (8) is legitimate without further derivation.
- domain assumption C_p(T) = d<U>_T/dT + 3/2 R computed from MD trajectories is accurate despite finite sampling.
Cite this review
Pith. "Pith review of Determining phase transition using potential energy distribution and surface energy of Pd nanoparticles." pith.science (2026). https://pith.science/paper/5VRP54Y6
@misc{pith2026190803956,
  author       = {Pith},
  title        = {Pith review of: Determining phase transition using potential energy distribution and surface energy of Pd nanoparticles},
  year         = {2026},
  howpublished = {\url{https://pith.science/paper/5VRP54Y6}},
  note         = {Machine review of arXiv:1908.03956}
}
read the original abstract
Molecular dynamics simulation is employed to understand the thermodynamic behavior of cuboctahedron (cub) and icosahedron (ico) nanoparticles with 2-20 number of shells (55-28741 atoms). The embedded atom method was used to describe the interatomic potential. Conventional melting criteria such as potential energy and specific heat capacity (C_p) caloric curves as well as structure analysis by radial distribution function (G(r)) and common neighbor analysis (CNA) were utilized simultaneously to provide a comprehensive picture of the melting process. It is shown that the potential energy distribution and surface energy (gamma_p) proposed here are holding several advantages over previous criteria. In particular, potential energy distribution can distinguish between interior and surface atoms and even corner, edge and plane atoms at the surface. While G(r) and CNA are not surface sensitive methods and cannot distinguish between surface melting and an allotropic transition. It is also shown that allotropic change appears more clearly in C_p and gamma_p rather than potential energy. However, determining accurate C_p requires enough sampling to be averaged. Finally, a few issues in the current methods for determining gamma_p were discussed and a simple method based on available models was proposed which, independent of estimation of the surface area, predicts the correct temperature and size-dependent trend in agreement with Guggenheim-Katayama and Tolman's models, respectively.
Figures


Figures from the paper (5 more)



Reference graph
Works this paper leans on
-
[1]
M. Schmidt, R. Kusche, B. von Issendor ff, H. Haberland, Irregular vari- ations in the melting point of size-selected atomic clusters, Nature 393 (1998) 238–240
work page 1998
- [2]
-
[3]
Y . Pan, S. Huang, Z. Liu, W. Wang, Molecular dynamics simulation of shell-symmetric Pd nanoclusters, Molecular Simulation 31 (2005) 1057– 1061
work page 2005
-
[4]
J. Westergren, S. Nordholm, Melting of palladium clusters–density of states determination by Monte Carlo simulation, Chemical physics 290 (2003) 189–209
work page 2003
-
[5]
F. Baletto, R. Ferrando, A. Fortunelli, F. Montalenti, C. Mottet, Crossover among structural motifs in transition and noble-metal clusters, Journal of chemical physics 116 (2002) 3856–3863
work page 2002
-
[6]
D. Schebarchov, S. Hendy, Solid-liquid phase coexistence and structural transitions in palladium clusters, Physical Review B 73 (2006) 121402
work page 2006
-
[7]
F. A. Lindemann, The calculation of molecular vibration frequencies, Physikalische Zeitschrift 11 (1910) 609–612
work page 1910
- [8]
Show all 53 references
-
[9]
Zhang, J
H. Zhang, J. F. Douglas, Glassy interfacial dynamics of Ni nanoparticles: part I colored noise, dynamic heterogeneity and collective atomic motion, Soft Matter 9 (2013) 1254–1265
2013
-
[10]
Shim, B.-J
J.-H. Shim, B.-J. Lee, Y . W. Cho, Thermal stability of unsupported gold nanoparticle: a molecular dynamics study, Surface science 512 (2002) 262–268
2002
-
[11]
S. Zhao, S. Wang, D. Cheng, H. Ye, Three distinctive melting mech- anisms in isolated nanoparticles, Journal of Physical Chemistry B 105 (2001) 12857–12860
2001
-
[12]
Y . Qi, T. C ¸ aˇgin, W. L. Johnson, W. A. Goddard III, Melting and crystal- lization in Ni nanoclusters: The mesoscale regime, Journal of chemical physics 115 (2001) 385–394
2001
-
[13]
L. Wang, Y . Zhang, X. Bian, Y . Chen, Melting of Cu nanoclusters by molecular dynamics simulation, Physics Letters A 310 (2003) 197–202
2003
-
[14]
F. D. Fischer, T. Waitz, D. V ollath, N. K. Simha, On the role of surface energy and surface stress in phase-transforming nanoparticles, Progress in Materials Science 53 (2008) 481–527
2008
-
[15]
F. P. Bu ff, The spherical interface. I. Thermodynamics, Journal of Chem- ical Physics 19 (1951) 1591–1594
1951
-
[16]
V . S. Myasnichenko, M. Razavi, M. tukesh, N. Y . Sdobnyakov, M. D. Starostenkov, Molecular dynamic investigation of size-dependent surface energy of icosahedral copper nanoparticles at different temperature, Let- ters on Materials 6 (2016) 266–270
2016
-
[17]
Q. Mei, K. Lu, Melting and superheating of crystalline solids: From bulk to nanocrystals, Progress in Materials Science 52 (2007) 1175–1262
2007
-
[18]
S. K. Sankaranarayanan, V . R. Bhethanabotla, B. Joseph, Molecular dy- namics simulation study of the melting of Pd–Pt nanoclusters, Physical Review B 71 (2005) 195415
2005
-
[19]
M. P. Allen, D. J. Tildesley, Computer simulation of liquids, Oxford uni- versity press, 1989
1989
-
[20]
Plimpton, Fast parallel algorithms for short-range molecular dynamics, Journal of computational physics 117 (1995) 1–19
S. Plimpton, Fast parallel algorithms for short-range molecular dynamics, Journal of computational physics 117 (1995) 1–19
1995
-
[21]
Foiles, M
S. Foiles, M. Baskes, M. Daw, Embedded-atom-method functions for the fcc metals Cu, Ag, Au, Ni, Pd, Pt, and their alloys, Physical Review B 33 (1986) 7983
1986
-
[22]
M. S. Daw, S. M. Foiles, M. I. Baskes, The embedded-atom method: a review of theory and applications, Materials Science Reports 9 (1993) 251–310
1993
-
[23]
Foiles, J
S. Foiles, J. Adams, Thermodynamic properties of fcc transition metals as calculated with the embedded-atom method, Physical Review B 40 (1989) 5909
1989
-
[24]
Foiles, Application of the embedded-atom method to liquid transition metals, Physical Review B 32 (1985) 3409
S. Foiles, Application of the embedded-atom method to liquid transition metals, Physical Review B 32 (1985) 3409
1985
-
[25]
J. Mei, J. Davenport, G. Fernando, Analytic embedded-atom potentials for fcc metals: Application to liquid and solid copper, Physical Review B 43 (1991) 4653
1991
-
[26]
M. S. Daw, M. I. Baskes, Embedded-atom method: Derivation and ap- plication to impurities, surfaces, and other defects in metals, Physical Review B 29 (1984) 6443
1984
-
[27]
Verlet, Computer ”experiments” on classical fluids
L. Verlet, Computer ”experiments” on classical fluids. I. Thermodynam- ical properties of Lennard-Jones molecules, Physical review 159 (1967) 98
1967
-
[28]
Kateb, K
M. Kateb, K. Dehghani, Comparison of fracture behavior of sharp with blunt crack tip in nanocrystalline materials by molecular dynamics sim- ulation, International Journal of Modern Physics: Conference Series 5 (2012) 410–417
2012
-
[29]
Jos ´e-Yacam´an, M
M. Jos ´e-Yacam´an, M. Mar ´ın-Almazo, J. A. Ascencio, High resolution TEM studies on palladium nanoparticles, Journal of Molecular Catalysis 8 A: Chemical 173 (2001) 61–74
2001
-
[30]
Y . Wen, H. Fang, Z. Zhu, S. Sun, Molecular dynamics investigation of shape e ffects on thermal characteristics of platinum nanoparticles, Physics Letters A 373 (2009) 272–276
2009
-
[31]
C. P. Poole Jr, F. J. Owens, Introduction to nanotechnology, John Wiley & Sons, 2003
2003
-
[32]
A. Stukowski, Visualization and analysis of atomistic simulation data with OVITOthe open visualization tool, Modelling and Simulation in Materials Science and Engineering 18 (2009) 015012
2009
-
[33]
Zhang, Y .-H
Y . Zhang, Y .-H. Wen, Z.-Z. Zhu, S.-G. Sun, Structure and stability of Fe nanocrystals: An atomistic study, The Journal of Physical Chemistry C 114 (2010) 18841–18846
2010
-
[34]
Chepkasov, Y
I. Chepkasov, Y . Y . Gafner, M. Vysotin, et al., A study of melting of various types of Pt–Pd nanoparticles, Physics of the Solid State 59 (2017) 2076–2081
2017
-
[35]
I. V . Chepkasov, M. A. Visotin, E. A. Kovaleva, A. M. Manakhov, V . S. Baidyshev, Z. I. Popov, Stability and electronic properties of PtPd nanoparticles via MD and DFT calculations, The Journal of Physical Chemistry C 122 (2018) 18070–18076
2018
-
[36]
P. J. Steinhardt, D. R. Nelson, M. Ronchetti, Bond-orientational order in liquids and glasses, Physical Review B 28 (1983) 784
1983
-
[37]
Faken, H
D. Faken, H. Jnsson, Systematic analysis of local atomic structure com- bined with 3D computer graphics, Computational Materials Science 2 (1994) 279–286
1994
-
[38]
Vitos, A
L. Vitos, A. Ruban, H. L. Skriver, J. Kollar, The surface energy of metals, Surface Science 411 (1998) 186–202
1998
-
[39]
Medasani, I
B. Medasani, I. Vasiliev, Computational study of the surface properties of aluminum nanoparticles, Surface Science 603 (2009) 2042–2046
2009
-
[40]
L. Miao, V . R. Bhethanabotla, B. Joseph, Melting of Pd clusters and nanowires: a comparison study using molecular dynamics simulation, Physical Review B 72 (2005) 134109
2005
-
[41]
N. K. Adam, The Physics and Chemistry of Surfaces (ed. 3), Oxford uni- versity press, 1941
1941
-
[42]
Jiang, H
Q. Jiang, H. Lu, Size dependent interface energy and its applications, Surface Science Reports 63 (2008) 427–464
2008
-
[43]
Safaei, The e ffect of the averaged structural and energetic features on the cohesive energy of nanocrystals, Journal of Nanoparticle Research 12 (2010) 759–776
A. Safaei, The e ffect of the averaged structural and energetic features on the cohesive energy of nanocrystals, Journal of Nanoparticle Research 12 (2010) 759–776
2010
-
[44]
Y . J. Lee, E.-K. Lee, S. Kim, R. M. Nieminen, E ffect of potential energy distribution on the melting of clusters, Physical review letters 86 (2001) 999
2001
-
[45]
Wortis, Equilibrium crystal shapes and interfacial phase transitions, in: Chemistry and Physics of Solid Surfaces VII, Springer, 1988, pp
M. Wortis, Equilibrium crystal shapes and interfacial phase transitions, in: Chemistry and Physics of Solid Surfaces VII, Springer, 1988, pp. 367– 405
1988
-
[46]
Attarian Shandiz, A
M. Attarian Shandiz, A. Safaei, Melting entropy and enthalpy of metallic nanoparticles, Materials Letters 62 (2008) 3954–3956
2008
-
[47]
T. Iida, R. I. Guthrie, The physical properties of liquid metals, Clarendon Press, Walton Street, Oxford OX 2 6 DP, UK, 1988. (1988)
1988
-
[48]
H. Lu, Q. Jiang, Comment on higher surface energy of free nanoparticles, Physical review letters 92 (2004) 179601
2004
-
[49]
Lamber, S
R. Lamber, S. Wetjen, N. I. Jaeger, Size dependence of the lattice param- eter of small palladium particles, Physical Review B 51 (1995) 10968
1995
-
[50]
R. C. Tolman, The e ffect of droplet size on surface tension, Journal of chemical physics 17 (1949) 333–337
1949
-
[51]
Samsonov, L
V . Samsonov, L. Shcherbakov, A. Novoselov, A. Lebedev, Investigation of the microdrop surface tension and the linear tension of the wetting perimeter on the basis of similarity concepts and the thermodynamic per- turbation theory, Colloids and Surfaces A: Physicochemical and ...
1999
-
[52]
Tayyebi, S
E. Tayyebi, S. Amjad-Iranagh, K. Golzar, H. Modarress, Surface ten- sion curvature correction for fluidvapour interface by thermodynamics of curved boundary layers, Physics and Chemistry of Liquids 52 (2014) 400–415
2014
-
[53]
Samsonov, A
V . Samsonov, A. Chernyshova, N. Y . Sdobnyakov, Size dependence of the surface energy and surface tension of metal nanoparticles, Bulletin of the Russian Academy of Sciences: Physics 80 (2016) 698–701. 9
2016
Reviewed August 14, 2026 · model on record in the stance chip above.
Discussion (0). Continue with ORCID to comment.