REVIEW 5 major objections 5 minor 27 references
KANS: Knowledge Discovery Graph Attention Network for Soft Sensing in Multivariate Industrial Processes
T0 review · 5 major / 5 minor · reviewed 2026-08-10 · deepseek-v4-flash
Pith's one-line read KANS claims that a graph attention network can beat state-of-the-art soft sensors on the Cranfield MFP dataset by learning the sensor graph itself from data, without predefined topology.
desk verdict A credible incremental soft-sensing paper with consistent benchmark wins, but its knowledge-discovery claim is undermined by a supervised graph-learning loop and missing controls. read the letter →
The pith
A machine-rendered reading of the paper's core claim, the machinery that carries it, and where it could break.
The reading
What carries the argument
The central mechanism is the unsupervised graph structure learning step: each sensor is assigned a latent embedding, and the cosine similarity between embeddings defines candidate edges, with the adjacency matrix selecting the top-k most similar neighbours per sensor. This learned graph is then fed into a multi-head graph attention layer that computes attention coefficients from concatenated node representations and aggregates neighbourhood features in parallel, allowing the whole pipeline to be trained end-to-end by the MSE prediction loss.
What would settle it
A concrete check is to train KANS on the same Cranfield MFP data with the learned graph replaced by a graph of random or permuted edges, or by a graph built from raw data correlation with no learned embeddings. If the accuracy gain disappears, or does not degrade monotonically as the graph quality is reduced, then the claim that discovered structure is responsible for the improvement would be refuted. Another decisive test is to take a process with known ground-truth sensor topology and compare the learned adjacency matrix to that topology; if the learned edges do not match, the knowledge-discovery claim fails.
Extended reading notes
Core claim
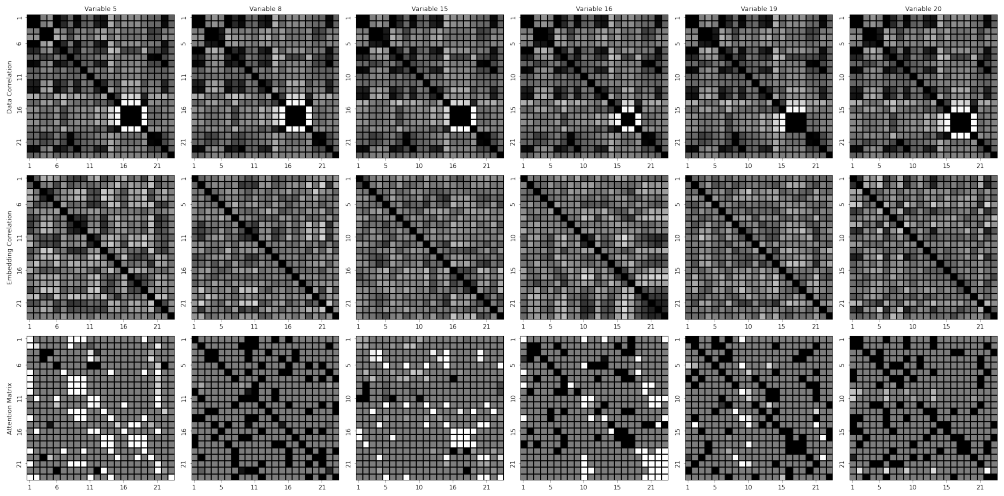
The central discovery is that the relational structure among sensors in a multivariate industrial process can be learned jointly with the soft-sensing objective, and that this learned graph yields both accuracy gains and interpretability. KANS builds a graph in which each sensor is a node, edges are chosen by top-k cosine similarity between learned embedding vectors, and a graph attention layer aggregates neighbor information through normalized attention weights. The end-to-end model, trained with MSE on the target variable, predicts each of six Cranfield MFP variables with lower NRMSE, NMAE, and MAPE and higher R2 than all compared methods. In addition, the embedding correlation and attention matrices exhibit clusters that match physically interpretable groupings in the process, supporting the claim that the model discovers genuine sensor relationships without predefined topology.
Load-bearing premise
The load-bearing premise is that the cosine similarity of the learned sensor embeddings reflects genuine, stable relationships among the physical process sensors, rather than being an artifact of the supervised prediction loss; because the process is described as highly dynamic, those relationships would need to remain informative for the graph to contribute to prediction.
Editorial extensions
If this is right
- KANS can be applied to a new multivariate industrial process without any prior graph or expert-labelled sensor relationships, because the topology is learned from data.
- The model predicts high-frequency and multi-scale variables more accurately than recurrent baselines, as demonstrated for variables 5, 8, and 20.
- The learned graph and attention weights can be inspected to identify which sensors are most relevant to a target variable, offering interpretability for process operators.
- Because the graph is learned jointly with the prediction objective, the same framework could in principle be retrained as process dynamics change, although the paper only evaluates a static train-test split.
- The parallel graph attention computation avoids the sequential processing of recurrent models, which the paper argues improves both speed and soft sensing performance.
Reading between the lines
- One concrete extension the authors leave implicit is to test whether the learned graph transfers to other predictive tasks on the same plant, such as fault detection or control-relevant variable selection; the paper does not conduct such transfer experiments.
- The top-k adjacency construction yields a directed graph; making the graph symmetric or letting the sparsity level k adapt per sensor could improve both accuracy and stability, a variant not explored here.
- Because the paper evaluates on a single dataset, a natural next test is to benchmark KANS on other established industrial soft-sensing cases, such as penicillin fermentation or steelmaking, which the paper cites as related applications; the design suggests the gains should generalize, but this remains an open claim.
- The authors suggest hypergraphs for future work; one concrete way to pursue this would be to let each soft-sensing target induce its own subgraph of relevant sensors, rather than relying only on pairwise edges.
Signed reviews
Editorial analysis
A structured set of objections, weighed in public.
Referee Report
Summary. The paper proposes KANS, a graph attention network for soft sensing in multivariate industrial processes. Sensor embeddings are used to construct an adjacency matrix via cosine similarity with top-k sparsification, and a graph attention layer then aggregates neighbor features to predict a target process variable. The model is trained end-to-end with an MSE loss on the Cranfield Multiphase Flow dataset, and the authors report that KANS outperforms seven baseline and state-of-the-art methods across six target variables and four metrics. The paper also presents heatmaps of data correlation, embedding correlation, and attention matrices as a knowledge-discovery analysis, claiming that KANS finds sensors related to different process variables without domain knowledge.
Significance. If the performance and interpretability claims hold, the idea of learning sensor graph structure from learned embeddings is a useful contribution to soft sensing, with potential to reduce reliance on expert-defined topologies. The paper is clearly organized and the experimental scope, covering six output variables and four metrics on a real industrial benchmark, is appropriate. However, the evidence as presented is not yet sufficient to support the central claims: the graph learning is not genuinely unsupervised, the knowledge-discovery analysis is partly circular, and the performance comparison lacks statistical grounding, ablation controls, and a stated data split. These issues are load-bearing because both the performance advantage and the discovery claim depend on the validity of the learned graph structure.
major comments (5)
- [§II-C, §II-D, Eqs. (2), (3), (9)] The graph structure learning described as 'unsupervised contrastive' is not unsupervised and not contrastive. The embeddings z_i used in Eq. (2) are trained jointly with the supervised MSE loss (Eq. (9)) through Eq. (4), Eq. (7), Eq. (8), and the readout layer. No contrastive objective is defined anywhere. Consequently, the adjacency matrix A is a function of the target variable y(t), and the knowledge-discovery heatmaps in Fig. 4 are self-validating: the embedding geometry was optimized to predict that specific output. To support the claim of discovering process relationships without domain knowledge, the authors need either a genuinely unsupervised or target-independent embedding pretraining step, or control experiments such as a random-label training check and a frozen-graph comparison.
- [§III-A, §III-D] The manuscript never states how the data were split into training, validation, and test sets. For a time-series benchmark, the split protocol is critical: a contiguous temporal split versus a random split changes the difficulty and the validity of the results. The paper should report the number of samples, the split ratio, and whether the test sequence is contiguous and later in time. Without this information, the generalization claim in Table II cannot be assessed.
- [§IV-A, Table II] All results in Table II are point estimates with no error bars, confidence intervals, or significance tests. The abstract and Section IV-A use the word 'significantly', but no statistical comparison is provided. Because deep models are sensitive to initialization and training stochasticity, the authors should report mean and standard deviation over multiple seeds, and for pairwise comparisons use a paired test appropriate for time-series forecasts, such as the Diebold-Mariano test.
- [§II-D, §IV-A, Table II] There is no ablation that isolates the contribution of the learned graph structure. The performance gain of KANS over GRU could come from the graph attention mechanism, from the extra embedding parameters, from the wider feature representation, or from the learned adjacency. The authors should compare KANS against a variant with a fully connected graph, a variant with a random graph, and a variant without the graph module but with the same embedding and attention capacity. In addition, the sparsity parameter k from Eq. (3) is never reported, so the reader cannot know the density of the learned graph.
- [§II-C, Eqs. (2), (3)] The procedural details of graph learning are incomplete. It is unclear whether the adjacency matrix A is recomputed during training after every gradient step, updated periodically, or fixed after an initial forward pass. Since the top-k operation in Eq. (3) is non-differentiable, the manuscript should explain how gradients flow through this selection in the end-to-end training described in Eq. (9). Without this clarification, the method is not fully reproducible.
minor comments (5)
- [Abstract and §I] The term 'unsupervised contrastive graph structure learning' is used in the abstract and introduction, but the method contains no contrastive loss; consider renaming this to 'embedding-based graph structure learning' to avoid misleading readers.
- [Fig. 1] The figure contains the label 'CUNSUPERVISED CONSTRATIVE', which appears to be a typo for 'unsupervised contrastive'. Please correct the spelling.
- [§I] There are several typos, including 'non-Euclidian' in the introduction and 'constructive' instead of 'contrastive' in the contribution summary. A careful proofread is needed.
- [References] Reference [26] is listed as Hamilton, Ying, and Leskovec, 'Inductive representation learning on large graphs' (GraphSAGE), but in the text it is cited as STAE. Either the citation or the reference list is incorrect. Reference [27] may also need verification against the STAE/GSTAE description.
- [§IV-B, Fig. 4] The heatmap analysis is qualitative; the paper would benefit from a quantitative measure comparing the embedding correlation matrix with the data correlation matrix (e.g., matrix distance or graph edit distance) to support the claim that the learned clusters 'resemble' those in the data.
Circularity Check
The graph adjacency used for knowledge discovery is computed from embeddings trained by the supervised prediction loss, so the claimed unsupervised discovery reduces to target-specific feature selection.
-
fitted input called prediction
[Section II-C (Eqs. 2–3) and Section II-D (Eq. 9)]
"we present a flexible way to construct the topology between sensors by assessing the similarity score eji of the sensor i’s embedding vector... Aji = (1, if j ∈ top-k ({eki : k ∈ Ri}) 0, otherwise)... To concurrently learn the embedding in (2) and (7) for graph structure and representation, respectively, we introduce a Mean Squared Error (MSE) loss on ground truth y(t) and predicted output ˆy(t) and train the end-to-end via stochastic gradient descent."
The adjacency matrix A that defines the 'discovered' graph is built from cosine similarities of sensor embeddings zi (Eq. 2) via top-k selection (Eq. 3). The same zi are trainable parameters of the supervised predictor: they appear in the node feature construction (Eq. 4), in the element-wise products for the final prediction (Eq. 8), and are updated by the MSE loss on the target y(t) (Eq. 9). Therefore the graph structure is not unsupervised or process-derived; it is a supervised encoding of which input sensors the loss found useful for predicting that particular output variable.
-
other
[Section IV-B (Fig. 4)]
"All the correlations and attention matrices are obtained from the test datasets, which are then visualized as heatmaps in Fig. 4, with respect to each experiment setting in Table II."
The knowledge-discovery validation computes embedding-correlation and attention heatmaps from the same trained model and compares them with data correlations on the same test set used for evaluation. Because the embeddings were optimized via the supervised MSE to predict the target, their correlation structure is expected to mirror input-target dependencies; observing that the two matrices resemble each other is a self-consistency check of the trained predictor, not independent evidence that the identified sensor groupings are genuine process mechanisms. Without a frozen-graph ablation, a label-shuffled control, or a held-out discovery task, the interpretability claim cannot be separated from target-specific feature selection.
full rationale
The soft-sensing performance comparison (Table II) is an independent benchmark result: KANS is trained and evaluated against baselines on held-out test data, so the accuracy claim is not circular. The circularity is confined to the knowledge-discovery contribution. The graph adjacency A in Eqs. 2-3 is a function of sensor embeddings zi, and those embeddings are optimized by the supervised MSE in Eq. 9 to predict the target variable y(t). Consequently, the 'unsupervised contrastive graph structure learning' is supervised in effect: the discovered relationships depend on the target label. The Fig. 4 heatmaps compare embedding correlation and attention matrices with data correlations on the same test set; since the embeddings were trained on that prediction task, resemblance between them is expected and does not independently confirm process mechanisms. The paper also states 'The model is trained exclusively only on x(t)' while Eq. 9 trains on y(t), an inconsistency that reinforces that the graph is not constructed without target information. No frozen-graph ablation, random-label control, or held-out discovery test is provided. Thus the central interpretability claim reduces to target-specific feature selection, while the core regression benchmark remains independently grounded.
Assumptions & free parameters
free parameters (8)
- top-k sparsity parameter k
- sliding window size w =
85
- embedding dimension d =
64
- hidden layer width =
128
- dropout rate =
0.2
- learning rate =
0.001
- batch size =
64
- number of attention heads
assumptions (4)
- domain assumption Cosine similarity between learned sensor embeddings reflects true inter-sensor process relationships.
- domain assumption A single static graph learned from training data remains valid for the test period.
- domain assumption The available sensor channels contain all relevant information needed to predict each output at 1 Hz.
- domain assumption Test samples are independent and from the same distribution as training samples.
Cite this review
Pith. "Pith review of KANS: Knowledge Discovery Graph Attention Network for Soft Sensing in Multivariate Industrial Processes." pith.science (2026). https://pith.science/paper/65ZN4EFF
@misc{pith2026250102015,
  author       = {Pith},
  title        = {Pith review of: KANS: Knowledge Discovery Graph Attention Network for Soft Sensing in Multivariate Industrial Processes},
  year         = {2026},
  howpublished = {\url{https://pith.science/paper/65ZN4EFF}},
  note         = {Machine review of arXiv:2501.02015}
}
read the original abstract
Soft sensing of hard-to-measure variables is often crucial in industrial processes. Current practices rely heavily on conventional modeling techniques that show success in improving accuracy. However, they overlook the non-linear nature, dynamics characteristics, and non-Euclidean dependencies between complex process variables. To tackle these challenges, we present a framework known as a Knowledge discovery graph Attention Network for effective Soft sensing (KANS). Unlike the existing deep learning soft sensor models, KANS can discover the intrinsic correlations and irregular relationships between the multivariate industrial processes without a predefined topology. First, an unsupervised graph structure learning method is introduced, incorporating the cosine similarity between different sensor embedding to capture the correlations between sensors. Next, we present a graph attention-based representation learning that can compute the multivariate data parallelly to enhance the model in learning complex sensor nodes and edges. To fully explore KANS, knowledge discovery analysis has also been conducted to demonstrate the interpretability of the model. Experimental results demonstrate that KANS significantly outperforms all the baselines and state-of-the-art methods in soft sensing performance. Furthermore, the analysis shows that KANS can find sensors closely related to different process variables without domain knowledge, significantly improving soft sensing accuracy.
Figures


Figures from the paper (1 more)
Reference graph
Works this paper leans on
-
[26]
Inductive representation learning on large graphs,
W. Hamilton, Z. Ying, and J. Leskovec, “Inductive representation learning on large graphs,” Advances in neural information processing systems, vol. 30, 2017
2017
-
[1]
Statistical process monitoring of a multiphase flow facility,
C. Ruiz-C ´arcel, Y . Cao, D. Mba, L. Lao, and R. Samuel, “Statistical process monitoring of a multiphase flow facility,” Control Eng. Pract., vol. 42, pp. 74–88, 2015
work page 2015
-
[2]
Z. Y . Ding, J. Y . Loo, S. G. Nurzaman, C. P. Tan, and V . M. Baskaran, “A zero-shot soft sensor modeling approach using adversarial learning for robustness against sensor fault,” IEEE Transactions on Industrial Informatics, vol. 19, no. 4, pp. 5891–5901, 2022
work page 2022
-
[3]
R. Guo, H. Liu, G. Xie, Y . Zhang, and D. Liu, “A self-interpretable soft sensor based on deep learning and multiple attention mechanism: From data selection to sensor modeling,” IEEE Transactions on Industrial Informatics, 2022
work page 2022
-
[4]
Data-driven soft sensors in the process industry,
P. Kadlec, B. Gabrys, and S. Strandt, “Data-driven soft sensors in the process industry,” Computers & chemical engineering , vol. 33, no. 4, pp. 795–814, 2009
2009
-
[5]
M. Behnasr and H. Jazayeri-Rad, “Robust data-driven soft sensor based on iteratively weighted least squares support vector regression optimized by the cuckoo optimization algorithm,” Journal of Natural Gas Science and Engineering , vol. 22, pp. 35–41, 2015
work page 2015
-
[6]
Y .-L. He, Y . Xu, and Q.-X. Zhu, “Soft-sensing model development using plsr-based dynamic extreme learning machine with an enhanced hidden layer,” Chemometrics and Intelligent Laboratory Systems , vol. 154, pp. 101–111, 2016
work page 2016
-
[7]
A data-driven soft sensor modeling method based on deep learning and its application,
W. Yan, D. Tang, and Y . Lin, “A data-driven soft sensor modeling method based on deep learning and its application,” IEEE Transactions on Industrial Electronics , vol. 64, no. 5, pp. 4237–4245, 2016
work page 2016
Show all 27 references
-
[8]
Consistent-contrastive network with temporality-awareness for robust-to-anomaly industrial soft sensor,
S. Chang, C. Zhao, and K. Li, “Consistent-contrastive network with temporality-awareness for robust-to-anomaly industrial soft sensor,” IEEE Transactions on Instrumentation and Measurement , vol. 71, pp. 1–12, 2021
2021
-
[9]
Soft sensor modeling method based on target-guided related feature learning and its application,
Z. Jiang, J. Zhu, D. Pan, H. Yu, W. Gui, and K. Zhou, “Soft sensor modeling method based on target-guided related feature learning and its application,” IEEE Transactions on Instrumentation and Measure- ment, vol. 71, pp. 1–14, 2022
2022
-
[10]
A survey on deep learning for data-driven soft sensors,
Q. Sun and Z. Ge, “A survey on deep learning for data-driven soft sensors,” IEEE Transactions on Industrial Informatics , 2021
2021
-
[11]
A comprehensive survey on graph neural networks,
Z. Wu, S. Pan, F. Chen, G. Long, C. Zhang, and S. Y . Philip, “A comprehensive survey on graph neural networks,” IEEE transactions on neural networks and learning systems , vol. 32, no. 1, pp. 4–24, 2020
2020
-
[12]
In- terpretable prediction modeling for froth flotation via stacked graph convolutional network,
Y . Wang, Q. Sui, C. Liu, K. Wang, X. Yuan, and G. Dong, “In- terpretable prediction modeling for froth flotation via stacked graph convolutional network,” IEEE Transactions on Artificial Intelligence , vol. 5, no. 1, pp. 334–345, 2023
2023
-
[13]
Knowledge-enhanced dis- tributed graph autoencoder for multiunit industrial plant-wide process monitoring,
W. Wu, C. Song, J. Zhao, and G. Wang, “Knowledge-enhanced dis- tributed graph autoencoder for multiunit industrial plant-wide process monitoring,” IEEE Transactions on Industrial Informatics , vol. 20, no. 2, pp. 1871–1883, 2023
2023
-
[14]
Reliable soft sensors with an inherent process graph constraint,
R. Zhai, J. Zheng, Z. Song, and Z. Ge, “Reliable soft sensors with an inherent process graph constraint,” IEEE Transactions on Industrial Informatics, 2024
2024
-
[15]
Deep graph net- work for process soft sensor development,
M. Jia, Y . Dai, D. Xu, T. Yang, Y . Yao, and Y . Liu, “Deep graph net- work for process soft sensor development,” in 2021 8th International Conference on Information, Cybernetics, and Computational Social Systems (ICCSS). IEEE, 2021, pp. 1–6
2021
-
[16]
Dynamic soft sensor for anaerobic digestion of kitchen waste based on sgstgat,
Y . Wang, P. Yan, and M. Gai, “Dynamic soft sensor for anaerobic digestion of kitchen waste based on sgstgat,” IEEE Sensors Journal , vol. 21, no. 17, pp. 19 198–19 208, 2021
2021
-
[17]
Multichannel diffusion graph convolutional network for the prediction of endpoint composition in the converter steelmaking process,
L. Feng, C. Zhao, Y . Li, M. Zhou, H. Qiao, and C. Fu, “Multichannel diffusion graph convolutional network for the prediction of endpoint composition in the converter steelmaking process,” IEEE Transactions on Instrumentation and Measurement , vol. 70, pp. 1–13, 2020
2020
-
[18]
A general knowledge-guided framework based on deep probabilistic network for enhancing indus- trial process modeling,
J. Wang, S. Xie, Y . Xie, and X. Chen, “A general knowledge-guided framework based on deep probabilistic network for enhancing indus- trial process modeling,” IEEE Transactions on Industrial Informatics , 2023
2023
-
[19]
Residual- aware deep attention graph convolutional network via unveiling data latent interactions for product quality prediction in industrial pro- cesses,
Y . Chen, Y . Wang, Q. Sui, X. Yuan, K. Wang, and C. Liu, “Residual- aware deep attention graph convolutional network via unveiling data latent interactions for product quality prediction in industrial pro- cesses,” Expert Systems with Applications , vol. 245, p. 123078, 2024
2024
-
[20]
Novel distributed grus based on hybrid self-attention mechanism for dynamic soft sensing,
Y .-L. He, X.-Y . Li, Y . Xu, Q.-X. Zhu, and S. Lu, “Novel distributed grus based on hybrid self-attention mechanism for dynamic soft sensing,” IEEE Transactions on Automation Science and Engineering , 2023
2023
-
[21]
Grassnet: Graph soft sensing neural networks,
Y . Huang, C. Zhang, J. Yella, S. Petrov, X. Qian, Y . Tang, X. Zhu, and S. Bom, “Grassnet: Graph soft sensing neural networks,” in 2021 IEEE Big Data . IEEE, 2021, pp. 746–756
2021
-
[22]
A benchmark case for statistical process monitoring-cranfield multiphase flow facility,
Y . Cao, “A benchmark case for statistical process monitoring-cranfield multiphase flow facility,” MATLAB File Exchange, 2015
2015
-
[23]
A hybrid mechanism-and data-driven soft sensor based on the generative adversarial network and gated recurrent unit,
R. Guo and H. Liu, “A hybrid mechanism-and data-driven soft sensor based on the generative adversarial network and gated recurrent unit,” IEEE Sensors Journal , vol. 21, no. 22, pp. 25 901–25 911, 2021
2021
-
[24]
Learning phrase representations using rnn encoder-decoder for statistical machine translation,
K. Cho, B. Van Merri ¨enboer, C. Gulcehre, D. Bahdanau, F. Bougares, H. Schwenk, and Y . Bengio, “Learning phrase representations using rnn encoder-decoder for statistical machine translation,” in 2014 EMNLP, 2014, pp. 1724–1734
2014
-
[25]
Deep learning- based feature representation and its application for soft sensor model- ing with variable-wise weighted sae,
X. Yuan, B. Huang, Y . Wang, C. Yang, and W. Gui, “Deep learning- based feature representation and its application for soft sensor model- ing with variable-wise weighted sae,” IEEE Transactions on Industrial Informatics, vol. 14, no. 7, pp. 3235–3243, 2018
2018
-
[27]
Gated stacked target-related autoencoder: A novel deep feature extraction and layerwise ensemble method for industrial soft sensor application,
Q. Sun and Z. Ge, “Gated stacked target-related autoencoder: A novel deep feature extraction and layerwise ensemble method for industrial soft sensor application,” IEEE Transactions on Cybernetics , vol. 52, no. 5, pp. 3457–3468, 2022
2022
Reviewed August 10, 2026 · model on record in the stance chip above.
Discussion (0). Continue with ORCID to comment.