REVIEW 4 major objections 4 minor 1 cited by
Experimental observation of the marginal glass phase in a colloidal glass
T0 review · 4 major / 4 minor · reviewed 2026-08-14 · deepseek-v4-flash
Pith's one-line read This paper claims that a densifying colloidal glass passes through a predicted 'marginal' phase, visible as logarithmic growth in a single tracer particle's motion.
desk verdict A clever short-time MSD assay reports the first 3D thermal colloidal marginal-glass sequence, but the central phase claim rests on one tracer's log-shaped MSD taken while the sample is still densifying. read the letter →
The pith
A machine-rendered reading of the paper's core claim, the machinery that carries it, and where it could break.
The reading
What carries the argument
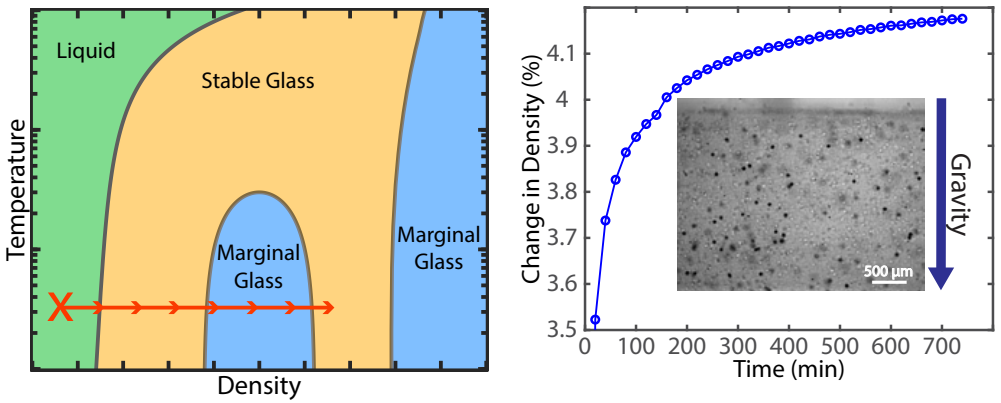
The central object is the drift-subtracted mean squared displacement of a single tracer particle, computed from 64,000-frames-per-second video and corrected for localization noise. Its shape is classified against a crossover time $\tau^*$ where the tracer first feels its neighbors: beyond $\tau^*$, a flat plateau means a smooth energy basin (stable glass), while a logarithmic law $\mathrm{MSD}(\tau) = a \log(\tau/\tau^*) + x^*$ means a basin hierarchically split into sub-basins (marginal glass). Slow gravity-driven densification sweeps the packing fraction upward by about four percent over hundreds of minutes at fixed temperature, so one continuous trajectory of MSD curves maps out successive phases. The logarithmic fit parameter $a$ is the quantitative handle on how fast the system explores the sub-basin hierarchy.
What would settle it
Track several tracer colloids in the same sedimenting sample and measure the local packing fraction around each one. If the marginal-glass claim is right, the logarithmic regime should begin for every tracer when its local density crosses the same value, and the logarithmic slope should be reproducible across tracers at matched density; if the logarithmic shape depends on the chosen tracer or on global sedimentation time rather than local density, the central claim fails. A second check is to compare a sedimenting sample with its drift subtracted using a fixed reference and with an intentionally immobilized tracer; if the logarithmic regime disappears under those controls, it was an artifact.
Extended reading notes
Core claim
The paper's central claim is that the short-time mean squared displacement (MSD) of one tracer colloid in a sedimenting colloidal glass is a phase assay, and by that assay a fixed-temperature system traverses stable glass, marginal glass, and stable glass again as density rises. At the lowest densities the MSD is ballistic at short times and sub-diffusive at long times, the liquid signal. After roughly 180 minutes of sedimentation a flat plateau appears and shrinks with increasing density; this is the smooth-basin signature of a stable glass. The plateau does not shrink to zero. Instead, from roughly 340 to 420 minutes the MSD is well fit by a logarithm growing toward the earlier plateau value, which the paper identifies with exploration of a hierarchy of sub-basins within sub-basins, the marginal phase. At the highest densities the logarithmic regime vanishes and a plateau reappears at almost the same height, the re-entrant stable glass. The paper compares this sequence to the mean-field phase diagram for soft-sphere glasses and finds agreement.
Load-bearing premise
The load-bearing premise is that a logarithmically growing mean squared displacement in one tracer particle is an unambiguous fingerprint of the marginal glass phase, rather than a product of ordinary aging, polydispersity, residual drift, or the tracer's particular local cage.
Editorial extensions
If this is right
- If the marginal phase is real in three-dimensional colloids, then the replica-theory phase diagram, including the re-entrant stable-glass branch, applies to laboratory materials rather than only to infinite-dimensional models.
- The short-time MSD protocol gives a practical assay for locating the Gardner transition: repeating the sedimentation experiment at other temperatures would map the boundaries of the marginal phase.
- The logarithmic growth observed here implies that the tracer's cage is not a smooth bowl but a nested hierarchy of barriers, so caged dynamics in dense colloids should retain long-time memory of the sub-basin structure.
- Because the re-entrant plateau appears within the same sample without a change in temperature, the stable-to-marginal-to-stable sequence is a density-driven transition, and its sharpness can be tested by measuring the logarithmic slope as a function of elapsed time.
Reading between the lines
- One extension the authors leave implicit is that the same short-time MSD protocol could be applied to many tracers simultaneously; if the Gardner interpretation is right, each tracer should enter the logarithmic regime at the same local density, and the spread of those onsets would measure the sharpness of the transition.
- A natural further test is to examine higher-order statistics, such as the non-Gaussian parameter or displacement kurtosis, over the same trajectories; a hierarchical sub-basin landscape would predict intermittent rearrangements whose statistics differ from a smooth cage.
- The protocol could be transferred to other glass formers, including emulsions or granular systems with thermalized grains, to see whether the same logarithmic regime appears whenever a glass is densified at fixed temperature.
Signed reviews
Editorial analysis
A structured set of objections, weighed in public.
Referee Report
Summary. The paper reports a single-particle tracking experiment in a sedimenting colloidal glass. The authors measure the short-time mean squared displacement (MSD) of one tracer colloid every 20 minutes and classify the MSD shape into four regimes as the sample densifies: subdiffusive liquid, stable glass (plateau), marginal glass (logarithmic growth), and reentrant stable glass (plateau). They interpret this sequence as direct experimental evidence for the marginal/Gardner glass phase predicted by replica mean-field theory and compare it qualitatively with the reentrant phase diagram for soft spheres.
Significance. If substantiated, the observation of a logarithmic MSD segment between two plateau regimes in a three-dimensional thermal colloidal glass would be a notable experimental confirmation of replica-theory predictions and would validate the short-time MSD as a probe of deep-glass phases. The experimental design has clear strengths: high-speed imaging at 64,000 fps, sub-pixel localization with a stated 1.5 nm localization error, explicit drift subtraction, and a defined free-colloid comparison for identifying the cage-onset lag time. The claim is timely and the technique is potentially powerful. However, as presented the phase assignment is underdetermined by the data: it rests on one tracer, on an unquantified goodness-of-fit criterion, and on measurements taken while the sample is still densifying. The central conclusion therefore needs substantially stronger quantitative and statistical support.
major comments (4)
- [§2, Fig. 4, Eq. (2)] The assignment of the blue MSD curves to the marginal phase rests entirely on the curves being "well fit" by the logarithmic form in Eq. (2), but the classification is not quantitative: no goodness-of-fit measure, no comparison against plateau, power-law, stretched-exponential, or aging-based functional forms, and no uncertainty in the fitted parameters a and x* is given. The problem is compounded by the fact that the sample is never at a fixed state point: Fig. 2 states that the density increases monotonically even at the longest times, so every 20-minute MSD is recorded while the glass is aging and compacting. Logarithmic MSD growth is a generic signature of slow caging, compaction, or aging in dense suspensions. To make the Gardner-phase claim load-bearing, the authors need either fixed-density control measurements or a quantitative model comparison that distinguishes hierarchical sub-basin exploration from ordinary aging.
- [§2, Figs. 4 and 5] The entire phase sequence is inferred from a single tracer particle. The paper reports no error bars on the MSD curves, no ensemble average over multiple tracer particles, no replicate MSDs at the same elapsed time, and no local volume-fraction measurement in the tracer's neighborhood. The text refers to behavior "across all samples" and to supplemental runs, but the supporting data are not shown or quantified in the main text. Because every subsequent claim about the reentrant marginal glass depends on the shape classification of these particular curves, the analysis needs to be repeated over several tracers and reported with statistical uncertainty and an explicit, quantified criterion for what constitutes a "good logarithmic fit."
- [Fig. 4 caption and §2] The time intervals defining the marginal phase are internally inconsistent: the Fig. 4 caption states that the MSD is logarithmic from 320 to 400 minutes, whereas the text says the plateau-to-logarithm transition occurs "after about 340 minute" and later "after about 380 minutes"; the reported duration of the marginal phase is "about 80 minutes" in one sentence and "an average of 165 minutes" in the next. Since the phase boundaries are defined by these intervals, a table listing elapsed time, fitted parameters, and fit-quality measures for each run is needed to remove the ambiguity.
- [§2 and Fig. 1] The comparison to the theoretical phase diagram is only qualitative and the density axis is not calibrated. Fig. 1 is a sketch adapted from Refs. [6,14], the experiment measures only a global change in density from PIV (Fig. 2), and the local packing fraction around the tracked tracer is not measured. The claim of agreement with the mean-field reentrant phase diagram would require converting the global densification curve into a local volume fraction at the tracer's position and locating the phase boundaries with uncertainties; as it stands, the comparison is an interpretation rather than a quantitative test.
minor comments (4)
- [Eq. (1)] Equation (1) has a typographical imbalance in parentheses: the expression contains an unmatched closing parenthesis after the first term. Please correct the typography.
- [Fig. 4] The color coding of the four regimes is difficult to parse in printed or grayscale versions; please add distinct line styles or markers in addition to color.
- [Introduction] The statement that "the transition from ballistic to logarithmic behavior in the MSD has never been observed" should be qualified with respect to Ref. [28], which reports Gardner-phase evidence in a quasi-two-dimensional granular system; the distinction between that prior work and the present experiment should be made explicit.
- [Data Availability] Because the entire inference rests on a single tracked trajectory, please consider depositing the raw tracked positions, the analysis scripts, and the fitted parameters in a permanent public repository rather than providing them only upon request.
Circularity Check
No significant circularity: the paper uses an external theoretical prediction (logarithmic MSD in the marginal phase) as an operational diagnostic and then reports agreement with that prediction; no fitted parameter is renamed as a prediction and no load-bearing argument reduces to the paper's own inputs.
full rationale
The paper's central claim is that a densifying colloidal glass exhibits MSD signatures consistent with the replica-theory phase sequence: sub-diffusive liquid, stable-glass plateau, marginal-glass logarithmic growth, and reentrant stable-glass plateau. The derivation chain is not circular: the replica-theory prediction of logarithmic MSD is imported from external theory (refs. 1-8, 14), not derived from the present data. The experimental analysis fits Eq. (2) (MSD = a log(tau/tau*) + x*) to certain curves, but this fit is used only as a diagnostic to classify observed behavior, not as an input that constructs the phase diagram or forces the qualitative comparison to Fig. 1. The classification criterion is clearly stated: curves that are 'well fit by a logarithm' are assigned to the marginal phase, while plateau curves are assigned to the stable phase. This is an operational test of an external prediction, not a self-derivation. The only self-citation is ref. 32, which validates the drift-subtraction and localization-error subtraction technique used to measure the MSD; this is a methodological support, not the load-bearing evidence for the marginal phase. No uniqueness theorem is imported from the authors' prior work, no ansatz is smuggled in via citation, and no known empirical pattern is merely renamed as a new result. Concerns about whether a single tracer particle or ongoing sedimentation can uniquely identify the Gardner phase are empirical underdetermination or correctness risks, not circularity under the definitions used here. Therefore the appropriate circularity score is 0.
Assumptions & free parameters
free parameters (4)
- a (logarithmic slope in Eq. 2) =
not reported
- x* (logarithmic offset) =
not reported
- tau* (crossover lag time) =
not reported
- 10% deviation threshold =
10%
assumptions (5)
- domain assumption Replica mean-field theory's mapping: stable glass gives a flat MSD plateau, while marginal/Gardner glass gives logarithmic MSD growth.
- domain assumption Sedimentation time maps monotonically to local packing fraction around the tracer, following the same path as the equilibrium phase diagram at fixed temperature.
- domain assumption A single tracer particle's drift-subtracted MSD is representative of the bulk glass phase.
- domain assumption Localization errors are independent and identically distributed and can be subtracted to resolve MSD below the nominal noise floor.
- domain assumption Soft-sphere thermal colloids can access densities above jamming, producing a reentrant stable glass.
Cite this review
Pith. "Pith review of Experimental observation of the marginal glass phase in a colloidal glass." pith.science (2026). https://pith.science/paper/6O3UEJX4
@misc{pith2026190808152,
  author       = {Pith},
  title        = {Pith review of: Experimental observation of the marginal glass phase in a colloidal glass},
  year         = {2026},
  howpublished = {\url{https://pith.science/paper/6O3UEJX4}},
  note         = {Machine review of arXiv:1908.08152}
}
read the original abstract
The replica theory of glasses predicts that in the infinite dimensional mean field limit there exist two distinct glassy phases of matter: stable glass and marginal glass. We have developed a technique to experimentally probe these phases of matter using a colloidal glass. We avoid the difficulties inherent in measuring the long time behavior of glasses by instead focusing on the very short time dynamics of the ballistic to caged transition. We track a single tracer particle within a slowly densifying glass and measure the resulting mean squared displacement (MSD). By analyzing the MSD we find that upon densification our colloidal system moves through several states of matter. At lowest densities it is a sub-diffusive liquid. Next it behaves as a stable glass, marked by the appearance of a plateau in the MSD whose magnitude shrinks with increasing density. However, this shrinking plateau does not shrink to zero, instead at higher densities the system behaves as a marginal glass, marked by logarithmic growth in the MSD towards that previous plateau value. Finally, at the highest experimental densities the system returns to the stable glass phase. This provides direct experimental evidence for the existence of a marginal glass in 3d.
Figures


Forward citations
Cited by 1 Pith paper
-
Jamming Energy Landscape is Hierarchical and Ultrametric
Nearby energy minima of 3D jammed soft-sphere packings are hierarchically clustered and approach an ultrametric metric in the thermodynamic limit, supporting Gardner physics in athermal jamming.
Reference graph
Works this paper leans on
-
[1]
The degree of polydisper- sity is chosen to frustrate crystallization
Methods Our experimental system consists of nominally 50µm diame- ter PMMA colloids (Cospheric PMPMS-1.2 45-53um> 95%) with 95% falling within a range of 45-53µm, sphericity greater than 99%, and density 1.20 g/cm3. The degree of polydisper- sity is chosen to frustrate crystallization. These colloids are suspended in a mixture of tetrahydronapthalene, dec...
-
[2]
Results and Discussion As shown in figure 4, we find a substantial change of behav- ior with increasing time and thus increasing density. The MSD of the tracer-colloid just after it has been shaken (green curves) shows ballistic motion at short times turning over to a subdiffusive motion at long times, consistent with that of a colloid in a dense liquid susp...
-
[3]
We track an indi- vidual colloid deep within the glass at short times and find the associated MSD
Conclusions We have created a colloidal glass at fixed temperature and tracked it through the liquid, stable glass, and marginal glass phases as a function of increasing density. We track an indi- vidual colloid deep within the glass at short times and find the associated MSD. This experiment lays the groundwork for a complete experimental determination of ...
-
[4]
Charbonneau P , Kurchan J, Parisi G, Urbani P , Zamponi F (2014) Fractal free energy land- scapes in structural glasses. Nature Communications 5:3725
work page 2014
-
[5]
It is striking that not only do we see individual signatures of each phase but that they combine to begin to map out a phase diagram which agrees with the theoretical predictions
-
[6]
Gardner E (1985) Spin glasses with p-spin interactions. Nuclear Physics B 257:747–765
work page 1985
-
[7]
The Journal of Chemical Physics 131(2):024504
Brito C, Wyart M (2009) Geometric interpretation of previtrification in hard sphere liquids. The Journal of Chemical Physics 131(2):024504
work page 2009
-
[8]
Parisi G, Zamponi F (2010) Mean-field theory of hard sphere glasses and jamming. Rev. Mod. Phys. 82(1):789–845
work page 2010
Show all 37 references
-
[9]
PNAS 112(47):14539–14544
Franz S, Parisi G, Urbani P , Zamponi F (2015) Universal spectrum of normal modes in low- temperature glasses. PNAS 112(47):14539–14544
2015
-
[10]
Nature Physics 12(12):1130–1133
Biroli G, Urbani P (2016) Breakdown of elasticity in amorphous solids. Nature Physics 12(12):1130–1133
2016
-
[11]
Annual Review of Condensed Matter Physics 8(1):265–288
Charbonneau P , Kurchan J, Parisi G, Urbani P , Zamponi F (2017) Glass and Jamming Transi- tions: From Exact Results to Finite-Dimensional Descriptions. Annual Review of Condensed Matter Physics 8(1):265–288
2017
-
[12]
(2019) Gardner physics in amorphous solids and beyond
Berthier L, et al. (2019) Gardner physics in amorphous solids and beyond. J. Chem. Phys. 151(1):010901
2019
-
[13]
(2015) Numerical detection of the Gardner transition in a mean-field glass former
Charbonneau P , et al. (2015) Numerical detection of the Gardner transition in a mean-field glass former. Phys. Rev. E 92(1):012316
2015
-
[14]
(2016) Growing timescales and lengthscales characterizing vibrations of amorphous solids
Berthier L, et al. (2016) Growing timescales and lengthscales characterizing vibrations of amorphous solids. PNAS 113(30):8397–8401
2016
-
[15]
Nature Communications 8:14935
Jin Y , Y oshino H (2017) Exploring the complex free-energy landscape of the simplest glass by rheology. Nature Communications 8:14935
2017
-
[16]
Hicks C, Wheatley M, Godfrey M, Moore M (2018) Gardner Transition in Physical Dimensions. Phys. Rev. Lett. 120(22):225501
2018
-
[17]
Soft Matter 14(25):5222–5234
Seoane B, Zamponi F (2018) Spin-glass-like aging in colloidal and granular glasses. Soft Matter 14(25):5222–5234
2018
-
[18]
Scalliet C, Berthier L, Zamponi F (2019) Marginally stable phases in mean-field structural glasses. Phys. Rev. E 99(1):012107
2019
-
[19]
Physical Review Letters 59(18):2083–2086
Pusey PN, van Megen W (1987) Observation of a glass transition in suspensions of spherical colloidal particles. Physical Review Letters 59(18):2083–2086
1987
-
[20]
Physical Review Letters 75(14):2770–2773
Mason TG, Weitz DA (1995) Linear Viscoelasticity of Colloidal Hard Sphere Suspensions near the Glass Transition. Physical Review Letters 75(14):2770–2773
1995
-
[21]
Physical Review E 58(5):6073–6085
van Megen W, Mortensen TC, Williams SR, Müller J (1998) Measurement of the self- intermediate scattering function of suspensions of hard spherical particles near the glass transition. Physical Review E 58(5):6073–6085
1998
-
[22]
Weeks ER, Crocker JC, Levitt AC, Schofield A, Weitz DA (2000) Three-Dimensional Direct Imaging of Structural Relaxation Near the Colloidal Glass Transition.Science 287(5453):627– 631
2000
-
[23]
Science 287(5451):290–293
Kegel WK, Blaaderen aAv (2000) Direct Observation of Dynamical Heterogeneities in Col- loidal Hard-Sphere Suspensions. Science 287(5451):290–293
2000
-
[24]
Chemical Physics 284(1):361–367
Weeks ER, Weitz DA (2002) Subdiffusion and the cage effect studied near the colloidal glass transition. Chemical Physics 284(1):361–367
2002
-
[25]
The Journal of Chemical Physics 125(7):074716
Kaufman LJ, Weitz DA (2006) Direct imaging of repulsive and attractive colloidal glasses. The Journal of Chemical Physics 125(7):074716
2006
-
[26]
Reports on Progress in Physics 75(6):066501
Hunter GL, Weeks ER (2012) The physics of the colloidal glass transition. Reports on Progress in Physics 75(6):066501
2012
-
[27]
Proceedings of the National Academy of Sciences 116(16):7766–7771
Kim HS, ¸ Senbil N, Zhang C, Scheffold F , Mason TG (2019) Diffusing wave microrheology of highly scattering concentrated monodisperse emulsions. Proceedings of the National Academy of Sciences 116(16):7766–7771
2019
-
[28]
Hentschel HGE, Karmakar S, Lerner E, Procaccia I (2011) Do athermal amorphous solids exist? Phys. Rev. E 83(6):061101
2011
-
[29]
Procaccia I, Rainone C, Shor CABZ, Singh M (2016) Breakdown of nonlinear elasticity in amorphous solids at finite temperatures. Phys. Rev. E 93(6):063003
2016
-
[30]
Rainone C, Urbani P (2016) Following the evolution of glassy states under external perturba- tions: the full replica symmetry breaking solution. J. Stat. Mech. 2016(5):053302
2016
-
[31]
Scalliet C, Berthier L, Zamponi F (2017) Absence of Marginal Stability in a Structural Glass. Phys. Rev. Lett. 119(20):205501
2017
-
[32]
Seguin A, Dauchot O (2016) Experimental Evidence of the Gardner Phase in a Granular Glass. Phys. Rev. Lett. 117(22):228001
2016
-
[33]
Geirhos K, Lunkenheimer P , Loidl A (2018) Johari-Goldstein Relaxation Far Below ${T}_{g}$: Experimental Evidence for the Gardner Transition in Structural Glasses? Physical Review Letters 120(8):085705
2018
-
[34]
Journal of Open Research Software 2(1):e30
Thielicke W, Stamhuis E (2014) PIVlab – Towards User-friendly, Affordable and Accurate Digital Particle Image Velocimetry in MATLAB. Journal of Open Research Software 2(1):e30
2014
-
[35]
Nat Meth 9(7):724–726
Parthasarathy R (2012) Rapid, accurate particle tracking by calculation of radial symmetry centers. Nat Meth 9(7):724–726
2012
-
[36]
Hammond AP , Corwin EI (2017) Direct measurement of the ballistic motion of a freely floating colloid in Newtonian and viscoelastic fluids. Phys. Rev. E 96(4):042606
2017
-
[37]
Physical Review A 46(4):1942–1950
Clercx HJH, Schram PPJM (1992) Brownian particles in shear flow and harmonic potentials: A study of long-time tails. Physical Review A 46(4):1942–1950. Hammond et al. PNAS | February 4, 2020 | vol. XXX | no. XX | 5
1992
Reviewed August 14, 2026 · model on record in the stance chip above.
Discussion (0). Continue with ORCID to comment.