REVIEW 3 major objections 5 minor 16 references
ArtChart proves artistic charts can keep their numbers, text, and label placement exact while being stylized.
Reviewed by Pith at T0; open to challenge. T0 means a machine referee read the full paper against a public rubric. the ladder, T0–T4 →
2026-08-01 21:27 UTC pith:76E6P5WD
load-bearing objection A genuinely useful benchmark and task definition for artistic chart generation, but the headline superiority claim is weakened by reward-metric circularity and a missing human evaluation. the 3 major comments →
ArtChart: A Benchmark for Faithful Artistic Chart Generation with Integrated Text Rendering
The pith
A machine-rendered reading of the paper's core claim, the machinery that carries it, and where it could break.
Core claim
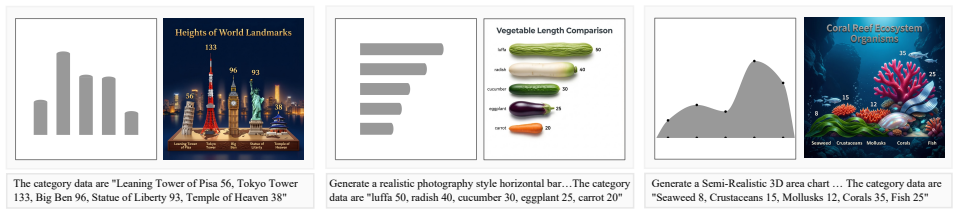
The central claim is that a chart-specific ControlNet conditioned on a text-free grayscale chart—rendered by deterministic code to encode bar heights, sector angles, or area shapes—can supply the structural grounding that generic text-to-image and editing pipelines lack, and that this grounding can be preserved through later alignment stages. After freezing that controller, the paper trains a DiT LoRA with Flow-GRPO using two text rewards (Hungarian-matched OCR edit distance and VLM slot-checked label position), then an aesthetic expert, and finally distills the three single-reward experts into one student via on-policy distillation so the model approaches all three performance ceilings at o
What carries the argument
The load-bearing object is the text-free grayscale chart G, generated deterministically from the data; it is what lets the model separate geometry from style and text. Around it, the paper builds three components: a chart-specific ControlNet branch (trained with a flow-velocity loss on 13K filtered triples) that maps G into the generation; a Flow-GRPO alignment stage with three rewards—R_ocr (Hungarian-matched normalized edit distance), R_layout (VLM slot correctness), and R_aes (PickScore)—with advantages normalized over groups; and a multi-expert distillation (OPD) that converts teacher velocity fields into a dense KL loss (Eq. 7) so a single student LoRA inherits text, layout, and aesthet
Load-bearing premise
The entire pipeline and its reported scores rest on the assumption that the OCR recognizer and the VLM layout/styling judges measure what a human reader would call a faithful, readable, correctly labeled chart; the paper concedes these judges 'may introduce evaluator bias' and reports no human data to anchor them.
What would settle it
Take a prompt from ArtChart-Bench, generate outputs with ArtChart and with the strongest baseline, then ask a set of human readers to (a) recalculate the ratios by eye and (b) detect swapped category-value pairs. If the humans' error counts do not track the MathLogic and LayoutPos scores, those axes are not measuring chart faithfulness, and the claimed gap over baselines collapses to a preference of the benchmark's own judges.
If this is right
- If the claims hold, automated tools can produce publication-ready artistic charts for infographics, editorials, and presentations, removing the manual repair step that currently follows generative stylization.
- The six-axis protocol gives practitioners a shared ruler to compare T2I, editing, and ControlNet methods on the same prompt-to-image task, isolating failures to geometry, text, layout, aesthetics, instruction, or readability.
- The decoupling of geometry (grayscale condition) from text/style (LoRA) implies a modular upgrade path: one can improve text rendering or aesthetics without re-solving the math-control problem.
- The OPD result suggests that multi-reward interference in text-to-image alignment can be systematically resolved by training single-reward experts and distilling them along on-policy trajectories, not just weighted reward sums.
Where Pith is reading between the lines
- The paper's own caveat—OCR and VLM judges may introduce evaluator bias—cuts deeper than the authors state: if those same judges were used for training rewards and for the reported evaluation, a model could overfit the judges rather than human chart comprehension. A human-subject validation of the six scores on a sample of ArtChart-Bench would be the decisive follow-up.
- ArtChart's dependence on an explicit grayscale condition leaves open whether an end-to-end text-to-artistic-chart model can learn implicit geometry; a fair test would be a pure-T2I variant trained only on the prompt-specification, not the image condition.
- The benchmark's diagnostic tags (value pattern, label format, style family, difficulty) make it plausible to use as a testbed for studying when text/layout errors occur—for instance, whether long labels or tiny values drive the remaining TextAcc and Readability gaps.
- Extending the benchmark to multi-series, stacked, grouped, or scatter charts would stress whether the grayscale-conditioning trick generalizes beyond one-dimensional categorical data, which the paper itself lists as future work.
Editorial analysis
A structured set of objections, weighed in public.
Referee Report
Summary. The paper defines artistic chart generation with integrated text rendering as a task, and contributes a bilingual 2K-prompt benchmark (ArtChart-Bench), a six-axis automated evaluation suite (ArtChart-Eval), and a three-stage method (chart-specific ControlNet, Flow-GRPO with OCR/layout/aesthetic rewards, and multi-expert distillation). The main empirical claim, stated in the abstract and supported by Table 3, is that ArtChart consistently outperforms open-source T2I, editing, and ControlNet baselines on all six axes, producing charts that are both visually appealing and mathematically faithful. The claim rests entirely on automated OCR/VLM judgments.
Significance. The task and benchmark are timely and the benchmark design has real strengths: controlled value distributions, diagnostic metadata, a failure taxonomy, and a unified protocol for heterogeneous generators. The modular method — explicit grayscale geometric control, RL refinement, and expert distillation — is a sensible and potentially reusable recipe. However, the reader's circularity concern is valid and lands: three of the six evaluation axes are nearly identical to the training rewards, and the paper's promised human preference evaluation is absent. If the automated judges are valid proxies, this is a strong contribution; the manuscript does not yet establish that validity, so the central comparative claim is currently unsupported.
major comments (3)
- [Evaluation Protocol vs. Method (Eqs. 5, 6, 10–12; §Method, §Evaluation)] The evaluation is circular for three of the six axes. TextAcc (Eqs. 10–11) uses OCR plus normalized-edit-distance matching, essentially the same machinery as the OCR reward R_ocr in Eq. 5. LayoutPos (Eq. 12) is literally the same slot-count score as R_lay in Eq. 6. Aesthetic uses PickScore, which is also the aesthetic reward R_aes. Since ArtChart is RL-optimized against these rewards while the baselines are not, the Table 3 margins (e.g., Layout 7.67 vs. 5.17) may reflect reward overfitting rather than human-meaningful chart faithfulness. The paper itself concedes in Discussion and Limitations that 'OCR and VLM judges may introduce evaluator bias'. This is load-bearing for the abstract claim and must be addressed with external validation.
- [Contributions and Experiments] The contribution list states 'plus human preference evaluation', but no human evaluation results appear anywhere in the manuscript. Given that all six reported scores come from automated OCR/VLM/preference-model judges, and that those judges overlap with the training rewards, a human study is not optional: it is the only evidence that the automated metrics track human judgment of text correctness, label binding, readability, and aesthetics. Without it, the gap in Table 3 cannot be interpreted as 'visually appealing and mathematically faithful'. Please add a human evaluation with inter-annotator agreement and a comparison between human judgments and ArtChart-Eval scores.
- [Tables 3–6] All quantitative results are point estimates with no error bars, no number of seeds, no per-run variance, and no significance tests. Both generation and the VLM/OCR judges are stochastic, so differences such as TextAcc 9.54 vs. 9.16 or Aesthetic 7.61 vs. 7.26 may be within noise, and the 7.67 vs. 5.17 layout gap may not be as large as it appears if the scoring function is unstable. Please report mean ± std over multiple runs/random seeds and, where appropriate, paired significance tests.
minor comments (5)
- [Inference] The Inference subsection introduces 'an LLM prompt expansion module' that is not described in the Method. Please either describe it or point to a specific section/reference.
- [Table 4 caption] Table 3 is described as a 'Chinese+English weighted average'; Table 4 reports per-chart-type results but it is unclear whether these are averaged across languages or reported for English only. Clarify.
- [Eq. (2) and GRPO objective] The SDE notation and the likelihood-ratio term ρ_i are compressed. Add a derivation of the transition density or an explicit reference to Flow-GRPO for readers.
- [Method] The sentence 'We use two text rewards' is slightly misleading because the RL stage also uses an aesthetic reward. Consider rephrasing as 'two text-related rewards, plus an aesthetic reward'.
- [Table 3 comparison setup] The comparison to prompt-only T2I and editing baselines is confounded by the fact that ArtChart receives the text-free grayscale condition, which encodes the answer geometry. The authors should state clearly that ArtChart's input protocol includes this extra structural signal, and ideally report an ablation without the grayscale condition.
Circularity Check
ArtChart's reported superiority on Text Accuracy, Layout, and Aesthetics is partly circular: those evaluation metrics are the same functions used as RL training rewards, with no human evaluation validating the proxies.
specific steps
-
fitted input called prediction
[Method, Eq. (5) vs. Evaluation Protocol, Eq. (10)-(11)]
"The OCR reward extracts text from I and matches it to the target title, categories, values, and units with Hungarian matching under normalized edit distance: Rocr(x0,c) = ... Here T is the target text set, P is the OCR-detected text set, and M is the Hungarian matching. ... Let G={g_i} denote the ground-truth text units ... and let P={p_j} denote the OCR-recognized text units. For each pair, we compute normalized edit similarity: sim(g_i,p_j) = 1 - ED(g_i,p_j)/max(|g_i|,|p_j|) ... We perform maximum-weight bipartite matching and keep matches above a threshold γ. The final score is a 10-point s"
TextAcc uses the same OCR-extraction + normalized-edit-distance bipartite matching protocol that the GRPO policy is trained to maximize via Rocr. A model optimized on Rocr will, by construction, score high on TextAcc; the evaluation is not an independent test of text fidelity. Because the baselines were not trained with this reward, the TextAcc gap in Table 3 is substantially a direct consequence of optimizing the evaluation function itself, not independent evidence of general chart-text ability.
-
fitted input called prediction
[Method, Eq. (6) vs. Evaluation Protocol, Eq. (12)]
"The layout reward checks semantic attachment. Each data point contributes two slots, category and value. A VLM judges whether each slot has correct content and correct position/order, giving Rlay(x0,c) = #correct slots / 2n. ... A VLM checks each category and value label, and a text slot is counted as correct only if its content matches the reference and its position follows the expected chart order: Slayout = #correct text slots / 2n × 10."
LayoutPos is the identical slot-checking protocol used as the layout reward Rlay: a VLM judges whether each category/value slot has correct content and correct position/order, and both are normalized by 2n. The model's LoRA expert is trained with Flow-GRPO to maximize Rlay, so the reported LayoutPos score measures the training objective itself. The large gain over baselines (7.67 vs. 5.17) is therefore an expected artifact of optimizing the evaluation metric, not an independent confirmation of label-value binding quality.
-
fitted input called prediction
[Method, Multi-Expert Distillation vs. Evaluation Protocol, Aesthetic]
"We train a third Flow-GRPO expert with PickScore reward Raes = PickScore(I,P). ... Aesthetic quality uses PickScore, with VLM style consistency as auxiliary verification."
The aesthetic evaluation criterion is the very PickScore function used as a training reward for the aesthetic expert and, through OPD distillation, for the final ArtChart model. Maximizing PickScore during training and then reporting PickScore as the Aesthetic metric means the score is optimized directly; it cannot independently establish that the charts are visually appealing to humans, especially since the paper provides no human preference results despite listing 'plus human preference evaluation' as a contribution.
full rationale
The central empirical claim—that ArtChart 'consistently outperforms open-source baselines, producing charts that are both visually appealing and mathematically faithful'—rests on Table 3. Three of the six evaluation axes are nearly identical to the paper's own RL training rewards: TextAcc (Eq. 10-11) is the same OCR + edit-distance matching objective as Rocr (Eq. 5); LayoutPos (Eq. 12) is the same VLM slot-checking protocol as Rlay (Eq. 6); and Aesthetic uses PickScore, which is also Raes. Thus the model is directly optimized against the benchmark metrics, while the baselines are not. The paper itself concedes the validity of these proxies is unverified: 'OCR and VLM judges may introduce evaluator bias' (Discussion and Limitations), and although the contributions promise 'plus human preference evaluation,' no human evaluation results appear anywhere in the manuscript. The load-bearing assumption—that the automated OCR/VLM/PickScore judges track human judgments of text correctness, label binding, layout, readability, and aesthetics—is unsupported. This is partial circularity: it affects three of the six reported axes and directly undermines the claims of text faithfulness, label binding, and visual appeal, though MathLogic, Instruction Following, and Readability are not identical to training rewards and retain some independent content. The appropriate score is 7 rather than 6 because the circular axes are central to the paper's headline claims and because the missing human validation makes the train/eval identity not merely formal but load-bearing.
Axiom & Free-Parameter Ledger
free parameters (6)
- SDE noise scale a =
0.7
- GRPO KL weight β and clipping ϵ =
β=5e-3, ϵ=1e-4
- MathLogic thresholds τ, ϵ =
τ=0.05, ϵ=0.45
- OCR matching threshold γ =
not reported
- LoRA rank and alpha =
rank=32, alpha=64
- RL group sizes =
16 for text/layout, 24 for OPD
axioms (5)
- domain assumption Text-free grayscale chart G is a sufficient, unambiguous encoding of target geometry for bar, hbar, pie, and area charts.
- domain assumption OCR and VLM outputs are valid proxies for text correctness, label binding, readability, and instruction following.
- domain assumption Teacher images I* from GPT-Image/Nano, after filtering, are high-quality ground truth without systematic teacher-specific bias.
- standard math Flow-GRPO's SDE conversion (Eq. 2) and Flow-OPD's dense velocity distillation (Eq. 7) are valid for this flow-matching backbone.
- domain assumption PickScore is a valid measure of aesthetic quality for artistic charts.
Cite this review
Pith. "Pith review of ArtChart: A Benchmark for Faithful Artistic Chart Generation with Integrated Text Rendering." pith.science (2026). https://pith.science/paper/76E6P5WD
@misc{pith2026260716060,
  author       = {Pith},
  title        = {Pith review of: ArtChart: A Benchmark for Faithful Artistic Chart Generation with Integrated Text Rendering},
  year         = {2026},
  howpublished = {\url{https://pith.science/paper/76E6P5WD}},
  note         = {Machine review of arXiv:2607.16060}
}
read the original abstract
Artistic charts make data memorable and visually engaging, but generating them faithfully demands simultaneously preserving numerical geometry, rendering exact in-image text, binding labels to correct marks, and maintaining coherent artistic style. Current text-to-image and image editing models frequently fail on these coupled constraints, producing distorted geometries, hallucinated text, misbound labels, or over-stylized marks that undermine readability and mathematical integrity. This paper introduces ArtChart, a framework for artistic chart generation with integrated text rendering, encompassing a task definition, benchmark, and evaluation protocol. This is the first work to simultaneously address mathematically faithful chart synthesis, accurate in-image text rendering, and artistic stylization of chart elements. ArtChart features a chart-specific plug-and-play module conditioned on text-free grayscale chart layouts, ensuring mathematical and logical fidelity. A RL learning strategy with OCR accuracy, layout quality, and aesthetic rewards refines generation, while a multi-expert distillation framework resolves inter-reward conflicts through specialized expert optimization. We construct ArtChart-Bench, a bilingual 2K-prompt benchmark spanning four chart types and diverse label formats. We further design ArtChart-Eval, a six-axis evaluation suite covering mathematical logic, text accuracy, text layout, aesthetics, instruction following, and readability, supporting comparison across T2I, image-editing, controllable-generation, and closed-source API models. Extensive experiments demonstrate that ArtChart consistently outperforms open-source baselines, producing charts that are both visually appealing and math faithful.
Figures


Reference graph
Works this paper leans on
-
[1]
Computing in Science & Engineering, 9(3): 90–95
Hunter,J.D.2007.Matplotlib:A2DGraphicsEnvironment. Computing in Science & Engineering, 9(3): 90–95. Bostock, M.; Ogievetsky, V.; and Heer, J
2007
-
[5]
ShowTable: Unlocking Creative Table Visualization with Collaborative Reflection and Refinement. arXiv:2512.13303. Tang,Y.;Liu,X.;Zhang,B.;Lan,T.;Xie,Y.;Lao,J.;Wang, Y.; Li, H.; Gao, T.; Pan, B.; Weng, L.; Huang, X.; Zhu, M.; Feng, Y.; Luo, Y.; and Chen, W
-
[6]
IGenBench: Bench- marking the Reliability of Text-to-Infographic Generation. arXiv:2601.04498. Xiao, S.; Huang, S.; Lin, Y.; Ye, Y.; and Zeng, W
-
[8]
ChartEditor: A Human-AI Paired Tool for Authoring Picto- rial Charts. arXiv:2501.07320. Liu,R.;Garrette,D.;Saharia,C.;Chan,W.;Roberts,A.;and Lee, K
-
[9]
Glyph-ByT5: A Customized Text Encoder for Accurate Visual Text Rendering. arXiv:2403.09622. Tuo, Y.; Xiang, W.; He, J.-Y.; Geng, Y.; and Xie, X
-
[10]
AnyText: Multilingual Visual Text Generation and Editing. arXiv:2404.14249. Chen, J.; Huang, Y.; Lv, T.; Cui, L.; Chen, Q.; and Wei, F
-
[11]
TextDiffuser-2: Unleashing the Power of Language Models for Text Rendering. arXiv:2311.16465. Liu, X.; Tang, Y.; Huang, X.; Luo, Y.; and Chen, W
-
[12]
EasyText: Controllable Diffusion Transformer for Multilin- gual Text Rendering. arXiv:2505.24417. Zhu, H.; Liu, Y.; Wu, X.; Wang, A.-L.; Feng, H.; Yang, D.; Feng,C.;Huang,C.;Tang,J.;andBai,X.2026.TextPecker: RewardingStructuralAnomalyQuantificationforEnhancing Visual Text Rendering. arXiv:2602.20903. Cui, M.; Yang, J.; Ji, F.; Jiang, Q.; Shi, Z.; Wang, J....
arXiv 2026
-
[13]
TextAlign: Preference Alignment for Text Rendering with Hierarchical Rewards. arXiv:2605.19320. Liu, J.; Liu, G.; Liang, J.; Li, Y.; and Liu, J
-
[14]
Flow- GRPO: Training Flow Matching Models via Online Rein- forcement Learning. arXiv:2505.05470. Fan, Y.; Wang, Q.; Huang, Y.; Liu, J.; Miyazaki, T.; and Omachi,S.2026.POCA:Pareto-OptimalCurriculumAlign- ment for Visual Text Generation. arXiv:2604.24171. Fang, Z.; Huang, W.; Zeng, Y.; Zhao, Y.; Chen, S.; Feng, K.; Lin, Y.; Chen, L.; Chen, Z.; Cao, S.; and Zhao, F
Pith/arXiv arXiv 2026
-
[15]
Flow-OPD: On-Policy Distillation for Flow Matching Mod- els. arXiv:2605.08063. Kirstain, Y.; Polyak, A.; Singer, U.; Matiana, S.; Penna, J.; and Levy, O
-
[2022]
ChartQA: A Benchmark for Question Answering about Charts with Visual and Logical Reasoning. In ACL Findings. Yang,Z.;Li,Y.;Wang,J.;andChen,W.2024.MatplotBench: Evaluating Multimodal Models on Scientific Plot Genera- tion. arXiv:2407.00981
Pith/arXiv arXiv 2024
-
[2023]
viz2viz: Prompt- Driven Stylized Visualization Generation Using a Diffusion Model. arXiv:2304.01919. Yan, S.; Liu, T.; Yang, W.; Tang, N.; and Luo, Y
-
[2024]
Con- trolNet++: Improving Conditional Controls with Efficient Consistency Feedback. arXiv:2404.07987. Black, K.; Janner, M.; Du, Y.; Kostrikov, I.; and Levine, S. 2024.TrainingDiffusionModelswithReinforcementLearn- ing. In ICLR. Fan, Y.; Watkins, O.; Du, Y.; Liu, H.; Ryu, M.; Boutilier, C.; Abbeel, P.; Ghavamzadeh, M.; Lee, K.; and Lee, K. 2024.DPOK:Reinf...
Pith/arXiv arXiv 2024
- [2025]
-
[2026]
ERNIE-Image Technical Report. arXiv:2605.25347. Xiao,S.;Zhou,T.;Laidlaw,D.H.;andChan,G.Y.-Y.2026. ChArtist: Generating Pictorial Charts with Unified Spatial and Subject Control. In CVPR. Sun, Z.; Zhang, Y.; Gu, Z.; Lu, M.; Lee, B.; Cohen-Or, D.; and Huang, H
Pith/arXiv arXiv 2026
This paper was first reviewed by deepseek-v4-flash on August 1, 2026.
discussion (0)
Sign in with ORCID, Apple, or X to comment. Anyone can read and Pith papers without signing in.