Beyond Explained Variance: A Cautionary Tale of PCA
Pith reviewed 2026-05-20 21:14 UTC · model grok-4.3
The pith
PCA scatterplots can falsely indicate clusters in data that actually forms a ring-like manifold.
A machine-rendered reading of the paper's core claim, the machinery that carries it, and where it could break.
Core claim
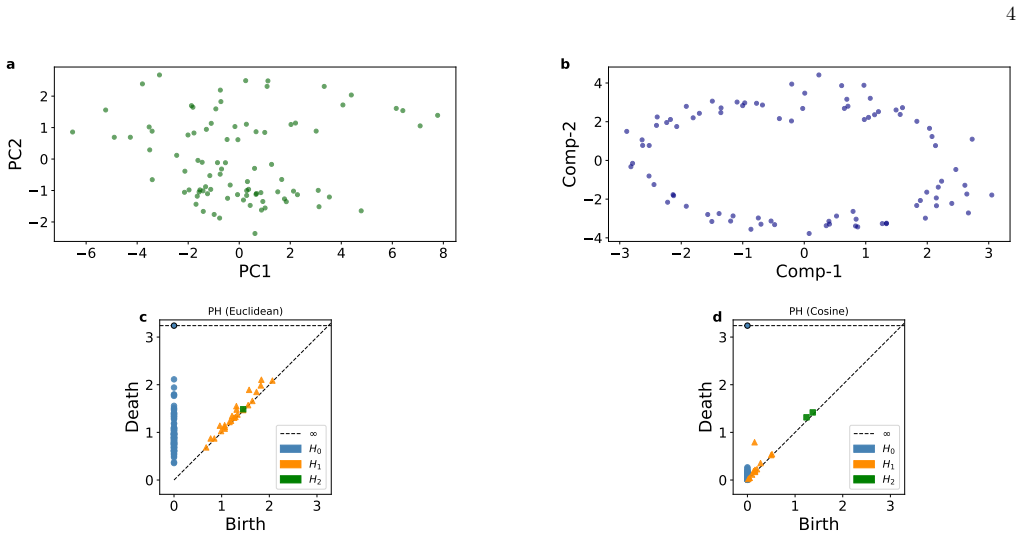
For the Kuehneotherium fossil teeth data, PCA produces an apparent clustering in the region of negative PC2, whereas t-SNE and persistent homology recover a single ring of intrinsic dimension one; a generative model that samples points uniformly from the unit circle reproduces the observed U-shaped distribution of pairwise cosine distances.
What carries the argument
The generative probabilistic-geometric model of uniform sampling from a unit circle, which directly yields the arcsine distribution for pairwise cosine distances.
If this is right
- PCA scatterplots alone are insufficient for revealing the geometry of data on nonlinear manifolds such as circles.
- Manifold-aware methods like t-SNE combined with topological tools can expose ring structures and low intrinsic dimension where PCA suggests clusters.
- The arcsine law for cosine distances offers a simple, model-based check on whether data lie on a circular manifold.
Where Pith is reading between the lines
- The same caution about PCA may apply to other biological or morphological datasets that are suspected to vary continuously around a closed shape.
- Distance-distribution diagnostics could be added to standard pipelines to flag when a circular or periodic embedding is plausible before visualization.
- Persistent homology loops detected in the data could be tested against the specific persistence diagram expected from uniform sampling on a circle.
Load-bearing premise
The fossil teeth data can be treated as points sampled uniformly from a circle in an appropriate embedding space.
What would settle it
A statistical test showing that the empirical distribution of pairwise cosine distances deviates significantly from the arcsine law predicted by uniform circle sampling.
Figures

read the original abstract
We address shortcomings of principal component analysis (PCA) for visualizing high-dimensional data lying on a nonlinear low-dimensional manifold via two-dimensional scatterplots, focusing on a fossil teeth dataset from the early mammalian insectivore Kuehneotherium. While the PCA scatterplot reported by Jolliffe and Cadima (Philosophical Transactions of the Royal Society A, 2016) shows clustering in the region where PC2 < 0, our analysis based on t-SNE and persistent homology (PH) reveals a ring-like structure with no evident clustering and intrinsic dimensionality equal to one. We further propose a generative probabilistic-geometric model in which the data are sampled uniformly from a unit circle. Under this model, pairwise cosine distances follow an arcsine distribution, in qualitative agreement with the observed U-shaped distribution, thereby independently supporting the analysis based on t-SNE and persistent homology.
Editorial analysis
A structured set of objections, weighed in public.
Referee Report
Summary. The paper claims that PCA can mislead when visualizing high-dimensional data on nonlinear manifolds, using a fossil teeth dataset from Kuehneotherium. While PCA scatterplots from Jolliffe and Cadima (2016) suggest clustering where PC2 < 0, t-SNE and persistent homology reveal a ring-like structure with no clustering and intrinsic dimension 1. The authors introduce a generative model of uniform sampling from a unit circle, under which pairwise cosine distances follow an arcsine distribution that qualitatively matches the observed U-shaped distribution and independently supports the topological findings.
Significance. If the ring structure and geometric model are confirmed, this provides a concrete cautionary example of PCA limitations for manifold data in statistical mechanics and paleobiology. The integration of t-SNE, persistent homology, and a probabilistic-geometric model is a strength, offering a template for interpreting distance distributions beyond linear variance explained.
major comments (3)
- Abstract: the statement that the arcsine distribution 'independently supports' the t-SNE/PH analysis is undercut by the fact that the generative model is constructed from the observed ring structure; without separate verification of uniform angular sampling in the embedding space, the support is not independent.
- Generative probabilistic-geometric model: the derivation of the arcsine distribution for cosine distances assumes uniform sampling from a unit circle, but no quantitative test (e.g., Rayleigh test for uniformity or KS statistic against empirical distances) is provided to check conformity of the fossil teeth data to this geometry.
- t-SNE and persistent homology sections: the claims of ring-like structure and intrinsic dimensionality equal to one rest on visual inspection of outputs without reported quantitative metrics such as persistence diagram summaries, stability across hyperparameters, or error bars.
minor comments (2)
- Figure captions for t-SNE and PH plots should explicitly note the parameters (e.g., perplexity, homology dimension) used to identify the ring and dimension-1 features.
- The reference to the original PCA application could be expanded with the exact dataset size or preprocessing steps to allow direct reproduction of the clustering observation.
Simulated Author's Rebuttal
We thank the referee for their constructive and detailed comments on our manuscript. We have carefully reviewed each major comment and provide point-by-point responses below, indicating where revisions will be made to address the concerns raised.
read point-by-point responses
-
Referee: Abstract: the statement that the arcsine distribution 'independently supports' the t-SNE/PH analysis is undercut by the fact that the generative model is constructed from the observed ring structure; without separate verification of uniform angular sampling in the embedding space, the support is not independent.
Authors: We agree that the phrasing 'independently supports' may suggest a stronger separation than is warranted, given that the generative model is motivated by the ring structure observed in the t-SNE and persistent homology results. The arcsine distribution offers a geometric and probabilistic explanation consistent with the topological findings, but it does not provide fully independent verification without additional checks on angular uniformity. We will revise the abstract to remove 'independently' and instead describe the model as providing 'further geometric support consistent with' the t-SNE and PH analysis. revision: yes
-
Referee: Generative probabilistic-geometric model: the derivation of the arcsine distribution for cosine distances assumes uniform sampling from a unit circle, but no quantitative test (e.g., Rayleigh test for uniformity or KS statistic against empirical distances) is provided to check conformity of the fossil teeth data to this geometry.
Authors: The referee correctly notes the absence of quantitative goodness-of-fit or uniformity tests in the current manuscript. Although the qualitative match between the theoretical arcsine distribution and the empirical U-shaped histogram is evident, formal statistical validation would increase rigor. In the revision we will add a Kolmogorov-Smirnov test comparing the observed cosine distances to the arcsine distribution and report the test statistic and p-value. We will also discuss the feasibility of estimating angular coordinates from the embedding to perform a uniformity test such as the Rayleigh test. revision: yes
-
Referee: t-SNE and persistent homology sections: the claims of ring-like structure and intrinsic dimensionality equal to one rest on visual inspection of outputs without reported quantitative metrics such as persistence diagram summaries, stability across hyperparameters, or error bars.
Authors: We acknowledge that the current presentation relies primarily on visual assessment of the t-SNE plots and persistence diagrams. To address this, the revised manuscript will include quantitative summaries of the persistence diagrams (such as the lifespan of the dominant H1 feature), results demonstrating stability of the ring structure across a range of t-SNE hyperparameters (e.g., perplexity values), and any available measures of variability or bootstrap-based assessments supporting the intrinsic dimension of one. revision: yes
Circularity Check
No significant circularity detected; derivation chain is self-contained
full rationale
The paper identifies a ring-like structure and intrinsic dimension one via t-SNE and persistent homology on the fossil teeth data. It then proposes a generative model of uniform sampling from a unit circle and derives the arcsine distribution for pairwise cosine distances as a mathematical consequence. This distribution is noted to qualitatively match the observed U-shaped pattern in the data. No step reduces by construction to its inputs: the geometric model is not defined using the distance distribution, the arcsine result follows from standard geometry rather than a fit, and the match serves as an external consistency check rather than a renamed input. No self-citations, uniqueness theorems, or smuggled ansatzes appear in the provided text. The central claims rest on independent visualization and topological methods plus a derived geometric implication, satisfying the criteria for a non-circular analysis.
Axiom & Free-Parameter Ledger
axioms (1)
- domain assumption High-dimensional data lies on a nonlinear low-dimensional manifold
invented entities (1)
-
Generative model of uniform sampling from a unit circle
no independent evidence
Lean theorems connected to this paper
-
IndisputableMonolith/Foundation/AlexanderDuality.leanalexander_duality_circle_linking unclear?
unclearRelation between the paper passage and the cited Recognition theorem.
We further propose a generative probabilistic-geometric model in which the data are sampled uniformly from a unit circle. Under this model, pairwise cosine distances follow an arcsine distribution
-
IndisputableMonolith/Foundation/AlexanderDuality.leanD3_admits_circle_linking unclear?
unclearRelation between the paper passage and the cited Recognition theorem.
persistent homology (PH) diagrams... indicate the presence of a loop
What do these tags mean?
- matches
- The paper's claim is directly supported by a theorem in the formal canon.
- supports
- The theorem supports part of the paper's argument, but the paper may add assumptions or extra steps.
- extends
- The paper goes beyond the formal theorem; the theorem is a base layer rather than the whole result.
- uses
- The paper appears to rely on the theorem as machinery.
- contradicts
- The paper's claim conflicts with a theorem or certificate in the canon.
- unclear
- Pith found a possible connection, but the passage is too broad, indirect, or ambiguous to say the theorem truly supports the claim.
Reference graph
Works this paper leans on
-
[1]
To this end, various heuristics exist
Estimating Intrinsic Dimensionality using PCA Within PCA, the methods for estimating the intrin- sic (or effective) dimension, which, in this context, cor- responds to deciding how many principal components (PCs) to keep. To this end, various heuristics exist. In this work, we shall consider the following ones: Kaiser criterion (also known as the Kaiser-G...
work page 2004
-
[2]
Pearson, Philosophical Magazine Series 12, 559 (1901)
K. Pearson, Philosophical Magazine Series 12, 559 (1901)
work page 1901
-
[3]
Hotelling, Journal of Educational Psychology24, 498 (1933)
H. Hotelling, Journal of Educational Psychology24, 498 (1933)
work page 1933
-
[4]
I. T. Jolliffe,Principal Component Analysis, Springer Series in Statistics (Springer, New York, NY, 2002), 2nd ed., ISBN 978-0-387-95442-4, springer Science+Business Media New York; eBook ISBN: 978-0-387-22440-4; Softcover ISBN: 978-1- 4419-2999-0; Published in Springer Book Archive
work page 2002
-
[5]
A Tutorial on Principal Component Analysis
J. Shlens,A tutorial on principal component analysis(2014), 1404.1100, URLhttps://arxiv.org/abs/1404.1100
work page internal anchor Pith review Pith/arXiv arXiv 2014
-
[6]
M. Greenacre, P. J. F. Groenen, T. Hastie, A. I. D’Enza, A. I. Markos, and E. Tuzhilina, Nature Reviews Methods Primers 2(2022)
work page 2022
-
[7]
NOMAD: A distributed web-based platform for managingmaterials science research data
M. Scheidgen, L. Himanen, A. Ladines, D. Sikter, M. Nakhaee, ´A. Fekete, T.-C. Chang, A. Golparvar, J. Mar´ ıquez, S. Brockhauser, et al., Journal of Open Source Software8, 5388 (2023), URLhttps://doi.org/10.21105/joss.05388
-
[8]
M. K. Horton, P. Huck, R. X. Yang, J. M. Munro, S. Dwaraknath, A. M. Ganose, R. S. Kingsbury, M. Wen, J. X. Shen, T. S. Mathis, et al., Nature Materials24, 1522 (2025), ISSN 1476-4660, URLhttps://doi.org/10.1038/s41563-025-02272-0
-
[9]
H. M. Berman, T. Battistuz, T. N. Bhat, W. Bluhm, P. E. Bourne, K. Burkhardt, L. Iype, S. Jain, P. Fagan, J. Marvin, et al., Nucleic Acids Research28, 235 (2000), the worldwide repository of experimentally determined macromolecular structures, URLhttps://www.rcsb.org/
work page 2000
- [10]
- [11]
-
[12]
M. P. Deisenroth, A. A. Faisal, and C. S. Ong,Mathematics for Machine Learning(Cambridge University Press, 2020)
work page 2020
-
[13]
P. G. Gill, M. A. Purnell, N. Crumpton, K. R. Brown, N. J. Gostling, M. Stampanoni, and E. J. Rayfield, Nature512, 303 (2014), ISSN 1476-4687, URLhttps://doi.org/10.1038/nature13622
-
[15]
L. van der Maaten and G. Hinton, Journal of Machine Learning Research9, 2579 (2008)
work page 2008
-
[16]
D. Kobak and P. Berens, Nature Communications10, 5416 (2019), ISSN 2041-1723, URLhttps://doi.org/10.1038/ s41467-019-13056-x
work page 2019
-
[17]
G. E. Carlsson, Bulletin of the American Mathematical Society46, 255 (2009)
work page 2009
-
[18]
N. Otter, M. A. Porter, U. Tillmann, P. Grindrod, and H. A. Harrington, EPJ Data Science6, 17 (2017), ISSN 2193-1127, URLhttps://doi.org/10.1140/epjds/s13688-017-0109-5
-
[19]
Wasserman, Annual Review of Statistics and Its Application5, 501 (2018)
L. Wasserman, Annual Review of Statistics and Its Application5, 501 (2018)
work page 2018
-
[20]
E. Munch, Journal of Learning Analytics4, 47–61 (2017), URLhttps://learning-analytics.info/index.php/JLA/ article/view/5196
work page 2017
- [21]
-
[24]
L´ evy, Compositio Mathematica7, 283 (1939)
P. L´ evy, Compositio Mathematica7, 283 (1939)
work page 1939
-
[25]
Strang, The American Mathematical Monthly100, 848 (1993)
G. Strang, The American Mathematical Monthly100, 848 (1993)
work page 1993
-
[26]
G. W. Stewart, SIAM Review35, 551 (1993)
work page 1993
-
[27]
Shinn, Proceedings of the National Academy of Sciences120, e2311420120 (2023)
M. Shinn, Proceedings of the National Academy of Sciences120, e2311420120 (2023)
work page 2023
-
[28]
F. Pedregosa, G. Varoquaux, A. Gramfort, V. Michel, B. Thirion, O. Grisel, M. Blondel, P. Prettenhofer, R. Weiss, V. Dubourg, et al., Journal of Machine Learning Research12, 2825 (2011), URLhttp://jmlr.org/papers/v12/ pedregosa11a.html
work page 2011
-
[29]
H. F. Kaiser, Educational and Psychological Measurement20, 141 (1960), https://doi.org/10.1177/001316446002000116, URLhttps://doi.org/10.1177/001316446002000116
-
[30]
J. B. Tenenbaum, V. de Silva, and J. C. Langford, Science290, 2319 (2000)
work page 2000
-
[31]
A. G´ eron,Hands-On Machine Learning with Scikit-Learn and TensorFlow: Concepts, Tools, and Techniques to Build Intelligent Systems(O’ReillY, U.S.A, 2019)
work page 2019
-
[32]
M. A. Kramer, AIChE Journal37, 233 (1991)
work page 1991
-
[33]
S. Recanatesi, S. Bradde, V. Balasubramanian, N. A. Steinmetz, and E. Shea-Brown, Patterns3, 100555 (2022), ISSN 2666-3899, URLhttps://www.sciencedirect.com/science/article/pii/S266638992200160X
work page 2022
-
[34]
M. Gavish and D. L. Donoho, IEEE Transactions on Information Theory60, 5040 (2014)
work page 2014
-
[36]
V. A. Marˇ cenko and L. A. Pastur, Mathematics of the USSR-Sbornik1, 457 (1967)
work page 1967
-
[37]
Low-dimensional embeddings of high- dimensional data.arXiv preprint arXiv:2508.15929,
C. de Bodt, A. Diaz-Papkovich, M. Bleher, K. Bunte, C. Coupette, S. Damrich, E. F. Sanmartin, F. A. Hamprecht, E. ´Agnes Horv´ at, D. Kohli, et al.,Low-dimensional embeddings of high-dimensional data(2025), 2508.15929, URLhttps: //arxiv.org/abs/2508.15929. 6
-
[38]
P. G. Poliˇ car, M. Straˇ zar, and B. Zupan, Journal of Statistical Software109, 1–30 (2024), URLhttps://www.jstatsoft. org/index.php/jss/article/view/v109i03
work page 2024
-
[39]
Villani,Optimal Transport: Old and New(Springer, Berlin, Heidelberg, 2008)
C. Villani,Optimal Transport: Old and New(Springer, Berlin, Heidelberg, 2008)
work page 2008
-
[40]
Computational optima l transport
G. Peyr´ e and M. Cuturi, arXiv preprint arXiv:1803.00567 (2018)
- [41]
-
[42]
K. P. Murphy,Machine learning - a probabilistic perspective(MIT Press, Cambridge, Massachusetts, 2012)
work page 2012
-
[43]
K. Zeng, C. E. P. De Jes´ us, A. J. Fox, and M. D. Graham, Machine Learning: Science and Technology5, 025053 (2024), URLhttps://doi.org/10.1088/2632-2153/ad4ba5
-
[44]
K. V. Mardia and P. E. Jupp,Directional Statistics, Wiley Series in Probability and Statistics (Wiley, 2000), ISBN 978-0471953333
work page 2000
-
[45]
G. Casella and R. L. Berger,Statistical Inference(Duxbury, 2002), 2nd ed
work page 2002
-
[46]
K. V. Bury,Statistical Distributions in Engineering(Cambridge University Press, 1999)
work page 1999
-
[47]
Wes McKinney, inProceedings of the 9th Python in Science Conference, edited by St´ efan van der Walt and Jarrod Millman (2010), pp. 56 – 61
work page 2010
-
[48]
Akaike, 2nd International Symposium on Information Theory pp
H. Akaike, 2nd International Symposium on Information Theory pp. 267–281 (1973)
work page 1973
-
[49]
Schwarz, The Annals of Statistics6, 461 (1978)
G. Schwarz, The Annals of Statistics6, 461 (1978)
work page 1978
-
[50]
C. Zanolli, F. Bouchet, J. Fortuny, F. Bernardini, C. Tuniz, and D. M. Alba, Journal of Human Evolution177, 103326 (2023), ISSN 0047-2484, URLhttps://www.sciencedirect.com/science/article/pii/S0047248423000039
work page 2023
-
[51]
P. G. Gill, Ph.D. thesis, University of Bristol (2004)
work page 2004
-
[52]
P. G. Gill, M. A. Purnell, N. Crumpton, K. R. Brown, N. J. Gostling, M. Stampanoni, and E. J. Rayfield, Nature512, 303 (2014)
work page 2014
-
[53]
P. G. Gill,Personal correspondence(2025)
work page 2025
-
[54]
D. F. Andrews, Biometrics28, 125 (1972)
work page 1972
-
[55]
C. Garc´ ıa-Osorio and C. Fyfe, Journal of Universal Computer Science11, 1806 (2005)
work page 2005
-
[56]
McKinney, inProceedings of the 9th Python in Science Conference, edited by S
W. McKinney, inProceedings of the 9th Python in Science Conference, edited by S. van der Walt and J. Millman (2010), pp. 56–61
work page 2010
-
[57]
I. T. Jolliffe and J. Cadima, Philosophical Transactions of the Royal Society A: Mathematical, Physical and Engineering Sciences374, 20150202 (2016)
work page 2016
-
[58]
S. Damrich, P. Berens, and D. Kobak,Persistent homology for high-dimensional data based on spectral methods(2024), 2311.03087, URLhttps://arxiv.org/abs/2311.03087
-
[59]
R. Vershynin,High-Dimensional Probability: An Introduction with Applications in Data Science, Cambridge Series in Statistical and Probabilistic Mathematics (Cambridge University Press, 2018)
work page 2018
-
[60]
S. L. Brunton and J. N. Kutz,Data-Driven Science and Engineering: Machine Learning, Dynamical Systems, and Control (Cambridge University Press, 2019)
work page 2019
discussion (0)
Sign in with ORCID, Apple, or X to comment. Anyone can read and Pith papers without signing in.