REVIEW 3 major objections 5 minor 32 references
PATH: Next-Interval Prediction via Autoregressive Tree Hierarchy on Tabular Data
T0 review · 3 major / 5 minor · reviewed 2026-08-12 · deepseek-v4-flash
Pith's one-line read PATH, a tree-autoregressive interval predictor, reports the shortest mean normalized interval length among 25 methods while holding mean coverage above the nominal 0.900 target.
desk verdict Solid empirical paper with a genuinely new tree-autoregressive interval predictor; the length gains look real, but the coverage claim is empirical and validation-selection bias deserves a clearer caveat. read the letter →
The pith
A machine-rendered reading of the paper's core claim, the machinery that carries it, and where it could break.
The reading
What carries the argument
The central object is a complete binary interval tree over the target range: with depth $D$, there are $B=2^D$ equal-width leaf intervals, and each target value is encoded as a binary trace from root to leaf. PATH first predicts a base leaf distribution from tabular features using an FT-Transformer encoder, then an autoregressive decoder reads tree prefixes and adds residual branch logits, refining how probability mass flows to left and right children at every node; the refined leaf distribution is the product of the branch probabilities. At inference, shortest-mass extraction scans all contiguous leaf windows and returns the shortest interval whose total probability mass reaches a validation-selected threshold $M$, with temperature $T$ and residual strength $\lambda$ also selected on the validation split.
What would settle it
Run the main 560-evaluation protocol on the representative split and measure validation coverage minus test coverage per dataset; if the five datasets listed in Table E.8 (laser, forest_fires, meta, Titanic, socmob) consistently show gaps above 0.03 across all ten seeds, then the claim that PATH maintains coverage above the validity threshold fails on those datasets.
Extended reading notes
Core claim
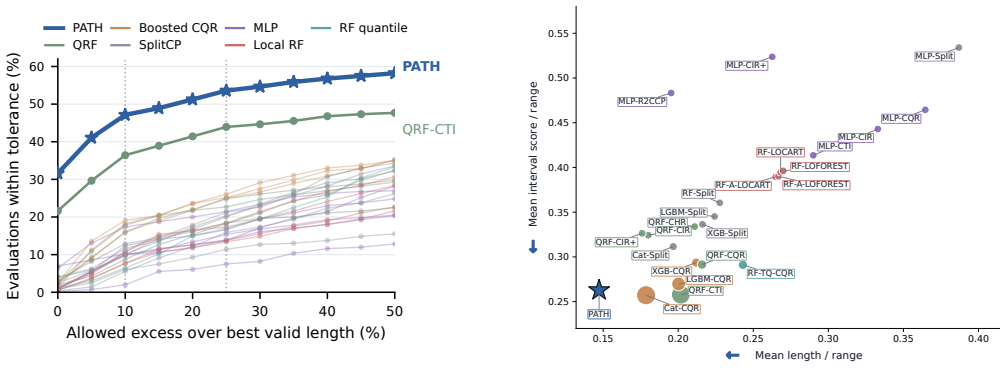
PATH claims that modeling the hierarchical geometry of prediction intervals directly, rather than applying post-hoc rules over an uncertainty surrogate, produces shorter intervals at the same coverage. Concretely, the paper reports mean coverage 0.9144 and mean normalized length 0.1473 across 560 evaluations (10 seeds on 56 datasets) against 24 baselines, the shortest mean and median normalized lengths of any compared method, with the closest baseline in aggregate rank (QRF-CTI) being 36.9 percent longer on average. The paper further shows that the advantage persists under the strict 0.900 coverage requirement, with PATH valid on 76.6 percent of evaluations and holding the best mean rank of 6.46.
Load-bearing premise
PATH chooses the mass threshold, temperature, and residual strength on a single 20 percent validation split with target coverage 0.905, and assumes that the coverage measured there transfers to the test split, with no conformal or exchangeability guarantee for that transfer.
Editorial extensions
If this is right
- Hierarchical output modeling with binary interval trees yields more compact intervals at matched coverage than surrogate-plus-rule conformal pipelines.
- Increasing tree depth from $D=4$ to $D=8$ reduces mean normalized length by roughly 11.6 to 13.0 percent across validation targets, so finer output resolution is an effective scaling dimension.
- Autoregressive refinement contributes a consistent improvement over the direct leaf distribution: removing it raises mean length from 0.1473 to 0.1506, and removing the hierarchy entirely raises it to 0.1623.
- PATH is more often near-optimal than its strongest competitor: it lies within 10 percent of the best valid interval length on 47.1 percent of evaluations, versus 36.4 percent for QRF-CTI.
Reading between the lines
- The output-side tree construction is independent of the tabular encoder, so the same next-interval prediction mechanism could be applied to non-tabular regression settings such as images, text, or time series.
- Using quantile-spaced leaf boundaries instead of equal-width boundaries could further shorten intervals on heavy-tailed targets, at the cost of making leaf width no longer proportional to target length.
- Wrapping PATH's mass threshold in a conformal calibration step could replace the validation-to-test coverage assumption with a distribution-free guarantee, potentially repairing the five datasets where validation coverage does not transfer.
- The finite validation grid over $M$, $T$, and $\lambda$ means PATH's reported operating point is only as good as that grid; a finer or continuously optimized selection could shift both coverage and length.
- The paper's own diagnostic points to a concrete stress test: on the representative split, five datasets show validation-to-test coverage gaps between 0.0344 and 0.1055, and a reader could check whether those gaps persist across all ten seeds.
- A direct way to test the coverage claim is to re-run the 560-evaluation protocol while replacing the validation selection rule with a conformalized scalar expansion; the paper's own calibration-expanded variant already shows coverage dropping to 0.9075, which suggests the learned interval shape carries most of the coverage transfer.
Editorial analysis
A structured set of objections, weighed in public.
Referee Report
Summary. The paper proposes PATH, a method for interval prediction on tabular data. PATH discretizes the target into leaves of a complete binary tree over equal-width bins, predicts a base leaf distribution with an FT-Transformer, applies an autoregressive decoder that refines branch probabilities along tree prefixes, and extracts the shortest contiguous interval whose predictive mass exceeds a threshold M; the mass threshold, temperature, and residual strength are selected on a validation split. The empirical section compares PATH with 24 baselines on 56 OpenML datasets over 10 random seeds, reporting the shortest mean normalized interval length (0.1473) and mean coverage 0.9144. Appendices provide propositions on distribution normalization, the λ=0 special case, grid extraction error, and a finite-grid concentration bound, along with extensive per-dataset records, ablations, and diagnostics.
Significance. If the empirical results hold, PATH is a practically valuable method: on a broad benchmark it yields substantially shorter intervals than 24 strong baselines while keeping average coverage near the nominal level. The paper's strengths include the large evaluation scale (560 evaluations per method, 10 seeds, 24 baselines), paired bootstrap and sign-test analyses, full per-dataset records, and clearly stated propositions in Appendix A. The main caveat is that the coverage claim is not distribution-free and depends on validation-selected parameters; the paper's own diagnostics show several datasets where validation-to-test coverage transfer fails. These issues do not invalidate the length comparison, but they temper the 'maintaining coverage' part of the headline claim.
major comments (3)
- [Appendix A, Proposition A.4; Section 3.4] Proposition A.4 gives a Hoeffding union bound for validation coverage, but it explicitly conditions on a fixed trained model. In the actual pipeline the same 20% validation split is used both to select the checkpoint by validation loss (Section 4.1) and to select M, T, and λ by coverage and length (Section 3.4). After checkpoint selection the model is a function of the validation labels, so the bound does not cover the procedure actually run. This matters because the selection rule 'shortest among candidates with validation coverage ≥ η' is a winner-picking rule: under finite-sample noise, the selected candidate's validation coverage can be systematically higher than its test coverage even when every grid candidate has correct marginal coverage. Please either state explicitly that PATH offers no distribution-free coverage guarantee, or provide a bound or separate calibration split that accounts for the double use of validation.
- [Appendix E.2, Table E.8] Table E.8 documents five representative-split datasets (laser, forest_fires, meta, Titanic, socmob) where validation-to-test coverage gaps of 0.0344 to 0.1055 push test coverage below the 0.885 validity threshold, with test coverages as low as 0.8040. These are exactly the small-validation regimes (validation size roughly 100 to 260 for these datasets) where selection bias is largest. The paper interprets these as distribution-shifted datasets, but they are also consistent with the winner-picking bias described above. Since the headline claim is 'maintaining coverage,' these failures need a deeper analysis, such as a report of coverage transfer as a function of validation size, or a nested or split-conformal calibration that restores a coverage guarantee.
- [Section 4.1, Metrics and comparison rule; Table 2] The comparison rule accepts methods with test coverage as low as 0.885 as 'valid,' a 0.015 tolerance below the nominal 0.900 target. The abstract and Section 4.2 describe PATH as 'maintaining mean coverage above the nominal 0.9 target,' which is a mean statement; Table 2 and Table E.6 show that PATH reaches strict 0.900 coverage on only 429/560 evaluations (76.6%). This gap between the tolerance-based validity and the nominal-coverage claim should be surfaced in the main text, and the strict-0.900 comparison should be presented as the primary ranking, or at least co-primary, if the paper wants to claim coverage maintenance.
minor comments (5)
- [Abstract; Section 4.2] Please consistently distinguish 'mean coverage' from 'per-evaluation strict coverage' so that statements like 'maintaining mean coverage above the nominal 0.9 target' are not read as a per-dataset guarantee.
- [Section 3.1] The choice of uniform target boundaries is motivated by length normalization, but for heavily skewed targets uniform bins can produce many empty or nearly empty leaves; a sentence on how clipping and empty-leaf handling affect the tree product would improve reproducibility.
- [Appendix B, Algorithm B.1] Step 10 of Algorithm B.1 says to select T, M, and λ on validation but does not mention the target η or the candidate rule; please add a cross-reference to Section 3.4 and the η=0.905 default.
- [Table E.8] The table header 'cov val cov gap' is ambiguous; rename the columns to 'test cov,' 'validation cov,' and 'gap' so the reported transfer losses are immediately interpretable.
- [Appendix E.2] The sentence stating that 51/56 datasets satisfy the coverage threshold should explicitly list the five failing datasets from Table E.8 rather than leaving the reader to infer them from the table.
Circularity Check
No significant circularity: PATH's headline coverage and length numbers are measured on held-out test splits, and its few self-citations are not load-bearing.
full rationale
The paper's derivation chain is self-contained. The central empirical claim—mean test coverage 0.9144 at mean normalized length 0.1473—is obtained by fixing training, validating T, M, and lambda on a 20% validation split, and then evaluating on a disjoint 20% test split; the reported number is a direct out-of-sample measurement rather than a fitted quantity renamed as a prediction. Propositions A.1–A.4 are elementary algebraic and concentration facts (normalization of the tree product, lambda=0 recovery, exact discrete shortest-mass extraction, and a fixed-model Hoeffding bound) and do not import the paper's empirical conclusion. The only author-overlapping citation, Yan et al. 2024, appears in Related Work as one of several tabular-model references and plays no role in the method or evaluation. Appendix E.2 and Table E.8 disclose five representative-split datasets with validation-to-test coverage gaps of 0.0344–0.1055; this is an honest limitation about transfer of validation-selected operating points, not a circular step, since test coverage is still measured on data held out from both training and validation selection.
Assumptions & free parameters
free parameters (4)
- Tree depth D =
8
- Validation target eta =
0.905
- Inference tuple (M, T, lambda) =
Per dataset from grid: M in {0.40,...,0.95}, T in {0.7,...,1.5}, lambda in {0,...,1.0}
- Validity tolerance 0.015 =
0.885 threshold
assumptions (4)
- domain assumption Train/validation/test splits are exchangeable and test distribution matches training
- domain assumption Validation coverage transfers to test coverage for the selected (M, T, lambda)
- domain assumption Target values lie within the training target range
- ad hoc to paper The M/T/lambda grid contains an operating point with acceptable coverage and length
Cite this review
Pith. "Pith review of PATH: Next-Interval Prediction via Autoregressive Tree Hierarchy on Tabular Data." pith.science (2026). https://pith.science/paper/A43MMRFH
@misc{pith2026260808078,
  author       = {Pith},
  title        = {Pith review of: PATH: Next-Interval Prediction via Autoregressive Tree Hierarchy on Tabular Data},
  year         = {2026},
  howpublished = {\url{https://pith.science/paper/A43MMRFH}},
  note         = {Machine review of arXiv:2608.08078}
}
read the original abstract
Interval prediction aims to achieve a target coverage level while producing intervals that are as short as possible. Many conformal regression pipelines first predict an uncertainty surrogate and then convert it into an interval through calibration or selection. This separation supports coverage calibration, but post hoc rules largely determine the final interval and do not fully use the learned output distribution. We observe that the resulting intervals have inherently hierarchical geometry: an interval can be recursively refined into nested subintervals, and binary trees naturally represent this structure. We formulate this hierarchy as next-interval prediction and propose PATH, which learns how probability mass flows from each interval to its next nested subintervals. PATH predicts a base leaf distribution and uses an autoregressive decoder to refine branch probabilities. Matching the distribution to the interval hierarchy aligns learning with extraction: PATH accumulates probability over adjacent output intervals and returns the shortest contiguous range reaching a selected mass. We compare PATH with 24 baselines for interval prediction on PATHBench, comprising 56 OpenML regression datasets. PATH substantially shortens the resulting intervals, achieving the lowest mean normalized length, 0.1473, while maintaining mean coverage of 0.9144. These results establish hierarchical output modeling as an effective approach for compact interval prediction on tabular data. Code is publicly available at https://github.com/pxcai/PATH.
Figures


Figures from the paper (3 more)


Reference graph
Works this paper leans on
-
[1]
Deep Evidential Regression , booktitle =
Amini, Alexander and Schwarting, Wilko and Soleimany, Ava and Rus, Daniela , year = 2020, volume =. Deep Evidential Regression , booktitle =
work page 2020
-
[2]
Foundations and Trends in Machine Learning , volume =
Conformal Prediction: A Gentle Introduction , author =. Foundations and Trends in Machine Learning , volume =
-
[3]
Proceedings of the AAAI Conference on Artificial Intelligence , volume =
TabNet: Attentive Interpretable Tabular Learning , author =. Proceedings of the AAAI Conference on Artificial Intelligence , volume =
-
[4]
Mixture Density Networks , author =
-
[5]
Machine Learning , volume =
Random Forests , author =. Machine Learning , volume =
-
[6]
Regression Trees for Fast and Adaptive Prediction Intervals
Regression Trees for Fast and Adaptive Prediction Intervals , author =. 2402.07357 , keywords =
-
[7]
Pattern Recognition Letters , volume =
Rank Consistent Ordinal Regression for Neural Networks with Application to Age Estimation , author =. Pattern Recognition Letters , volume =
-
[8]
XGBoost: A Scalable Tree Boosting System , booktitle =
Chen, Tianqi and Guestrin, Carlos , year = 2016, pages =. XGBoost: A Scalable Tree Boosting System , booktitle =
work page 2016
Show all 32 references
-
[9]
Deep Ordinal Regression Network for Monocular Depth Estimation , booktitle =
Fu, Huan and Gong, Mingming and Wang, Chaohui and Batmanghelich, Kayhan and Tao, Dacheng , year = 2018, pages =. Deep Ordinal Regression Network for Monocular Depth Estimation , booktitle =
2018
-
[10]
Revisiting Deep Learning Models for Tabular Data , booktitle =
Gorishniy, Yury and Rubachev, Ivan and Khrulkov, Valentin and Babenko, Artem , year = 2021, volume =. Revisiting Deep Learning Models for Tabular Data , booktitle =
2021
-
[11]
Conformal Prediction via Regression-as-Classification , booktitle =
Guha, Etash Kumar and Natarajan, Shlok and M. Conformal Prediction via Regression-as-Classification , booktitle =
-
[12]
2601.02769 , keywords =
Fast Conformal Prediction Using Conditional Interquantile Intervals , author =. 2601.02769 , keywords =
-
[13]
2012.06678 , keywords =
TabTransformer: Tabular Data Modeling Using Contextual Embeddings , author =. 2012.06678 , keywords =
2012 arXiv
-
[14]
2007.12778 , keywords =
CD-Split and HPD-Split: Efficient Conformal Regions in High Dimensions , author =. 2007.12778 , keywords =
2007 arXiv
-
[15]
LightGBM: A Highly Efficient Gradient Boosting Decision Tree , booktitle =
Ke, Guolin and Meng, Qi and Finley, Thomas and Wang, Taifeng and Chen, Wei and Ma, Weidong and Ye, Qiwei and Liu, Tie-Yan , year = 2017, volume =. LightGBM: A Highly Efficient Gradient Boosting Decision Tree , booktitle =
2017
-
[16]
Econometrica , volume =
Regression Quantiles , author =. Econometrica , volume =. 1913643 , eprinttype =
-
[17]
Simple and Scalable Predictive Uncertainty Estimation Using Deep Ensembles , booktitle =
Lakshminarayanan, Balaji and Pritzel, Alexander and Blundell, Charles , year = 2017, volume =. Simple and Scalable Predictive Uncertainty Estimation Using Deep Ensembles , booktitle =
2017
-
[18]
Journal of the American Statistical Association , volume =
Distribution-Free Predictive Inference for Regression , author =. Journal of the American Statistical Association , volume =
-
[19]
Computational Statistics & Data Analysis , volume =
Deep Distribution Regression , author =. Computational Statistics & Data Analysis , volume =
-
[20]
Proceedings of the AAAI Conference on Artificial Intelligence , volume =
Conformal Thresholded Intervals for Efficient Regression , author =. Proceedings of the AAAI Conference on Artificial Intelligence , volume =
-
[21]
The Journal of Machine Learning Research , volume =
Quantile Regression Forests , author =. The Journal of Machine Learning Research , volume =
-
[22]
High-Quality Prediction Intervals for Deep Learning: A Distribution-Free, Ensembled Approach , booktitle =
Pearce, Tim and Brintrup, Alexandra and Zaki, Mohamed and Neely, Andy , year = 2018, pages =. High-Quality Prediction Intervals for Deep Learning: A Distribution-Free, Ensembled Approach , booktitle =
2018
-
[23]
1909.06312 , keywords =
Neural Oblivious Decision Ensembles for Deep Learning on Tabular Data , author =. 1909.06312 , keywords =
1909 arXiv
-
[24]
CatBoost: Unbiased Boosting with Categorical Features , booktitle =
Prokhorenkova, Liudmila and Gusev, Gleb and Vorobev, Aleksandr and Dorogush, Anna Veronika and Gulin, Andrey , year = 2018, volume =. CatBoost: Unbiased Boosting with Categorical Features , booktitle =
2018
-
[25]
Conformalized Quantile Regression , booktitle =
Romano, Yaniv and Patterson, Evan and Candes, Emmanuel , year = 2019, volume =. Conformalized Quantile Regression , booktitle =
2019
-
[26]
Deepregression: A Flexible Neural Network Framework for Semi-Structured Deep Distributional Regression , year = 2023, journal =
2023
-
[27]
Conformal Prediction Using Conditional Histograms , booktitle =
Sesia, Matteo and Romano, Yaniv , year = 2021, volume =. Conformal Prediction Using Conditional Histograms , booktitle =
2021
-
[28]
2106.01342 , keywords =
SAINT: Improved Neural Networks for Tabular Data via Row Attention and Contrastive Pre-Training , author =. 2106.01342 , keywords =
-
[29]
Algorithmic Learning in a Random World , author =
-
[30]
Nonparametric Predictive Distributions Based on Conformal Prediction , booktitle =
Vovk, Vladimir and Shen, Jieli and Manokhin, Valery and Xie, Min-ge , year = 2017, pages =. Nonparametric Predictive Distributions Based on Conformal Prediction , booktitle =
2017
-
[31]
International Conference on Learning Representations , volume =
Making Pre-Trained Language Models Great on Tabular Prediction , author =. International Conference on Learning Representations , volume =
-
[32]
ACM SIGKDD Explorations Newsletter , volume =
OpenML: Networked Science in Machine Learning , author =. ACM SIGKDD Explorations Newsletter , volume =. 2014 , publisher =
2014
Reviewed August 12, 2026 · model on record in the stance chip above.
Discussion (0). Continue with ORCID to comment.