REVIEW 3 major objections 5 minor 15 references
Two-Stage Representation Learning for Analyzing Movement Behavior Dynamics in People Living with Dementia
T0 review · 3 major / 5 minor · reviewed 2026-08-07 · deepseek-v4-flash
Pith's one-line read A five-number movement signature predicts cognitive scores in dementia better than clinical baselines.
desk verdict The central PageRank transition matrix is degenerate as written and the validation leaks information, so the headline results are not interpretable, though the descriptive work is extensive and the topic is timely. read the letter →
The pith
A machine-rendered reading of the paper's core claim, the machinery that carries it, and where it could break.
The reading
What carries the argument
The load-bearing object is the five-dimensional deep state vector built in three steps: t-SNE projects 384-dimensional language-model embeddings of daily activity text to two dimensions, k-means identifies five latent states, and a thresholded distance-based transition matrix between states feeds the PageRank iteration $p^{(t+1)} = (1-\alpha)/k + \alpha T^{\top} p^{(t)}$ with damping factor $\alpha = 0.85$. The resulting PageRank vector, the stationary importance of each state, is the compressed representation used as predictive features. This is what turns millions of raw sensor records into five interpretable numbers per participant.
What would settle it
Refit t-SNE, k-means, and the PageRank transition matrix on the 49 training participants in each leave-one-out fold, then pass the held-out participant's embeddings through that fitted pipeline to compute state features before predicting MMSE and ADAS-Cog. Compare the resulting Ridge MAE with the reported 9.73 for ADAS-Cog and 3.81 for MMSE; if the gap over the location-count baseline of 12.77 and 5.15 shrinks or reverses, the advantage depends on leakage rather than on the states themselves.
Extended reading notes
Core claim
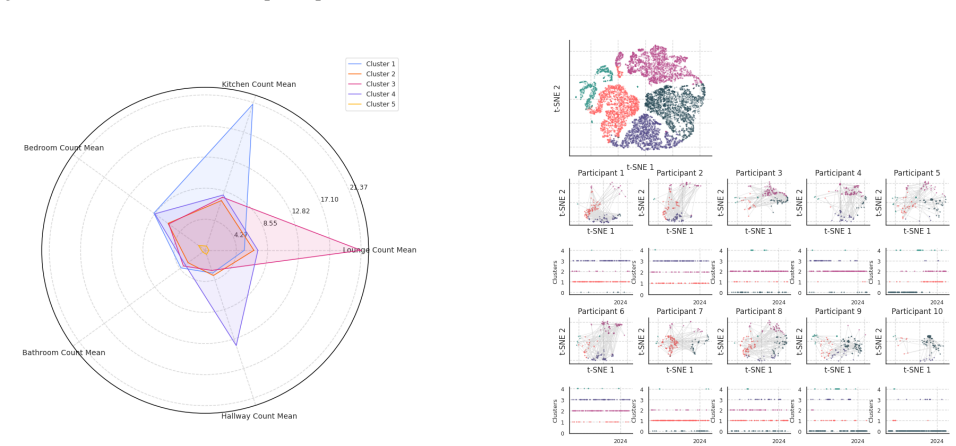
The paper's central claim is that PageRank-derived latent state scores, one number per behavioral state for five states total, carry more predictive signal for current cognitive status than conventional movement summaries and clinical or demographic variables. The authors interpret each state as a distinct behavioral-cognitive profile, such as a transition period or a stable elderly period, and report that clustering participants by these state vectors separates cognitive trajectories. This is the discovery that a low-dimensional representation of home movement can stand in for richer clinical information in cognitive assessment.
Load-bearing premise
The load-bearing assumption is that the t-SNE projection, k-means clusters, and PageRank transition matrix that define the five state features are re-estimated inside each cross-validation fold, so that a held-out participant's own daily records never help define the states used to score that participant.
Editorial extensions
If this is right
- If the state features are as predictive as reported, a clinician could estimate a patient's current MMSE and ADAS-Cog from passive home sensors alone, without a face-to-face cognitive test.
- The heatmap analysis suggests state vectors shift across seasons and three-month intervals, so they could serve as longitudinal markers of behavioral change rather than static snapshots.
- Clusters built from the state vectors separate patients by cognitive trajectory, which would allow care teams to group patients with similar need levels.
- Longer observation windows of 30 to 180 days improve prediction, so the method favors continuous monitoring over short assessments.
- Because the final representation is only five numbers, it is small enough to be audited and explained to clinicians.
Reading between the lines
- Beyond the paper's experiments, the same two-stage pipeline should generalize to other irregular discrete time series, such as wrist actigraphy or sleep-wake logs, because the text encoding step does not rely on dementia-specific labels.
- A direct testable extension is to fit the t-SNE, k-means, and PageRank steps entirely within each training fold and measure how much of the reported accuracy gap survives without leakage from the held-out participant.
- The five semantic state labels, for example 'rapid progression,' could be prospectively validated by testing whether patients assigned to a state go on to show faster cognitive decline over the next six to twelve months.
- Since a five-number vector collapses roughly 7.8 million raw records per patient per quarter, the representation could also lower the data-transfer and storage burden of continuous home monitoring.
Editorial analysis
A structured set of objections, weighed in public.
Referee Report
Summary. The paper proposes a two-stage representation learning pipeline for in-home movement data from people living with dementia. In the first stage, daily PIR sensor sequences are converted to text and embedded with a sentence-transformer model; in the second stage, the embeddings are projected with t-SNE, clustered with k-means, and a PageRank transition matrix is used to derive a five-dimensional state vector per participant. These state vectors are then used, alone or with clinical and demographic features, to predict current MMSE and ADAS-Cog scores, as well as their annual changes, in a cohort of 50 participants. The central empirical claim, from Table 1, is that the five state features achieve the best current-score prediction performance (MAE ADAS-Cog 9.73 and MAE MMSE 3.81 with Ridge regression), outperforming location-count baselines and clinical characteristics. The paper also presents cluster interpretation, SHAP analyses, and temporal heatmaps as evidence that the states carry clinical meaning.
Significance. If the claimed state representation were valid, the paper would offer a compact, interpretable behavioral phenotype for cognitive monitoring, which is clinically relevant. The authors should be credited for working with dense real-world sensor data, including confidence intervals, reporting several baselines including a random-word baseline, and providing ablation studies over time-series length. However, the central model definition in Eq. (1) is degenerate as written, the evaluation pipeline appears to construct the state features on the full test set before leave-one-out cross-validation, and the random-word baseline performs comparably or better in several appendix experiments. These issues are load-bearing: without a corrected transition matrix and a properly nested validation protocol, the reported predictive improvements cannot be interpreted. The absence of released code or data, acknowledged in the appendix, further prevents verification.
major comments (3)
- [Appendix: PageRank Iteration for a Single Patient, Eq. (1)] The transition matrix definition in Eq. (1) is degenerate. The numerator and denominator are the same double sum over the same cluster sets C_i and C_j with the same indicator function, so T_ij equals 1 for every cluster pair that contains at least one pair of points within the distance threshold, and equals 0/0 (undefined) otherwise. After normalization, the transition matrix carries no information about the geometry of the embeddings or the temporal movement dynamics, and the PageRank vector is uniform (or undefined). Therefore the five state features cannot be the discriminative features claimed, and the 'State' rows in Table 1 cannot be produced by the algorithm as written. The authors need to specify the intended transition matrix (for example, based on counts of near-threshold pairs or on temporal transitions between clusters) and provide the distance threshold value and its selection procedure.
- [Experiments and Appendix: Model Pipeline] The state features appear to be constructed on the full test set before leave-one-out cross-validation is applied to the prediction models. The experiments section states 'After clustering the text vectors of the test set using K-means...', and the appendix says 'The test set data was used to directly extract coding vectors from the fine-tuned language model and analyze behavioral transfer patterns.' The t-SNE projection, k-means clustering, and PageRank transition matrix are therefore computed once using all 50 test participants, so each held-out participant's state vector is influenced by the other 49 participants. The appendix 'Model Pipeline' does not describe re-estimating these steps inside each LOOCV fold. This information leakage makes the reported errors optimistic and prevents a valid assessment of generalization. The authors should describe and implement a nested protocol in which all feature construction steps are refit on each training fold.
- [Appendix, Tables 3-5: Random Word Baseline] The claim that the PageRank-derived state features are uniquely predictive is weakened by the random-word baseline in the appendix. For example, in Table 5 the LightGBM model achieves MAE ADAS-Cog 10.77 with Random Word versus 10.64 with State, and in Table 4 LightGBM achieves MAE Delta ADAS-Cog 5.68 with Random Word versus 6.01 with State. Since the main text's Table 1 omits the random-word baseline, the reader cannot see that this simpler baseline is competitive or better in several settings. The authors should either include the random-word baseline in all main result tables or provide a clear explanation of why it is not an appropriate comparison.
minor comments (5)
- [Appendix: PageRank Iteration for a Single Patient] The distance threshold in Eq. (1) is never given a numerical value or a selection method, and the number of clusters (k=5) is chosen from silhouette scores computed on the test set. These choices need to be documented and included in the validation procedure.
- [Cognitive Status Prediction Performance and Appendix Table 5] The main text reports results from Random Forest and Ridge regression, while Appendix Table 5 reports the same outcome (current ADAS-Cog and MMSE) for LightGBM, SVM, and XGBoost. The relationship between these sets of experiments should be clarified, and the feature-set naming should be made consistent across tables.
- [Appendix: Model Parameters] The 'Characteristics' feature set is described as including 'MMSE Score, ADAS-Cog Score (while predicting changes of these scores) and Age.' It should be stated explicitly whether current MMSE and ADAS-Cog values are excluded when predicting current cognitive scores, so that the reader can rule out trivial or circular features.
- [Appendix: Random Word Baseline] The random-word baseline maps each location to a random numeric value, but the text does not state whether the random mapping is fixed across folds and repeated trials. Reporting the number of random seeds and the variability across seeds would make this baseline interpretable.
- [Various] There are several minor typographical and referencing issues: the reference to Kueper et al. is missing a year; the title of van der Maaten and Hinton (2008) has a typo ('Viualizing'); and Figure 12's caption reads 'articipants' instead of 'participants.'
Circularity Check
No significant circularity: the state features are derived from movement data alone, cognitive scores enter only as prediction targets, and the sole self-citation is contextual rather than load-bearing.
full rationale
The central prediction claim is not circular by construction. The five state features are computed as PageRank scores over a transition matrix between k-means clusters of t-SNE projections of MiniLM text embeddings of daily movement strings. MMSE and ADAS-Cog values appear only as the target variables in Table 1 and the appendix prediction experiments; they are not used in the contrastive training, clustering, t-SNE projection, or PageRank construction. Thus the 'State' row is not a fitted-input-called-prediction in the target sense. The only self-citation is Capstick et al. (2024), which the paper invokes as background for the text-encoder stage ('Extending the methods introduced in (Capstick et al. 2024)...') and for the idea of encoding daily activity strings with a text encoder. The present work uses a different encoder (all-MiniLM-L12-v2), fine-tunes it on its own dataset, and adds a PageRank-based second stage; the cited prior work does not carry the weight of the cognitive-prediction result. Concerns that could be correctness issues are not circularity: the appendix transition-matrix equation appears to have identical numerator and denominator as written, which would make the PageRank construction degenerate, and the pipeline may extract state vectors from the full test set before leave-one-out cross-validation, which could cause leakage. However, any such leakage would be from movement data, not from the cognitive outcomes, and a degenerate matrix would invalidate the algorithm rather than make the prediction equal to its input. Neither issue reduces the claimed derivation to its own inputs. The score of 2 reflects only the presence of a minor, non-load-bearing self-citation; no circular step was identified.
Assumptions & free parameters
free parameters (4)
- number_of_clusters_k =
5
- distance_threshold =
not specified
- positive_sample_window =
30 days
- downsampling_interval =
20 minutes
assumptions (4)
- domain assumption Pre-trained language model embeddings reflect semantic similarity between activity text strings
- domain assumption t-SNE projection preserves enough local structure for k-means clustering to recover latent states
- domain assumption Distance-thresholded transition matrix and PageRank yield a meaningful state importance vector
- domain assumption Sensor data accurately reflects participant location and movement
Cite this review
Pith. "Pith review of Two-Stage Representation Learning for Analyzing Movement Behavior Dynamics in People Living with Dementia." pith.science (2026). https://pith.science/paper/ANNEI2GQ
@misc{pith2026250209173,
  author       = {Pith},
  title        = {Pith review of: Two-Stage Representation Learning for Analyzing Movement Behavior Dynamics in People Living with Dementia},
  year         = {2026},
  howpublished = {\url{https://pith.science/paper/ANNEI2GQ}},
  note         = {Machine review of arXiv:2502.09173}
}
read the original abstract
In remote healthcare monitoring, time series representation learning reveals critical patient behavior patterns from high-frequency data. This study analyzes home activity data from individuals living with dementia by proposing a two-stage, self-supervised learning approach tailored to uncover low-rank structures. The first stage converts time-series activities into text sequences encoded by a pre-trained language model, providing a rich, high-dimensional latent state space using a PageRank-based method. This PageRank vector captures latent state transitions, effectively compressing complex behaviour data into a succinct form that enhances interpretability. This low-rank representation not only enhances model interpretability but also facilitates clustering and transition analysis, revealing key behavioral patterns correlated with clinicalmetrics such as MMSE and ADAS-COG scores. Our findings demonstrate the framework's potential in supporting cognitive status prediction, personalized care interventions, and large-scale health monitoring.
Figures


Figures from the paper (22 more)






Reference graph
Works this paper leans on
-
[1]
One-hot Encoding: Convert all daily string representa- tions into one-hot encoded vectors
-
[2]
Clustering: Apply K-means clustering to the one-hot en- coded vectors to group similar daily patterns into clus- ters
-
[3]
AutoTimes: Autoregressive Time Series Forecasters via Large Language Models. Loshchilov, I.; and Hutter, F. 2019. Decoupled Weight De- cay Regularization. ArXiv:1711.05101 [cs, math]. Lyu, X.; Hueser, M.; Hyland, S. L.; Zerveas, G.; and Raetsch, G. 2018. Improving Clinical Predictions through Unsupervised Time Series Representation Learning. ArXiv:1812.00...
arXiv 2019
-
[4]
Similar Sample Selection: For the target day, select a similar sample that meets all the following criteria: • From the same participant • Within a 30-day window of the target day • Belongs to the same cluster as the target day
-
[5]
Dissimilar Sample Selection: Randomly select any other sample that does not meet the criteria for similar sample selection. We selected a 30-day interval for positive sample selec- tion for two key reasons: first, k-means clustering of the en- coded vectors yielded the best results with a 30-day win- dow, as is shown in 2; second, many patients undergo re...
work page 2023
-
[6]
Looking back to location counts: • Shown in Figure 17 and 18, analysis of the mean and variance plots for location counts reveals distinct pat- terns across cognitive states. In State 1, the frequency of kitchen visits is markedly elevated, significantly ex- ceeding the mean observed in other states. This high kitchen usage may suggests possible cognitive...
-
[7]
Target Day Selection: Choose a specific day as the tar- get for comparison
-
[10]
Feature Importance Variation: The significance of cognitive and functional measures varies considerably across states in Figure 26 and 27, indicating distinct be- havioral characteristics
Show all 15 references
-
[11]
• State 5 and 2 exhibits strong negative correlation (- 0.17 and -0.12), potentially indicating cognitive sta- bility or improvement
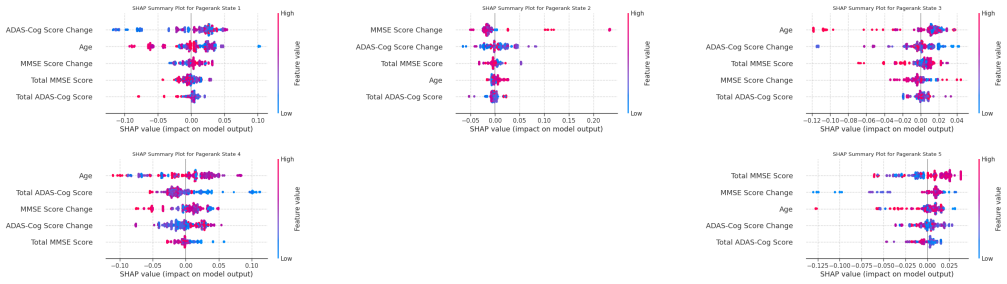
ADAS-Cog Score Change: • State 1,3 and 4 shows positive impact, suggesting cog- nitive decline. • State 5 and 2 exhibits strong negative correlation (- 0.17 and -0.12), potentially indicating cognitive sta- bility or improvement
-
[12]
• Strong positive correlation (0.33) in State 5, further supporting cognitive improvement hypothesis
MMSE Score Change: • Highest variability in State 2, implying significant changes in global cognitive function. • Strong positive correlation (0.33) in State 5, further supporting cognitive improvement hypothesis
-
[13]
• Negative correlations in States 1 and 3 (-0.25 and -0.25), indicating patterns more characteristic of younger participants
Age Effects: • Positive impact in State 2, suggesting prevalence in older participants. • Negative correlations in States 1 and 3 (-0.25 and -0.25), indicating patterns more characteristic of younger participants
-
[14]
• Strong positive correlation (0.29) of Total MMSE Score in State 5, supporting better cognitive function
Total Cognitive Scores: • Complex relationship between Total ADAS-Cog Score and State 2. • Strong positive correlation (0.29) of Total MMSE Score in State 5, supporting better cognitive function
-
[2022]
In 2022 IEEE International Conference on Big Data (Big Data), 942–951
Semi-supervised Embedding for Scalable and Accu- rate Time Series Clustering. In 2022 IEEE International Conference on Big Data (Big Data), 942–951. Iv´an, G.; and Grolmusz, V . 2011. When the Web meets the cell: using personalized PageRank for analyzing protein in- teraction ...
2022 arXiv
-
[2023]
ArXiv:2210.07316 [cs]
MTEB: Massive Text Embedding Benchmark. ArXiv:2210.07316 [cs]. Page, L.; Brin, S.; Motwani, R.; and Winograd, T. 1999. The PageRank Citation Ranking : Bringing Order to the Web. Pedregosa, F.; Varoquaux, G.; Gramfort, A.; Michel, V .; Thirion, B.; Grisel, O.; Blondel, M.; Pret...
1999 arXiv
-
[2024]
Brown, T
Multi-Patch Prediction: Adapting LLMs for Time Se- ries Representation Learning. Brown, T. B.; Mann, B.; Ryder, N.; Subbiah, M.; Kaplan, J.; Dhariwal, P.; Neelakantan, A.; Shyam, P.; Sastry, G.; Askell, A.; Agarwal, S.; Herbert-V oss, A.; Krueger, G.; Henighan, T.; Child, R.; ...
2020
Reviewed August 7, 2026 · model on record in the stance chip above.
Discussion (0). Continue with ORCID to comment.