REVIEW 3 major objections 5 minor 93 references
JWST reveals the largest known M-dwarf debris disk, a ~191 au ring around TWA 10.
Reviewed by Pith at T0; open to challenge. T0 means a machine referee read the full paper against a public rubric. the ladder, T0–T4 →
T0 review · deepseek-v4-flash
2026-08-01 04:44 UTC pith:AQSB7UWW
load-bearing objection Real and useful disk discovery, but the '191 au record' radius needs a model-systematic error before it can be quoted as the largest known M-dwarf disk. the 3 major comments →
JWST NIRCam Reveals the Largest Known M-dwarf Debris Disk Around TWA 10 and New Scattered-Light Observations of the TWA 25 Debris Disk
The pith
A machine-rendered reading of the paper's core claim, the machinery that carries it, and where it could break.
Core claim
The discovery is that TWA 10 hosts a debris disk with radius ~191 au, more than twice the typical size of previously imaged M-dwarf debris disks and far outside the radius–luminosity scaling seen for brighter stars. The authors derive this from forward models of the NIRCam scattered-light images, using a ring-like disk with a two-parameter scattering phase function, and they note the radius is formally uncertain (the two fitting runs give 191 and 157 au). In addition, the paper characterizes TWA 25's disk as having a very steep inner density power-law (~12–17) and a 10–25% brightness asymmetry in the F200W filter, which they interpret as likely evidence of an inner planetary system or a rece
What carries the argument
The central tool is forward modeling of the coronagraphic images: a simple axisymmetric ring model (fiducial radius r0, scale height h0=0.05, radial power-law exponents α_in and α_out, and a two-parameter scattering phase function) is fitted to the NIRCam F200W and F444W data after reference-star differential imaging. The same model is then fed to a radiative-transfer code to predict the disk's spectral energy distribution, demonstrating that the disks could have escaped detection in previous infrared surveys. The fitted r0 is the quantity that carries the paper's headline claim.
Load-bearing premise
The 'largest M-dwarf disk' claim rests on a forward model that assumes a single axisymmetric ring with a fixed scale height and a two-parameter scattering phase function; the two fitting methods disagree on the radius (191 vs 157 au) and the phase function is unconstrained, so the true disk radius could be significantly smaller if the model is too simple.
What would settle it
ALMA submillimeter imaging of TWA 10 that resolves the thermal emission from large grains: if the millimeter continuum peaks at a radius substantially below ~191 au (e.g., <100 au), then the scattered-light ring is tracing small, radiation- or wind-blown grains rather than the planetesimal belt, and the claim of an exceptionally large disk is wrong. Alternatively, a re-fit of the NIRCam data with a more flexible model (free scale height, broken power law, or eccentric ring) that yields a significantly smaller r0 would falsify the headline claim.
If this is right
- If the 191 au radius holds, TWA 10 becomes the largest M-dwarf debris disk known, requiring a re-examination of the disk radius–stellar luminosity scaling.
- The low luminosity fractions derived for these disks (about 3.6e-5 and 6.9e-5) imply that previous Spitzer and Herschel surveys would have missed them, meaning the census of M-dwarf debris disks is incomplete.
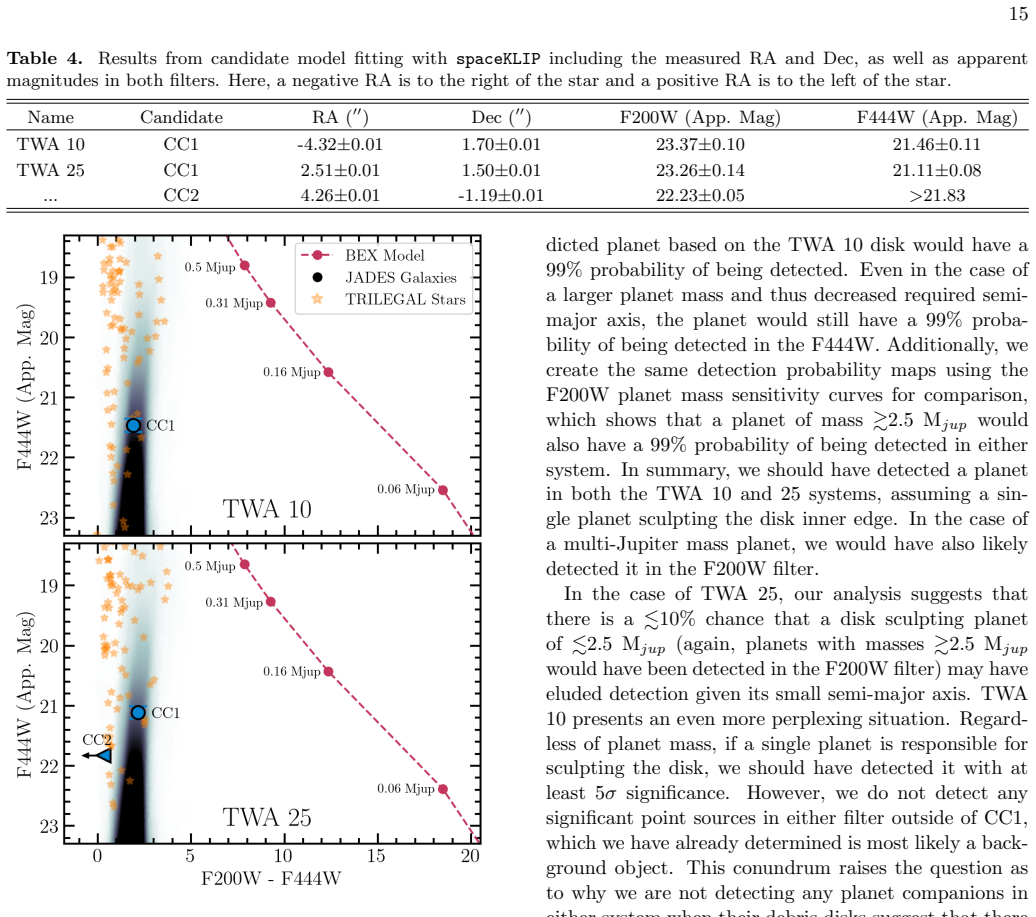
- TWA 25's sharp inner edge (α_in ~ 12–17) and the F200W brightness asymmetry are consistent with a sculpting planet or a recent collision; the paper's planet-search shows that if a single massive planet were responsible, it should have been detected, so the architecture must be different (multiple smaller planets, inward migration, or non-planetary sculpting).
- The three point sources found in the images are all likely background objects based on their F200W–F444W colors, so no new companions are confirmed in these systems.
Where Pith is reading between the lines
- If M-dwarf disks are commonly this faint, then the known population of M-dwarf debris disks is heavily biased toward the brightest and most compact examples; a systematic JWST survey of nearby M-dwarfs could reveal a much wider range of disk sizes and frequencies.
- The TWA 10 disk's scattered-light radius may not coincide with the planetesimal belt if stellar winds push small grains outward; the paper assumes the peak surface brightness marks the belt, but longer-wavelength imaging of large grains would test this.
- The steep inner edge of TWA 25 adds to a pattern seen in other debris disks where inner edges are too steep for pure collisional grinding and too shallow for a single planet, supporting a multi-planet or migration scenario.
- A direct follow-up prediction: deep ALMA observations should detect thermal emission from large grains at ~191 au in TWA 10 and ~64 au in TWA 25; if the millimeter radius of TWA 10 is much smaller, the scattered-light ring is dominated by blowout grains and the 'giant disk' claim would be weakened.
Editorial analysis
A structured set of objections, weighed in public.
Referee Report
Summary. The paper presents JWST NIRCam coronagraphic F200W/F444W observations of two M-dwarfs in TW Hydra, TWA 10 and TWA 25. It reports the discovery and first resolved imaging of a debris disk around TWA 10, re-images the known TWA 25 disk, and fits both disks with an axisymmetric Augereau et al. (1999) ring model. From these fits the authors derive a radius of ~191 au for TWA 10, claim this is the largest known M-dwarf debris disk, and argue that the TWA 25 disk has a steep inner edge and a brightness asymmetry consistent with planetary sculpting. The paper also uses MCFOST to estimate SEDs and dust masses, presents 5σ contrast curves and planet-detection probability maps, and identifies three point-source candidates that are shown to be likely background objects. The central discovery claim—the exceptionally large TWA 10 radius—is interesting but, as discussed below, is not yet robust to the modeling assumptions used to derive it.
Significance. If the ~191 au radius is robust, the TWA 10 disk would be a landmark object: it would be the largest resolved debris disk around an M-dwarf, challenge the empirical radius–luminosity relation, and support the idea that many M-dwarf disks are too faint for previous SED surveys. The strengths of the paper include the careful reduction with public pipelines (spaceKLIP/Winnie), the use of forward-model-constrained RDI, jack-knife tests of candidate companions, and a sensible color-based rejection of background objects. The data are also made available through a MAST DOI. However, the headline radius currently rests on a single model that fixes h0 and leaves the scattering phase function largely unconstrained, while the two fitting methods used by the authors disagree by 34 au—five times the quoted 1σ uncertainty. Because the abstract and summary state the emcee radius without this systematic uncertainty, the main quantitative claim needs additional robustness testing or a substantially more cautious presentation.
major comments (3)
- [§3.1, Table 3; §5.1; Abstract and §7] The headline 'largest known M-dwarf debris disk' is not yet robust. Table 3 gives Powell r0 = 157.13 au and emcee r0 = 191.15 ± 6.53 au for TWA 10 in F200W. The 34 au difference is much larger than the quoted 1σ uncertainty and is not propagated into the abstract or summary, which quote 191 au as the measured radius. This matters because the scattered-light surface brightness is the product of the radial density profile and an anisotropic, two-parameter Henyey-Greenstein SPF; Section 5.1 explicitly states that the SPF is difficult to constrain, with no constraint on g2 in F200W and no constraint on any SPF parameter in F444W. The model also fixes h0 = 0.05. A robust claim requires either a systematic uncertainty that covers the Powell–emcee range, a model-selection argument for preferring the emcee solution, or a test of sensitivity to h0 and SPF parameterization. At minimum, the paper s
- [§4.3, §5.1] The statement that TWA 10 and TWA 25 were 'likely missed by previous disk detection surveys due to low luminosity fractions' is presented in the Summary as a conclusion, but the MCFOST SEDs in §4.3 are normalized to the F200W best-fit model and the dust mass is scaled to match that model's surface brightness. The resulting luminosity fractions (~3.6e-5 and ~6.9e-5) are therefore illustrative estimates, not independent predictions from the SED. The paper acknowledges degeneracies, but the language in the Summary should be softened, and the dependence of the disk SED on r0 should be noted: if r0 shifts from 191 to 157 au, the dust mass and peak flux of the model SED would also change.
- [§5.2, Table 3] For TWA 25, the derived radius of 63.8 ± 3.3 au is formally inconsistent with the SPHERE estimate of 76 ± 2 au at about 3.5σ. The paper attributes this to ADI self-subtraction and to SPHERE's ellipse-fitting approach, which is plausible but not demonstrated. Since the same axisymmetric ring model is used for both disks and a significant part of the paper's credibility on TWA 10 depends on this modeling approach, it would strengthen the analysis to test TWA 25 with at least one alternative model (e.g., free h0 or a single-component HG SPF) and quantify how the radius changes. This would also give a better sense of the model uncertainty that likely affects TWA 10.
minor comments (5)
- [§7] Typo: 'stis appears axisymmetric' should be 'still appears axisymmetric'.
- [Figure 12 caption] Typo: 'circled in whie' should be 'circled in white'.
- [Table 5] The TWA 10 2MASS Ks flux of 3.5e-2 ± 9.9e-3 Jy appears anomalously low compared to the listed J and H fluxes and to WISE3/WISE4. This may be a typographical or unit error; please check.
- [§5.2] The text lists Ren et al. (2023) as a previous detection but only compares the new results with NICMOS and SPHERE. A brief comparison with the STIS-based analysis would be useful.
- [Throughout] The paper uses both 'TWA' and 'TW A' (e.g., 'TW A 10' in text and title, 'TWA 10' in tables/abstract). Please unify the notation.
Circularity Check
No significant circularity: disk radii and morphology are fit directly to NIRCam images, and the SED and planet-sculpting inferences use those fits as inputs rather than assuming the conclusions.
full rationale
The paper's central claims (TWA 10 disk radius ~191 au, TWA 25 inner slope and asymmetry) come from forward modeling of the NIRCam images, with model parameters (r0, inclination, PA, alpha_in/out, SPF) adjusted to the data via Powell/emcee. This is a measured inference from the observations, not a quantity defined in terms of the conclusion. The 'largest known M-dwarf disk' headline is a comparison of the fitted r0 to literature radii, and the paper explicitly notes the model degeneracy (SPF poorly constrained, Powell vs emcee r0 difference of 191 vs 157 au), which is a robustness/correctness concern rather than circularity. The MCFOST disk SEDs are scaled to the measured F200W disk brightness and then shown to be consistent with the independent Spitzer/Herschel non-detections; the conclusion that the disks were missed because they are faint follows from the model plus external upper limits, not from the same measured quantity. The SculptingPlanet planet-mass/semi-major-axis estimates take the fitted inner radius as input and are compared to the independent non-detection of companions, so no 'prediction' reduces to its fitting input by construction. Software/self-citations (spaceKLIP, Winnie, MCRDI) are methodological references to code, not load-bearing evidence for the scientific result. No derivation chain reduces to its inputs by definition or to a self-citation chain.
Axiom & Free-Parameter Ledger
free parameters (7)
- TWA 10 r0 (disk radius) =
191.15±6.53 au (emcee); 157.13 au (Powell)
- TWA 25 r0 (disk radius) =
63.81±3.26 au
- TWA 10 surface density slopes (αin, αout) =
4.53±3.36, -8.45±2.56
- TWA 25 surface density slopes (αin, αout) =
11.94±5.37, -3.84±0.31
- Scale height h0 =
0.05 (fixed)
- SPF parameters g1, g2, wg1 =
TWA 10: g1=0.80±0.13, g2=0.57±0.65, wg1=0.80±0.18; TWA 25: g1=0.90±0.06, g2=0.44±0.19, wg1=0.87±0.07
- Dust mass in MCFOST SED =
6.7e-3 M⊕ (TWA 10); 3.3e-3 M⊕ (TWA 25)
axioms (4)
- domain assumption Ring-like disk morphology with a two-parameter Henyey-Greenstein SPF (Augereau et al. 1999)
- domain assumption Distance and age from Gaia DR3 and Miret-Roig et al. (2025)
- domain assumption Stellar SED models from Yelverton et al. (2019)
- domain assumption Assumed dust grain properties: astrosilicate, 0.1–1000 µm, size distribution -3.5
Cite this review
Pith. "Pith review of JWST NIRCam Reveals the Largest Known M-dwarf Debris Disk Around TWA 10 and New Scattered-Light Observations of the TWA 25 Debris Disk." pith.science (2026). https://pith.science/paper/AQSB7UWW
@misc{pith2026260722426,
  author       = {Pith},
  title        = {Pith review of: JWST NIRCam Reveals the Largest Known M-dwarf Debris Disk Around TWA 10 and New Scattered-Light Observations of the TWA 25 Debris Disk},
  year         = {2026},
  howpublished = {\url{https://pith.science/paper/AQSB7UWW}},
  note         = {Machine review of arXiv:2607.22426}
}
read the original abstract
We present JWST NIRCam observations of two M-dwarf systems located in the TW Hydra association, TWA 10 and TWA 25. Both systems harbor detected debris disks in the F200W and F444W filters. Whereas the TWA 25 disk has been previously imaged, these observations represent the discovery and first images of the TWA 10 disk. In addition to planet searches within these systems, we also conduct an analysis of each debris disk, where the TWA 10 debris disk is characterized for the first time. We find that the TWA 10 debris disk is very large, with a radius of $\sim$191 au, significantly greater than other known M-dwarf debris disks. The TWA 25 disk hosts a sharp inner dust surface density power-law and a moderate brightness asymmetry present at 2 $\mu$m, suggesting potential sculpting from inner planets and potentially enhanced collisional activity. Finally, we find one potential companion candidate within the TWA 10 system and two within the TWA 25 system, although the measured F200W-F444W color suggests that these candidates are likely background objects. Both systems do not have measured IR-excesses in their SEDs, where radiative-transfer modeling suggests that these disks (and potentially more M-dwarf disks) were likely missed by previous disk detection surveys due to having low luminosity fractions.
Figures



Reference graph
Works this paper leans on
-
[1]
Andrews, S. M., Rosenfeld, K. A., Kraus, A. L., & Wilner, D. J. 2013, ApJ, 771, 129, doi: 10.1088/0004-637X/771/2/129 Astropy Collaboration, Robitaille, T. P., Tollerud, E. J., et al. 2013, A&A, 558, A33, doi: 10.1051/0004-6361/201322068 Astropy Collaboration, Price-Whelan, A. M., Sip˝ ocz, B. M., et al. 2018, AJ, 156, 123, doi: 10.3847/1538-3881/aabc4f A...
-
[2]
2006, A&A, 455, 987, doi: 10.1051/0004-6361:20054250
Augereau, J.-C., & Beust, H. 2006, A&A, 455, 987, doi: 10.1051/0004-6361:20054250
-
[3]
On the HR 4796A circumstellar disk
Augereau, J. C., Lagrange, A. M., Mouillet, D., Papaloizou, J. C. B., & Grorod, P. A. 1999, A&A, 348, 557, doi: 10.48550/arXiv.astro-ph/9906429
work page internal anchor Pith review Pith/arXiv arXiv doi:10.48550/arxiv.astro-ph/9906429 1999
-
[4]
2014, ApJL, 780, L4, doi: 10.1088/2041-8205/780/1/L4
Bailey, V., Meshkat, T., Reiter, M., et al. 2014, ApJL, 780, L4, doi: 10.1088/2041-8205/780/1/L4
-
[5]
2020, Exo-DMC: Exoplanet Detection Map
Bonavita, M. 2020, Exo-DMC: Exoplanet Detection Map
2020
-
[6]
http://ascl.net/2010.008
Calculator, Astrophysics Source Code Library, record ascl:2010.008. http://ascl.net/2010.008
2010
-
[7]
2012, A&A, 537, A67, doi: 10.1051/0004-6361/201116852
Bonavita, M., Chauvin, G., Desidera, S., et al. 2012, A&A, 537, A67, doi: 10.1051/0004-6361/201116852
-
[8]
Bowens-Rubin, R., Mang, J., Limbach, M. A., et al. 2025, ApJL, 986, L26, doi: 10.3847/2041-8213/addbde
-
[9]
Burns, J. A., Lamy, P. L., & Soter, S. 1979, Icarus, 40, 1, doi: 10.1016/0019-1035(79)90050-2
-
[10]
Carrera, D., Gorti, U., Johansen, A., & Davies, M. B. 2017, ApJ, 839, 16, doi: 10.3847/1538-4357/aa6932
-
[11]
L., Hinkley, S., Kammerer, J., et al
Carter, A. L., Hinkley, S., Kammerer, J., et al. 2023b, ApJL, 951, L20, doi: 10.3847/2041-8213/acd93e Choquet, ´E., Perrin, M. D., Chen, C. H., et al. 2016, ApJL, 817, L2, doi: 10.3847/2041-8205/817/1/L2
-
[12]
Cieza, L. A., Olofsson, J., Harvey, P. M., et al. 2013, ApJ, 762, 100, doi: 10.1088/0004-637X/762/2/100
-
[13]
Cronin-Coltsmann, P. F., Kennedy, G. M., Kral, Q., et al. 2023, MNRAS, 526, 5401, doi: 10.1093/mnras/stad3083
-
[14]
Crotts, K. A., Draper, Z. H., Matthews, B. C., et al. 2022, ApJ, 932, 23, doi: 10.3847/1538-4357/ac6c86
-
[15]
Crotts, K. A., Carter, A. L., Lawson, K., et al. 2025, ApJL, 987, L41, doi: 10.3847/2041-8213/ade798
-
[16]
M., Skrutskie, M
Cutri, R. M., Skrutskie, M. F., van Dyk, S., et al. 2003, 2MASS All Sky Catalog of point sources
2003
-
[17]
Dent, W. R. F., Wyatt, M. C., Roberge, A., et al. 2014, Science, 343, 1490, doi: 10.1126/science.1248726
-
[18]
Dohnanyi, J. S. 1969, JGR, 74, 2531, doi: 10.1029/JB074i010p02531 Dra˙ zkowska, J., & Alibert, Y. 2017, A&A, 608, A92, doi: 10.1051/0004-6361/201731491
-
[19]
J., Willott, C., Alberts, S., et al
Eisenstein, D. J., Willott, C., Alberts, S., et al. 2023, arXiv e-prints, arXiv:2306.02465, doi: 10.48550/arXiv.2306.02465
-
[20]
2025, A&A, 704, A21, doi: 10.1051/0004-6361/202554953
Engler, N., Milli, J., Pawellek, N., et al. 2025, A&A, 704, A21, doi: 10.1051/0004-6361/202554953
-
[21]
Esposito, T. M., Kalas, P., Fitzgerald, M. P., et al. 2020, AJ, 160, 24, doi: 10.3847/1538-3881/ab9199
-
[22]
Foreman-Mackey, D., Hogg, D. W., Lang, D., & Goodman, J. 2013, PASP, 125, 306, doi: 10.1086/670067
doi:10.1086/670067 2013
-
[23]
Friebe, M. F., Pearce, T. D., & L¨ ohne, T. 2022, MNRAS, 512, 4441, doi: 10.1093/mnras/stac664 Gaia Collaboration. 2018, VizieR Online Data Catalog: Gaia DR2 (Gaia Collaboration, 2018), VizieR On-line Data Catalog: I/345. Originally published in: 2018A&A...616A...1G, doi: 10.26093/cds/vizier.1345 Gaia Collaboration, Brown, A. G. A., Vallenari, A., et al. ...
-
[24]
2017, MNRAS, 470, L1, doi: 10.1093/mnrasl/slx063
Gaidos, E. 2017, MNRAS, 470, L1, doi: 10.1093/mnrasl/slx063
-
[25]
H., Leisenring, J., Kammerer, J., et al
Girard, J. H., Leisenring, J., Kammerer, J., et al. 2022, in Society of Photo-Optical Instrumentation Engineers (SPIE) Conference Series, Vol. 12180, Space Telescopes and Instrumentation 2022: Optical, Infrared, and Millimeter Wave, ed. L. E. Coyle, S. Matsuura, & M. D. Perrin, 121803Q, doi: 10.1117/12.2629636
-
[26]
Girardi, L., Groenewegen, M. A. T., Hatziminaoglou, E., & da Costa, L. 2005, A&A, 436, 895, doi: 10.1051/0004-6361:20042352
-
[27]
M., van der Marel, N., Williams, J
Guerra-Alvarado, O. M., van der Marel, N., Williams, J. P., et al. 2025, A&A, 696, A232, doi: 10.1051/0004-6361/202453338
-
[28]
Harris, C. R., Millman, K. J., van der Walt, S. J., et al. 2020, Nature, 585, 357, doi: 10.1038/s41586-020-2649-2
-
[29]
A., Templeton, M., Terrell, D., et al
Henden, A. A., Templeton, M., Terrell, D., et al. 2016, VizieR Online Data Catalog: AA VSO Photometric All Sky Survey (APASS) DR9 (Henden+, 2016), VizieR On-line Data Catalog: II/336. Originally published in: 2015AAS...22533616H
2016
-
[30]
Henyey, L. G., & Greenstein, J. L. 1941, ApJ, 93, 70, doi: 10.1086/144246
doi:10.1086/144246 1941
-
[31]
Herczeg, G. J., & Hillenbrand, L. A. 2014, ApJ, 786, 97, doi: 10.1088/0004-637X/786/2/97 Høg, E., Fabricius, C., Makarov, V. V., et al. 2000, A&A, 355, L27 22
-
[32]
M., Duchˆ ene, G., & Matthews, B
Hughes, A. M., Duchˆ ene, G., & Matthews, B. C. 2018, ARA&A, 56, 541, doi: 10.1146/annurev-astro-081817-052035
-
[33]
Hunter, J. D. 2007, CSE, 9, 90
2007
-
[34]
2016, A&A, 596, L3, doi: 10.1051/0004-6361/201629680
Ida, S., & Guillot, T. 2016, A&A, 596, L3, doi: 10.1051/0004-6361/201629680
-
[35]
2000, ApJ, 528, 351, doi: 10.1086/308179
Ida, S., Larwood, J., & Burkert, A. 2000, ApJ, 528, 351, doi: 10.1086/308179
doi:10.1086/308179 2000
-
[36]
2010, A&A, 514, A1, doi: 10.1051/0004-6361/200913811
Ishihara, D., Onaka, T., Kataza, H., et al. 2010, A&A, 514, A1, doi: 10.1051/0004-6361/200913811
-
[37]
Izidoro, A., Dasgupta, R., Raymond, S. N., et al. 2022, Nature Astronomy, 6, 357, doi: 10.1038/s41550-021-01557-z
-
[38]
Esposito, T. M. 2023, ApJ, 948, 102, doi: 10.3847/1538-4357/acc466
-
[39]
Kalas, P., Liu, M. C., & Matthews, B. C. 2004, Science, 303, 1990, doi: 10.1126/science.1093420
-
[40]
Kammerer, J., Girard, J., Carter, A. L., et al. 2022, in Society of Photo-Optical Instrumentation Engineers (SPIE) Conference Series, Vol. 12180, Space Telescopes and Instrumentation 2022: Optical, Infrared, and Millimeter Wave, ed. L. E. Coyle, S. Matsuura, & M. D. Perrin, 121803N, doi: 10.1117/12.2628865
-
[41]
Kenyon, S. J., & Bromley, B. C. 2001, AJ, 121, 538, doi: 10.1086/318019 —. 2002, AJ, 123, 1757, doi: 10.1086/338850
doi:10.1086/318019 2001
-
[42]
T., Pinilla, P., Long, F., et al
Kurtovic, N. T., Pinilla, P., Long, F., et al. 2021, A&A, 645, A139, doi: 10.1051/0004-6361/202038983
-
[43]
2010, Science, 329, 57, doi: 10.1126/science.1187187
Lagrange, A.-M., Bonnefoy, M., Chauvin, G., et al. 2010, Science, 329, 57, doi: 10.1126/science.1187187
-
[44]
2025, Nature, 642, 905, doi: 10.1038/s41586-025-09150-4
Lagrange, A.-M., Wilkinson, C., Mˆ alin, M., et al. 2025, Nature, 642, 905, doi: 10.1038/s41586-025-09150-4
-
[45]
Lawson, K., Currie, T., Wisniewski, J. P., et al. 2022, ApJL, 935, L25, doi: 10.3847/2041-8213/ac853b
-
[46]
Lawson, K., Schlieder, J. E., Leisenring, J. M., et al. 2023, AJ, 166, 150, doi: 10.3847/1538-3881/aced08 —. 2024, ApJL, 967, L8, doi: 10.3847/2041-8213/ad4496
-
[47]
F., Mordasini, C., Molli` ere, P., et al
Linder, E. F., Mordasini, C., Molli` ere, P., et al. 2019, A&A, 623, A85, doi: 10.1051/0004-6361/201833873
-
[48]
Low, F. J., Smith, P. S., Werner, M., et al. 2005, ApJ, 631, 1170, doi: 10.1086/432640
-
[49]
V., Booth, M., & Lestrade, J.-F
Luppe, P., Krivov, A. V., Booth, M., & Lestrade, J.-F. 2020, MNRAS, 499, 3932, doi: 10.1093/mnras/staa2608
-
[50]
MacGregor, M. A., Wilner, D. J., Rosenfeld, K. A., et al. 2013, ApJL, 762, L21, doi: 10.1088/2041-8205/762/2/L21
-
[51]
Macintosh, B., Graham, J. R., Ingraham, P., et al. 2014, Proceedings of the National Academy of Science, 111, 12661, doi: 10.1073/pnas.1304215111
-
[52]
Mang, J., Morley, C. V., Robinson, T. D., & Gao, P. 2024, ApJ, 974, 190, doi: 10.3847/1538-4357/ad6c4c
-
[53]
Marocco, F., Eisenhardt, P. R. M., Fowler, J. W., et al. 2021, ApJS, 253, 8, doi: 10.3847/1538-4365/abd805
-
[54]
2006, ApJ, 641, 556, doi: 10.1086/500401 Matr` a, L., Marino, S., Kennedy, G
Nadeau, D. 2006, ApJ, 641, 556, doi: 10.1086/500401 Matr` a, L., Marino, S., Kennedy, G. M., et al. 2018, ApJ, 859, 72, doi: 10.3847/1538-4357/aabcc4 Matr` a, L., Marino, S., Wilner, D. J., et al. 2025, A&A, 693, A151, doi: 10.1051/0004-6361/202451397
doi:10.1086/500401 2006
-
[55]
Matthews, B. C., Krivov, A. V., Wyatt, M. C., Bryden, G., & Eiroa, C. 2014, in Protostars and Planets VI, ed. H. Beuther, R. S. Klessen, C. P. Dullemond, & T. Henning, 521–544, doi: 10.2458/azu uapress 9780816531240-ch023
doi:10.2458/azu 2014
-
[56]
2025, A&A, 694, A60, doi: 10.1051/0004-6361/202452558
Miret-Roig, N., Alves, J., Ratzenb¨ ock, S., et al. 2025, A&A, 694, A60, doi: 10.1051/0004-6361/202452558
-
[57]
Montesinos, B., Eiroa, C., Krivov, A. V., et al. 2016, A&A, 593, A51, doi: 10.1051/0004-6361/201628329
-
[58]
2022, Nature Astronomy, 6, 72, doi: 10.1038/s41550-021-01517-7 Morey, ´E., & Lestrade, J.-F
Morbidelli, A., Bailli´ e, K., Batygin, K., et al. 2022, Nature Astronomy, 6, 72, doi: 10.1038/s41550-021-01517-7 Morey, ´E., & Lestrade, J.-F. 2014, A&A, 565, A58, doi: 10.1051/0004-6361/201322567
-
[59]
Mustill, A. J., & Wyatt, M. C. 2009, MNRAS, 399, 1403, doi: 10.1111/j.1365-2966.2009.15360.x
arXiv 2009
-
[60]
Newville, M., Otten, R., Nelson, A., et al. 2025, LMFIT: Non-Linear Least-Squares Minimization and Curve-Fitting for Python, 1.3.3, Zenodo, doi: 10.5281/zenodo.15014437
-
[61]
Nielsen, E. L., Liu, M. C., Wahhaj, Z., et al. 2014, ApJ, 794, 158, doi: 10.1088/0004-637X/794/2/158
-
[62]
Palatnick, S., Millar-Blanchaer, M. A., Zhang, J., et al. 2025, ApJ, 995, 149, doi: 10.3847/1538-4357/ae1963
-
[63]
Patel, R. I., Metchev, S. A., & Heinze, A. 2014, ApJS, 212, 10, doi: 10.1088/0067-0049/212/1/10
-
[64]
Pawellek, N., Mo´ or, A., Pascucci, I., & Krivov, A. V. 2019, MNRAS, 487, 5874, doi: 10.1093/mnras/stz1682
-
[65]
Pearce, T. D., & Wyatt, M. C. 2014, MNRAS, 443, 2541, doi: 10.1093/mnras/stu1302
-
[66]
D., Launhardt, R., Ostermann, R., et al
Pearce, T. D., Launhardt, R., Ostermann, R., et al. 2022, A&A, 659, A135, doi: 10.1051/0004-6361/202142720
-
[67]
Pearce, T. D., Krivov, A. V., Sefilian, A. A., et al. 2024, MNRAS, 527, 3876, doi: 10.1093/mnras/stad3462
-
[68]
Perez, F., & Granger, B. E. 2007, Computing in Science and Engineering, 9, 21, doi: 10.1109/MCSE.2007.53
-
[69]
W., Tremblin, P., Baraffe, I., et al
Phillips, M. W., Tremblin, P., Baraffe, I., et al. 2020, A&A, 637, A38, doi: 10.1051/0004-6361/201937381
-
[70]
2022, European Physical Journal Plus, 137, 1206, doi: 10.1140/epjp/s13360-022-03384-1 23
Pinilla, P. 2022, European Physical Journal Plus, 137, 1206, doi: 10.1140/epjp/s13360-022-03384-1 23
-
[71]
2006, A&A, 459, 797, doi: 10.1051/0004-6361:20053275
Pinte, C., M´ enard, F., Duchˆ ene, G., & Bastien, P. 2006, A&A, 459, 797, doi: 10.1051/0004-6361:20053275
-
[72]
Powell, M. J. D. 1964, The Computer Journal, 7, 155, doi: 10.1093/comjnl/7.2.155
-
[73]
Rameau, J., Nielsen, E. L., De Rosa, R. J., et al. 2016, ApJL, 822, L29, doi: 10.3847/2041-8205/822/2/L29
-
[74]
Rebollido, I., Stark, C. C., Kammerer, J., et al. 2024, AJ, 167, 69, doi: 10.3847/1538-3881/ad1759
-
[75]
2008, A&A, 480, 551, doi: 10.1051/0004-6361:20077934
Reche, R., Beust, H., Augereau, J.-C., & Absil, O. 2008, A&A, 480, 551, doi: 10.1051/0004-6361:20077934
-
[76]
B., Rebollido, I., Choquet, ´E., et al
Ren, B. B., Rebollido, I., Choquet, ´E., et al. 2023, A&A, 672, A114, doi: 10.1051/0004-6361/202245458
-
[77]
2016, A&A, 594, A59, doi: 10.1051/0004-6361/201527829
Montesinos, B. 2016, A&A, 594, A59, doi: 10.1051/0004-6361/201527829
-
[78]
2013, A&A, 555, A67, doi: 10.1051/0004-6361/201321506
Riviere-Marichalar, P., Pinte, C., Barrado, D., et al. 2013, A&A, 555, A67, doi: 10.1051/0004-6361/201321506
-
[79]
2012, ApJ, 754, 39, doi: 10.1088/0004-637X/754/1/39
Schneider, A., Melis, C., & Song, I. 2012, ApJ, 754, 39, doi: 10.1088/0004-637X/754/1/39
-
[80]
Schoonenberg, D., & Ormel, C. W. 2017, A&A, 602, A21, doi: 10.1051/0004-6361/201630013
discussion (0)
Sign in with ORCID, Apple, or X to comment. Anyone can read and Pith papers without signing in.