REVIEW 5 major objections 6 minor 28 references
Transformer Vibration Forecasting for Advancing Rail Safety and Maintenance 4.0
T0 review · 5 major / 6 minor · reviewed 2026-08-10 · deepseek-v4-flash
Pith's one-line read The paper claims that a frequency-domain transformer model, SSF, forecasts railway axle vibration signals with a test mean-squared error of 0.5303, about a third of the 1.73285 achieved by its time-domain counterpart.
desk verdict The SSF-vs-SF comparison in Table 3 likely mixes frequency-domain and time-domain MSE, so the paper's headline 3.3x improvement is not established; the dataset and code are real, but the central claim needs clarification and proper baselines. read the letter →
The pith
A machine-rendered reading of the paper's core claim, the machinery that carries it, and where it could break.
The reading
What carries the argument
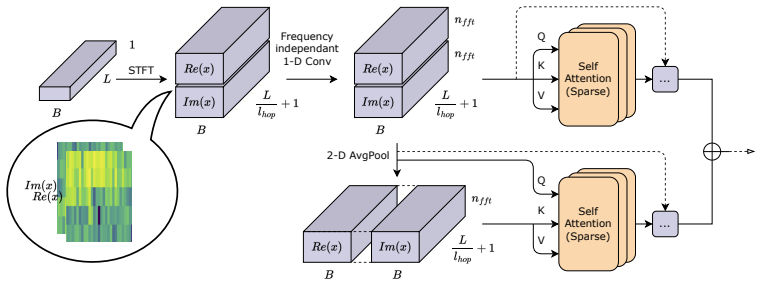
The load-bearing object is the SSF's spectrogram encoder: the input signal is converted to an STFT spectrogram whose real and imaginary parts are treated as separate channels, and the encoder splits attention heads into a high-frequency group working at full resolution and a low-frequency group working on a 2-D average-pooled version (HiLo attention). A global filtering module selectively mutes frequency bands, and a finite-element conditioning step aligns the model with simulated crack signatures. The output is sampled via a reparameterized normal distribution whose variance is drawn from an exponential distribution, a scheme that keeps generated signals close to the mean. Together these parts let the model produce future windows of the spectrogram rather than raw samples, which is what allows it to preserve the spectral content of the vibration.
What would settle it
Run the trained SSF on vibration recorded from an axle in real service, or from the test rig at a speed or load outside the two combinations used in training, and compare its forecasting MSE with the reported test loss; if the error is close to the time-domain SF's 1.73 rather than the reported 0.53, the model's generalization claim is falsified.
Extended reading notes
Core claim
The central claim is that the Spectral ShaftFormer (SSF), a transformer that operates on the short-time Fourier transform of axle vibration and splits its attention into high- and low-frequency branches, forecasts vibration signals substantially more accurately than the time-domain ShaftFormer (SF). Over the three recorded wheelset-assembly datasets, SSF obtains a test loss of 0.5303 while SF obtains 1.73285, and the paper reports that the predicted spectrograms closely match the true ones in both validation and test phases. The model is trained autoregressively in the frequency domain, evaluates its loss on spectrograms, and incorporates an observation model in which the variance of the Gaussian output is itself sampled from an exponential distribution, biasing predictions toward the mean to avoid outliers. The authors also condition SSF on finite-element simulations of cracked-shaft dynamics, so the model is expected to reproduce the harmonic peaks that theory associates with cracks at the rotational speed and its multiples.
Load-bearing premise
The whole claim depends on the laboratory bogie rig—three wheelset assemblies at two constant speeds and loads—and the finite-element crack simulations standing in for real axle vibration under the varied operating conditions the paper says its models cover.
Editorial extensions
If this is right
- Axle vibration spectrograms can be forecast one window at a time with test MSE near 0.53, so the model can serve as a signal simulator for crack scenarios and operating conditions that were never run on the rig.
- Because the model is autoregressive and probabilistic, it can fill gaps in sensor data by predicting the missing windows and preserve the spectral character of the signal.
- Deviations between predicted and observed spectrograms can be flagged as outliers, giving the model a role in real-time anomaly detection and early crack warning.
- The frequency-domain design carries over to the three wheelset assemblies tested and to both rotation directions, indicating that the architecture's gains do not depend on a single dataset.
- The modelling pipeline, from FEM-conditioned training to spectral forecasting, is a step toward a bogie digital twin that can simulate the effect of future damage.
Reading between the lines
- A natural next test is to run SSF on vibration from an axle in real service, since the paper's experiments stop at the laboratory rig; the model's value for predictive maintenance ultimately depends on that transfer.
- The exponential-variance sampling scheme makes the model conservative, so extreme events may be smoothed in forecasts; outlier detection would likely need to be calibrated on the residual distribution instead of on the predicted variance.
- The same spectral-attention recipe could apply to other rotating machinery—wheel bearings, gearboxes, drive shafts—whose faults also show up as harmonics of the rotational frequency, so the method is not obviously rail-specific.
- A direct test of the model's physical understanding would be to forecast the vibration of a crack depth between the trained values (for instance 8 mm) and check whether the rotational-frequency harmonic scales smoothly with depth, as crack theory predicts.
Signed reviews
Editorial analysis
A structured set of objections, weighed in public.
Referee Report
Summary. The paper proposes two deep autoregressive transformer models for forecasting railway axle vibration signals measured on a bogie test rig: ShaftFormer (SF), a time-domain Informer-based model with a locality-enhancement preprocessing step, and Spectral ShaftFormer (SSF), which operates on STFT spectrograms, splits attention into high- and low-frequency groups (HiLo attention), conditions on finite-element (Abaqus) simulation data, and uses an exponential-variance sampling scheme for the predictive normal distribution. The central empirical claim is in Section 3.3 (Table 3): SSF 'significantly outperforms' SF, with test MSE 0.5303 versus 1.73285, and the predicted spectrograms 'closely match' the true ones (Figures 9-12). The abstract further claims that the approach simulates and predicts vibration signals 'under various conditions and fault scenarios,' improving dataset robustness for detection systems. The appendices document TPE-based hyperparameter optimization, positional-encoding ablations, and the differentiable sampling schemes.
Significance. If the central comparison were properly established, SSF would represent a credible application of spectral attention and frequency-domain generative modeling to railway axle condition monitoring, and the open-source implementations (two GitHub repositories) together with a real bogie-rig dataset would be useful community assets. The exponential-variance observation model and global frequency filtering extend the authors' prior spectral attention work (Moreno-Pino et al. 2023) with HiLo attention and FEM conditioning. However, as reported, the evidence consists of a single table with two models, one MSE value per split, no baselines, no repeated-seed variation, and a metric whose domain is ambiguous; the abstract-level claims about simulation, fault-scenario coverage, and detection are not backed by any experiments in the paper. The reproducible artifacts and the experimental dataset are genuine strengths; the empirical demonstration is the weakness.
major comments (5)
- [§2.3, §3.3 (Table 3)] The headline result is not currently measurable because the two models appear to be evaluated on different quantities. Section 2.2 states that SF processes the time-domain signal and uses MSE loss there, while Section 2.3 states for SSF that 'we evaluate the loss function in the frequency domain,' even though the signal is transformed back via iSTFT. Table 3 reports a single 'MSE loss' for each model without stating the domain or the STFT normalization. Time-domain MSE and normalized spectrogram MSE are different quantities, comparable only if the STFT/iSTFT pair is Parseval-tight with identical scaling, and no such statement appears. The claimed 3.27x improvement can therefore be an artifact of representation scale. Please report both metrics in both domains for both models, or state explicitly the exact loss definition and STFT normalization used for each number in Table 3.
- [§3.1 (Figures 9-12)] Figures 9-12 print identical MSE values (0.18 validation, 0.55 test) in both the spectrogram captions and the time-domain captions, with no stated equivalence between the two domains. This is coherent only if the two quantities coincide by construction, which would need to be proved and stated, or if one set of captions is wrong. Please specify which MSE is actually computed and label the domain in each caption; as printed, these figures reinforce rather than resolve the metric ambiguity of Table 3.
- [§3.3 (Table 3)] The statement that SSF 'significantly outperforms' SF is unsupported as stated: each cell is a single run with no error bars or repeated-seed results, no statistical test is performed, and no independent baselines (e.g., ARIMA, LSTM, plain Informer, or the spectral attention model of Moreno-Pino et al. 2023) are included. Given the stochastic sampling scheme and the TPE-based hyperparameter search, run-to-run variation and selection effects could plausibly account for the gap. In addition, SF's test loss (1.73285) is roughly four times its validation loss (0.43524), a generalization drop that the paper neither reports nor discusses; this pattern needs an explanation before the comparison can be interpreted.
- [§1, §3] The abstract and introduction state that the approach reduces the 'high cost of obtaining experimental signals for all scenarios' by simulating and predicting vibration signals 'under various conditions and fault scenarios,' and that this improves 'dataset robustness for more effective detection systems.' However, no results are broken down by crack level (D0-D3), load (4t/10t), or speed (20/50 km/h), and there are no detection or classification experiments anywhere in the paper. Either report condition-wise forecasting results and detection baselines, or revise the claims to match what is actually demonstrated, namely aggregate forecasting on one held-out split of a single test condition.
- [§2.3] The FEM conditioning of SSF is listed as one of the four design contributions, but the manuscript gives no description of how the Abaqus-generated signals enter the model (whether they condition the observation model, the encoder features, the decoder, or something else) and no ablation showing its effect on the reported MSEs. Without an ablation the reader cannot attribute any part of SSF's performance to this component; please add such an experiment or remove the claim from the list of contributions.
minor comments (6)
- [Appendix C, Table C.4] The 'Best Value' for Time Resolution (STFT) is 7, which lies outside the stated search range [8, 16]; correct the table or the range, since out-of-range 'best' values block reproduction of the tuning procedure.
- [Table 2] The 'Damaged Depth (%)' column lists 0.03, 0.06, and 0.08, but 5.7/170 ≈ 3.35%, 10.9/170 ≈ 6.41%, and 15/170 ≈ 8.82%; the column appears to report proportions while being labeled as percentages. Fix the units or the values.
- [Appendix C] The claim that 'The model performs similarly regardless of the used dataset' is given without any per-dataset numbers; report the three WS1/WS2/WS3 results or delete the sentence.
- [§2.2, §2.3] The text is inconsistent about the autoregressive target: Section 2.2 says SF generates a distribution 'over the next value of the signal,' while Section 2.3 says SSF generates a distribution 'over the next time window of the spectrogram'; clarify the prediction horizon and how it maps between the two domains.
- [Appendix B] Figures B.16 and B.17 support a comparison with and without positional encoding, but no quantitative result accompanies the claim that the model 'still performs well' without PE; add the corresponding MSEs or soften the claim.
- [Throughout] The paper contains several language and consistency errors that should be corrected, including 'autorregressive' (should be 'autoregressive'), 'Enhancion' (should be 'Enhancement'), and the mismatch between the test MSE 0.5303 in Table 3 and 0.55 in the captions of Figures 10 and 12, which should be reconciled.
Circularity Check
No circular derivation found; the forecast comparison targets external experimental signals, though the SSF-vs-SF MSE comparison has a metric-domain comparability concern.
full rationale
The paper's central claims are empirical comparisons of autoregressive forecasts against measured axle vibration signals (Figures 9-12, Table 3), not consequences of definitions. The SF and SSF architectures borrow components from prior work (Informer, HiLo attention, spectral attention), including the authors' own Moreno-Pino et al. (2023), but these are design choices stated as such rather than invoked as theorems that force the reported results. The FEM conditioning is an input side mechanism for enriching or conditioning the model; the paper does not claim to predict the FEM output, so no result reduces to a fitted input. The self-citations to the authors' earlier data-collection papers supply experimental data, which is external evidence, not a circular premise. The only substantial concern is that Table 3 reports 'MSE loss' for both SF and SSF while Section 2.2 says SF's loss is time-domain MSE and Section 2.3 says SSF's loss is evaluated in the frequency domain, and Figures 9-12 print identical MSE values for spectrogram and time-domain results without stating the STFT normalization. That issue undermines the comparability of the headline 3.3x improvement, but it is a correctness and interpretation flaw, not a circular derivation: no equation in the paper makes one claimed result equal to its input by construction, and no fitted parameter is renamed as a prediction. Therefore the circularity score is 0.
Assumptions & free parameters
free parameters (15)
- Average Pooling Kernel Size =
15
- Average Pooling Stride =
2
- "Hi" Attention Dilation =
5
- "Lo" Attention Dilation =
14
- Dropout =
0.506
- Freq. Indep. 1-D Conv. Kernel Size =
15
- Number of Heads ("Hi" Attention) =
1
- Number of Heads ("Lo" Attention) =
5
- Time Resolution (STFT) =
7
- Learning Rate =
2.97881e-3
- Mean Kernel Size =
17
- Number of Encoder Layers =
3
- Frequency Resolution =
2
- Time Compression =
3
- Variance Kernel Size =
15
assumptions (6)
- domain assumption Vibration signals recorded from three wheelset assemblies on a bogie test rig at constant load and speed are representative of real railway axle vibration under diverse operating conditions.
- domain assumption Cracks in a rotating shaft produce measurable peaks at rotational speed and its harmonics.
- domain assumption Abaqus FEM model of the Y21 shaft accurately simulates vibration responses for loads and speeds not measured.
- ad hoc to paper The conditional distribution of each future spectrogram window is Normal with variance drawn from an Exponential distribution whose rate is a learned function of input.
- standard math STFT with the chosen time and frequency resolutions preserves the information needed for forecasting, and iSTFT inverts without significant artifacts.
- domain assumption MSE in the frequency domain is an adequate surrogate for forecasting quality relevant to fault detection.
Cite this review
Pith. "Pith review of Transformer Vibration Forecasting for Advancing Rail Safety and Maintenance 4.0." pith.science (2026). https://pith.science/paper/AT7IVVZ5
@misc{pith2026250111730,
  author       = {Pith},
  title        = {Pith review of: Transformer Vibration Forecasting for Advancing Rail Safety and Maintenance 4.0},
  year         = {2026},
  howpublished = {\url{https://pith.science/paper/AT7IVVZ5}},
  note         = {Machine review of arXiv:2501.11730}
}
read the original abstract
Maintaining railway axles is critical to preventing severe accidents and financial losses. The railway industry is increasingly interested in advanced condition monitoring techniques to enhance safety and efficiency, moving beyond traditional periodic inspections toward Maintenance 4.0. This study introduces a robust Deep Autoregressive solution that integrates seamlessly with existing systems to avert mechanical failures. Our approach simulates and predicts vibration signals under various conditions and fault scenarios, improving dataset robustness for more effective detection systems. These systems can alert maintenance needs, preventing accidents preemptively. We use experimental vibration signals from accelerometers on train axles. Our primary contributions include a transformer model, ShaftFormer, designed for processing time series data, and an alternative model incorporating spectral methods and enhanced observation models. Simulating vibration signals under diverse conditions mitigates the high cost of obtaining experimental signals for all scenarios. Given the non-stationary nature of railway vibration signals, influenced by speed and load changes, our models address these complexities, offering a powerful tool for predictive maintenance in the rail industry.
Figures


Figures from the paper (10 more)



Reference graph
Works this paper leans on
-
[1]
write newline
" write newline "" before.all 'output.state := FUNCTION n.dashify 't := "" t empty not t #1 #1 substring "-" = t #1 #2 substring "--" = not "--" * t #2 global.max substring 't := t #1 #1 substring "-" = "-" * t #2 global.max substring 't := while if t #1 #1 substring * t #2 global.max substring 't := if while FUNCTION word.in bbl.in ":" * " " * FUNCTION f...
-
[2]
author Alemi, A. , author Pang, Y. , author Lodewijks, G. , year 2018 . title Experimental validation of multi-sensor data fusion model for railway wheel defect identification . journal Fourth European Conference of the Prognostics and Health Management Society
work page 2018
-
[3]
author Castejón, C. , author Gómez, M. , author García-Prada, J.C. , author Corral, E. , year 2016 . title Energy distribution analysis regarding the crack size in a rotating shaft . journal International Journal of Acoustics and Vibration volume 24 , pages 418--425 . https://doi.org/10.20855/ijav.2019.24.31190, :10.20855/ijav.2019.24.31190
-
[4]
author El Arem, S. , year 2019 . title Nonlinear analysis, instability and routes to chaos of a cracked rotating shaft . journal Nonlinear Dynamics volume 96 , pages 667--683 . https://doi.org/10.1007/s11071-019-04813-0, :10.1007/s11071-019-04813-0
-
[5]
, author Guerrero-L \'o pez, A
author Galdo, A.L. , author Guerrero-L \'o pez, A. , author Olmos, P.M. , author Garc \' a, M.J.G. , year 2023 . title Detecting train driveshaft damages using accelerometer signals and differential convolutional neural networks . journal Engineering Applications of Artificial Intelligence volume 126 , pages 106840
work page 2023
-
[6]
author Gómez, M. , author Castejón, C. , author Corral, E. , author García-Prada, J. , year 2016 a. title Analysis of the influence of crack location for diagnosis in rotating shafts based on 3 x energy . journal Mechanism and Machine Theory volume 103 , pages 167--173 . https://doi.org/10.1016/j.mechmachtheory.2016.05.006, :10.1016/j.mechmachtheory.2016.05.006
-
[7]
author Gómez, M. , author Castejón, C. , author García-Prada, J. , year 2016 b. title Crack detection in rotating shafts based on the 3x energy. analytical and experimental analysis . journal Mechanism and Machine Theory volume 96 , pages 94--106 . https://doi.org/10.1016/j.mechmachtheory.2015.09.009, :10.1016/j.mechmachtheory.2015.09.009
-
[8]
author Gómez, M. , author Castejón, C. , author García-Prada, J.C. , year 2016 c. title Automatic condition monitoring system for crack detection in rotating machinery. journal Reliability Engineering & System Safety volume 152 , pages 239--247 . https://doi.org/10.1016/j.ress.2016.03.013, :10.1016/j.ress.2016.03.013
Show all 28 references
-
[9]
, author Castejón, C
author Gómez, M.J. , author Castejón, C. , author Corral, E. , author Cocconcelly, M. , year 2023 . title Railway axle early fatigue crack detection through condition monitoring techniques . journal Sensors volume 23 , pages 6143 . https://doi.org/10.3390/s23136143, :10.3390/s23136143
2023 doi
-
[10]
, author Castejón, C
author Gómez, M.J. , author Castejón, C. , author Corral, E. , author García-Prada, J.C. , year 2020 . title Railway axle condition monitoring technique based on wavelet packet transform features and support vector machines . journal Sensors volume 20 , pages 3575 . https://do...
2020 doi
-
[11]
, et al., year 2018
author Gómez, M.J. , et al., year 2018 . title Effective crack detection in railway axles using vibration signals and wpt energy . journal Sensors (Basel, Switzerland) volume 18 , pages 1603 . :10.3390/s18051603
2018 doi
-
[12]
, author Bruni, S
author Hassan, M. , author Bruni, S. , author Carboni, M. , year 2016 . title Crack detection in railway axle using horizontal and vertical vibration measurements . journal 7th IET Conference on Railway Condition Monitoring 2016
2016
-
[13]
, author Ram, O
author Haviv, A. , author Ram, O. , author Press, O. , author Izsak, P. , author Levy, O. , year 2022 . title Transformer language models without positional encodings still learn positional information . journal ArXiv volume abs/ 2203.16634
2022 arXiv
-
[14]
, author Welling, M
author Kingma, D.P. , author Welling, M. , year 2013 . title Auto-encoding variational bayes . journal arXiv preprint arXiv:1312.6114
2013 arXiv
-
[15]
, author Ong, C.S
author Krummenacher, G. , author Ong, C.S. , author Koller, S. , author Kobayashi, S. , author Buhmann, J.M. , year 2018 . title Wheel defect detection with machine learning . journal IEEE Transactions on Intelligent Transportation Systems volume 19 , pages 1176--1187 . :10.11...
2018
-
[16]
, author Whitney, W.F
author Kulkarni, T.D. , author Whitney, W.F. , author Kohli, P. , author Tenenbaum, J. , year 2015 . title Deep convolutional inverse graphics network . journal Advances in neural information processing systems volume 28
2015
-
[17]
, author Parikh, D
author Li, H. , author Parikh, D. , author He, Q. , author Qian, B. , author Li, Z. , author Fang, D. , author Hampapur, A. , year 2014 . title Improving rail network velocity: A machine learning approach to predictive maintenance . journal Transportation Research Part C: Emer...
2014
-
[18]
, author Olmos, P.M
author Moreno-Pino, F. , author Olmos, P.M. , author Art \'e s-Rodr \' guez, A. , year 2023 . title Deep autoregressive models with spectral attention . journal Pattern Recognition volume 133 , pages 109014
2023
-
[19]
, author Cai, J
author Pan, Z. , author Cai, J. , author Zhuang, B. , year 2022 . title Fast vision transformers with hilo attention , in: editor Koyejo, S. , editor Mohamed, S. , editor Agarwal, A. , editor Belgrave, D. , editor Cho, K. , editor Oh, A. (Eds.), booktitle Advances in Neural In...
2022
-
[20]
, author Bruni, S
author Rolek, P. , author Bruni, S. , author Carboni, M. , year 2016 . title Condition monitoring of railway axles based on low frequency vibrations . journal International Journal of Fatigue volume 86 , pages 88--97 . https://doi.org/10.1016/j.ijfatigue.2015.07.004, :10.1016/...
2016 doi
-
[21]
, author Sener, B
author Serin, G. , author Sener, B. , author Ozbayoglu, A.M. , author Unver, H.O. , year 2020 . title Review of tool condition monitoring in machining and opportunities for deep learning . journal The International Journal of Advanced Manufacturing Technology volume 109 , page...
2020 doi
-
[22]
, author Remenyte-Prescott, R
author Vagnoli, M. , author Remenyte-Prescott, R. , author Andrews, J. , year 2018 . title Railway bridge structural health monitoring and fault detection: State-of-the-art methods and future challenges . journal Structural Health Monitoring volume 17 , pages 971--1007 . https...
2018 doi
-
[23]
, author Shazeer, N
author Vaswani, A. , author Shazeer, N. , author Parmar, N. , author Uszkoreit, J. , author Jones, L. , author Gomez, A.N. , author Kaiser, . , author Polosukhin, I. , year 2017 . title Attention is all you need . journal Advances in neural information processing systems volume 30
2017
-
[24]
, author Men, T
author Wang, H. , author Men, T. , author Li, Y.F. , year 2022 . title Transformer for high-speed train wheel wear prediction with multiplex local–global temporal fusion . journal IEEE Transactions on Instrumentation and Measurement volume 71 , pages 1--12 . :10.1109/TIM.2022.3154827
2022
-
[25]
, author Taylor, J
author Wang, W. , author Taylor, J. , author Rees, R.J. , year 2021 . title Recent advancement of deep learning applications to machine condition monitoring part 1: A critical review . journal Acoustics Australia volume 49 , pages 207--219 . https://doi.org/10.1007/s40857-021-...
2021 doi
-
[26]
, author Zhu, B
author Ye, Y. , author Zhu, B. , author Huang, P. , author Peng, B. , year 2022 . title Oornet: A deep learning model for on-board condition monitoring and fault diagnosis of out-of-round wheels of high-speed trains . journal Measurement volume 199 , pages 111268 . https://www...
2022
-
[27]
, author Yan, R
author Zhao, R. , author Yan, R. , author Chen, Z. , author Mao, K. , author Wang, P. , author Gao, R.X. , year 2019 . title Deep learning and its applications to machine health monitoring . journal Mechanical Systems and Signal Processing volume 115 , pages 213--237 . https:/...
2019 doi
-
[28]
, author Zhang, S
author Zhou, H. , author Zhang, S. , author Peng, J. , author Zhang, S. , author Li, J. , author Xiong, H. , author Zhang, W. , year 2021 . title Informer: Beyond efficient transformer for long sequence time-series forecasting , in: booktitle Proceedings of the AAAI conference...
2021
Reviewed August 10, 2026 · model on record in the stance chip above.
Discussion (0). Continue with ORCID to comment.