REVIEW 3 major objections 6 minor 1 cited by
The Growing Impact of Unintended Starlink Broadband Emission on Radio Astronomy in the SKA-Low Frequency Range
T0 review · 3 major / 6 minor · reviewed 2026-08-07 · deepseek-v4-flash
Pith's one-line read Starlink's unintended radio emission now pervades the SKA-Low band and may be bright enough to block the detection of the Epoch of Reionisation.
desk verdict Largest Starlink UEMR survey to date; the qualitative result is solid, but the headline numbers need an audit of the TLE-matching pipeline before they are used in regulatory claims. read the letter →
The pith
A machine-rendered reading of the paper's core claim, the machinery that carries it, and where it could break.
The reading
What carries the argument
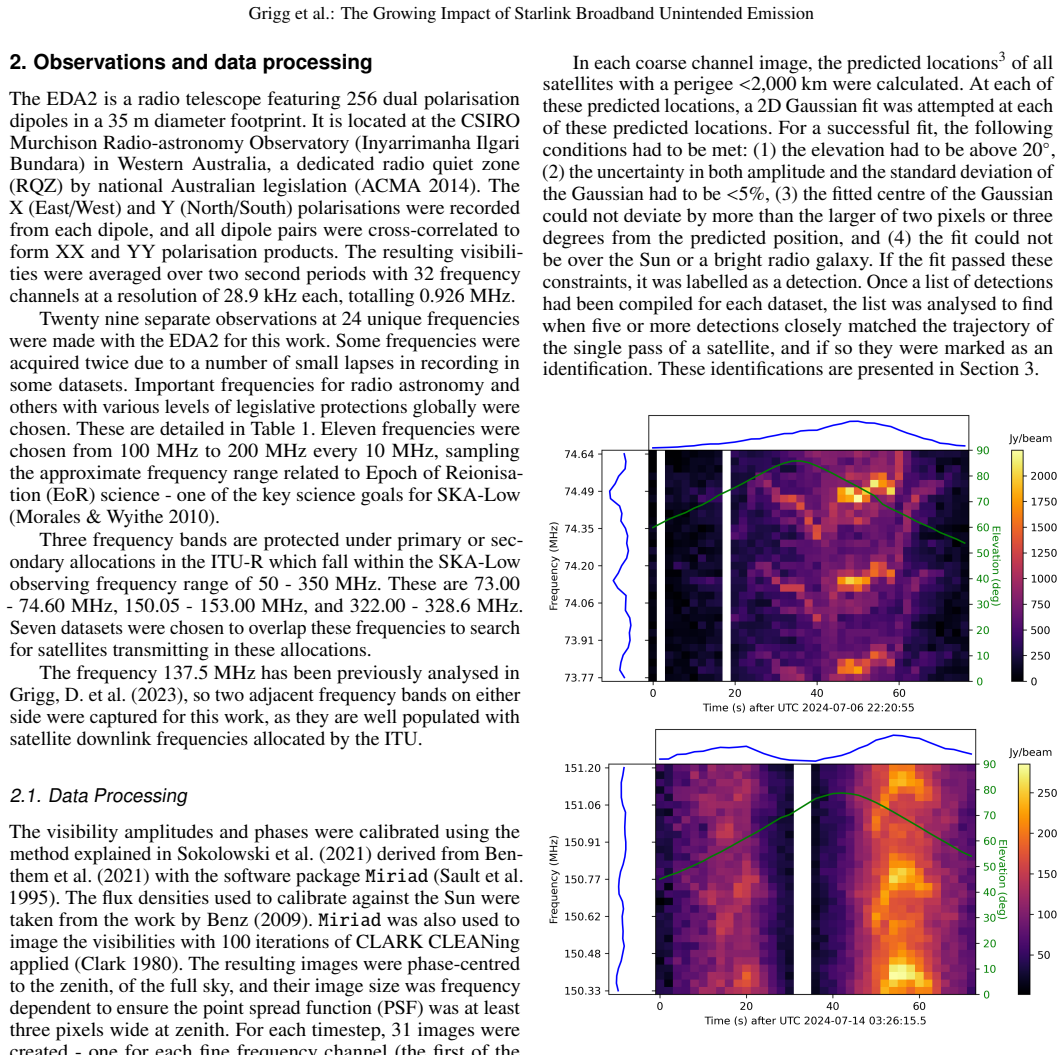
The load-bearing instrument is the Engineering Development Array 2, a 256-dipole SKA-Low prototype that images the whole sky, horizon to horizon, without beamforming. The load-bearing method is an autonomous detection-and-identification pipeline: for every coarse-channel image, predicted positions of all satellites below 2,000 km perigee are calculated from orbital elements; a 2D Gaussian is fit at each predicted location subject to strict criteria; detections are promoted to identifications only when five or more fits match a single predicted satellite pass. This pipeline converts raw images into a catalogue of verified satellite events with measured flux densities, polarisation, and spectral structure, and its output underpins every prevalence and flux statistic in the paper.
What would settle it
Rerun the same 76 million images through a blind moving-source finder that does not use predicted satellite positions; if the blind search does not recover roughly 112,000 detections and sky-averaged flux near 93 Jy/beam, the identification pipeline is biased. Alternatively, a single deep, well-calibrated observation of a field with and without predicted Starlink passes could directly measure the added sky flux and test whether it approaches 93 Jy/beam.
Extended reading notes
Core claim
The paper's central discovery is that unintended electromagnetic radiation from Starlink satellites is now pervasive across 73-235 MHz, not confined to orbit-raising manoeuvres. The survey identifies 1,806 unique satellites, dominated by v2-mini Ku and v2-mini Direct-to-Cell models, with 76% and 71% of those populations detected respectively. It finds both broadband leakage and narrowband intended downlink pulses, including 13 satellites in the 73.00-74.60 MHz protected band and 703 in the 150.05-153.00 MHz protected band, plus four cases of terrestrial FM reflections off satellite structures at 99.70 MHz. The broadband emission shows anti-correlated flux in orthogonal polarisations and a time-varying comb-like spectral structure. Because the mean sky flux density from this UEMR is at least 93 Jy/beam, roughly five orders above the 1 mJy threshold that could overwhelm EoR integration, the authors conclude this emission alone could prevent detection of the Epoch of Reionisation.
Load-bearing premise
The entire quantitative picture rests on the assumption that the TLE-based trajectory matching correctly identifies which detections belong to which Starlink satellite; if the predicted positions are wrong or the five-detection match rule is too strict or too lax, the reported counts, image fractions, and flux-density averages would be systematically off.
Editorial extensions
If this is right
- At 161.7 and 170.5 MHz, roughly 30% of images contain at least one identifiable Starlink satellite, and the authors note the true fraction is likely higher because detection criteria were set conservatively to avoid misidentifications.
- A mean sky flux density of at least 93 Jy/beam from Starlink UEMR is about five orders of magnitude above the level estimated to overwhelm Epoch of Reionisation power-spectrum integration, so this UEMR alone could prevent EoR detection with SKA-Low.
- Starlink satellites are transmitting in ITU-protected radio astronomy bands, with 13 unique v2-mini Ku satellites in 73.00-74.60 MHz and 703 unique v2-mini satellites in 150.05-153.00 MHz.
- No Starlink satellites were detected above 320 MHz, which may constrain the upper frequency limit of the broadband UEMR.
- Open release of the identification catalogue gives regulators and operators a quantitative baseline for tracking future changes in this emission.
Reading between the lines
- If the UEMR per satellite stays constant while the constellation grows, the sky-averaged 93 Jy/beam floor and the ~30% image contamination rate will rise with the number of satellites; the released catalogue makes this trend directly measurable in follow-up surveys.
- The time-varying comb-like spectral structure and anti-correlated polarisation may point to a specific on-board electronic source, such as a clock harmonic or switching regulator; if identified, shielding or filtering that component could reduce UEMR without redesigning the whole satellite.
- The FM-reflection detections imply that even a fully electromagnetically quiet satellite could still produce episodic narrowband interference for radio telescopes by reflecting terrestrial transmitters, so mitigation strategies may need to consider satellite attitude and surface geometry, not just onboard emission.
Editorial analysis
A structured set of objections, weighed in public.
Referee Report
Summary. This manuscript presents a survey of Starlink satellite emission using the EDA2 prototype station at the SKA-Low site, analyzing ~76 million full-sky images from 29 separate ~24-hour observations at 24 frequencies between 73 and 235 MHz. The authors report 112,534 individual detections of 1,806 unique Starlink satellites, with up to ~30% of images contaminated in some datasets, and a mean sky flux density of 93 Jy/beam from unintended broadband emission, which they compare to the Wilensky et al. (2020) threshold for EoR power-spectrum corruption. They also report detections in ITU-protected radio astronomy bands, reflections of terrestrial FM radio off satellite surfaces, and anti-correlated XX/YY polarization behavior. The catalog and data products are made publicly available via Zenodo.
Significance. If the quantitative claims hold, this is an important and timely result for radio astronomy and spectrum policy. The survey is the largest of its kind, provides open data products, and systematically extends prior EDA2 and LOFAR work across the SKA-Low band. The qualitative detection of broadband unintended electromagnetic radiation (UEMR) across 73–235 MHz is strongly supported by the waterfall plots and is consistent with previous studies. The paper's main quantitative claims—the high fraction of contaminated images and the 93 Jy/beam mean flux—need the pipeline validation described below, but the overall phenomenon is not in doubt.
major comments (3)
- [Section 2.1] The criterion for promoting detections to identifications—'five or more detections closely matched the trajectory of the single pass'—is not defined: no matching tolerance, time window, or goodness-of-fit threshold is given. Because the headline numbers (112,534 detections, 1,806 unique satellites, per-dataset image fractions, and the 93 Jy/beam mean) are all products of this pipeline, the paper should state the matching algorithm explicitly and provide a false-positive/recovery analysis (e.g., by running the pipeline with scrambled or time-shifted TLE positions, or with injected synthetic sources). Without this, the quantitative results are not fully auditable.
- [Abstract and Section 3 (protected-band counts)] The abstract states that 703 satellites were identified between 150.05 and 153.00 MHz, but the 153.13 MHz dataset in Table 1 is centered outside that protected band. If that dataset is included in the 703 count, the wording is misleading; if excluded, the paper should clarify. The same issue affects the statement in Section 3 (Discussion), and the 153.13 MHz dataset's partial spectral overlap with the 150.05–153.00 MHz band should be described explicitly (or the abstract corrected).
- [Section 3 (mean flux density)] The 93 Jy/beam figure is presented as a 'mean' in the Results but as a 'lower limit' in the Discussion, and no uncertainty is given. The text should specify how images with no detections are handled in the average, why the 136.7 MHz and >320 MHz datasets are excluded, and what uncertainty (e.g., from dataset-to-dataset scatter or fitting errors) applies. The comparison to the Wilensky et al. (2020) 1 mJy threshold depends directly on this number, so a quantitative uncertainty or a conservative bound is needed.
minor comments (6)
- [Section 2.1] The equation for the 1-D Gaussian contains a mismatched bracket in the text ('A·exp[− (ν−ν0)^2 / 2σ^2]'); please format it properly as A·exp(−(ν−ν0)^2/(2σ^2)).
- [Table 1] The 'Total' row appears misaligned: '2446692' is not labeled as the total timestep count, and the unique NORAD totals are omitted; please format the table so each column has a clear entry in the total row.
- [Figure 3 caption] The caption says 'the bottom line showing the median of all datasets'; this should be clarified to 'the median of the per-dataset median noise values' to avoid ambiguity.
- [Section 3 (Starlink models)] The 76% (v2-mini Ku) and 71% (v2-mini DTC) identification fractions are compared to the total in orbit on the final day of acquisition, but detections span 29 days during which the constellation grew by 477 satellites; please state whether the comparison is over the full survey period or the last day, and discuss the potential bias.
- [Section 3.4 (reflections)] The claim that the FM reflection originates from a 10 kW transmitter in Geraldton would be strengthened by providing the transmitter's frequency, the expected Doppler shift, and a calculation of the reflection geometry for at least one of the four passes.
- [Section 3 (comparison with other studies)] The paper notes that no v1.0 satellites were detected, but does not discuss possible reasons (e.g., deorbiting, frequency coverage, or sensitivity); a brief comment would help the reader reconcile this with Bassa et al. (2024) and Di Vruno et al. (2023).
Circularity Check
No circularity: headline statistics are direct observational measurements, not derivations from fitted inputs or self-cited uniqueness claims.
full rationale
The paper reports an observational survey of Starlink emission and every central quantity is a measured statistic from EDA2 images rather than a quantity derived from a fitted parameter or from a self-cited theorem. Detection and identification are explicitly operationalised in Section 2.1 (elevation >20 degrees, <5% uncertainty on the fitted Gaussian amplitude and width, centroid within the larger of two pixels or three degrees of the TLE-predicted position, exclusion of the Sun/bright radio galaxy, and at least five detections matching a satellite pass). These thresholds are hand-chosen acceptance criteria, not parameters fit to the data and then renamed as predictions. The 93 Jy/beam figure is a direct mean of measured per-identification flux densities divided by timesteps and polarisations, and it is explicitly qualified as a lower limit with caveats in Section 4. Its comparison to the Wilensky et al. (2020) threshold is an external benchmark. Self-citations (Grigg et al. 2024 for the detection pipeline; Sokolowski et al. 2021 for calibration; prior EDA2 detections) point to methods and earlier observations; they are not used as proof of the current result. The paper is also checked against independent LOFAR work (Di Vruno et al. 2023; Bassa et al. 2024), and the final data products are released publicly. Potential concerns about TLE accuracy or the absence of a measured false-positive rate are robustness/validation issues, not circularity, because no claim is defined in terms of an output variable it is supposed to predict. Hence no specific circular step can be exhibited.
Assumptions & free parameters
free parameters (4)
- Gaussian fit uncertainty threshold =
<5%
- minimum elevation cutoff =
20 degrees
- minimum detections per pass =
5
- narrowband classification thresholds =
sigma < 28.9 kHz, R2 > 0.95
assumptions (4)
- domain assumption TLE orbital elements from space-track.org accurately predict satellite positions to within the fitting tolerance of two pixels or three degrees.
- domain assumption The Sun-based flux calibration from Sokolowski et al. (2021) and Benz (2009) provides an accurate absolute flux density scale.
- domain assumption The EDA2 antenna sensitivity is significantly diminished above 300 MHz, explaining the lack of detections in the 322-328.6 MHz protected band.
- domain assumption The Wilensky et al. (2020) estimate that 1 mJy of RFI can overwhelm EoR power spectrum integration applies to the diffuse, time-variable Starlink UEMR observed here.
Cite this review
Pith. "Pith review of The Growing Impact of Unintended Starlink Broadband Emission on Radio Astronomy in the SKA-Low Frequency Range." pith.science (2026). https://pith.science/paper/BDCNQLBW
@misc{pith2026250602831,
  author       = {Pith},
  title        = {Pith review of: The Growing Impact of Unintended Starlink Broadband Emission on Radio Astronomy in the SKA-Low Frequency Range},
  year         = {2026},
  howpublished = {\url{https://pith.science/paper/BDCNQLBW}},
  note         = {Machine review of arXiv:2506.02831}
}
read the original abstract
We present the largest survey to date characterising intended and unintended emission from Starlink satellites across the SKA-Low frequency range. This survey analyses ~76 million full sky images captured over ~29 days of observing with an SKA-Low prototype station - the Engineering Development Array 2 - at the site of SKA-Low. We report 112,534 individual detections of 1,806 unique Starlink satellites, some emitting broadband emission and others narrowband emission. Our analysis compares observations across different models of Starlink satellite, with 76% of all v2-mini Ku and 71% of all v2-mini Direct to Cell satellites identified. It is shown that in the worst cases, some datasets have a detectable Starlink satellite in ~30% of all images acquired. Emission from Starlink satellites is detected in primary and secondary frequency ranges protected by the International Telecommunication Union, with 13 satellites identified between 73.00 - 74.60 MHz and 703 identified between 150.05 - 153.00 MHz. We also detect the reflections of terrestrial FM radio off different models of Starlink satellites at 99.70 MHz. The polarisation of the broadband emission shows the flux density of two orthogonal polarisations is anti-correlated with temporally shifting spectral structure observed. We compare our results to previous EDA2 and LOFAR results and provide open public access to our final data products to assist in quantifying future changes in this emission.
Figures


Figures from the paper (2 more)


Forward citations
Cited by 1 Pith paper
-
The Lunar Farside Transients and Technology Telescope (LFT3) Mission
Proposes a $150M-class lunar farside radio telescope (LFT3) to survey 0.1–2700 MHz in the RFI-pristine shielded zone before lunar-orbital interference closes the window.
Reference graph
Works this paper leans on
-
[1]
2014, MS32: Mid West Radio Quiet Zone, Official Document Astropy Collaboration, Price-Whelan, A
ACMA. 2014, MS32: Mid West Radio Quiet Zone, Official Document Astropy Collaboration, Price-Whelan, A. M., Sip˝ocz, B. M., et al. 2018, AJ, 156, 123
work page 2014
-
[2]
G., Di Vruno, F., Winkel, B., et al
Bassa, C. G., Di Vruno, F., Winkel, B., et al. 2024, A&A, 689, L10
work page 2024
-
[3]
Benthem, P., Wayth, R., de Lera Acedo, E., et al. 2021, A&A, 655, A5
work page 2021
-
[4]
Benz, A. O. 2009, Springer, 4B, 103
work page 2009
-
[5]
Clark, B. G. 1980, A&A, 89, 377 Di Vruno, F., Winkel, B., Bassa, C. G., et al. 2023, A&A, 676, A75
work page 1980
- [6]
- [7]
-
[8]
2022, Astronomy and Com- puting, 40, 100619
Grigg, D., Tingay, S., Sokolowski, M., & Wayth, R. 2022, Astronomy and Com- puting, 40, 100619
work page 2022
Show all 25 references
-
[9]
J., Sokolowski, M., et al
Grigg, D., Tingay, S. J., Sokolowski, M., et al. 2023, A&A, 678, L6
2023
-
[10]
J., Trott, C
Hancock, P. J., Trott, C. M., & Hurley-Walker, N. 2018, Publications of the Astronomical Society of Australia, 35, e011
2018
-
[11]
2019, in 2019 IEEE Radar Conference (RadarConf), 1–6
Hennessy, B., Tingay, S., Hancock, P., et al. 2019, in 2019 IEEE Radar Conference (RadarConf), 1–6
2019
-
[12]
2024, in 2024 International Radar Symposium (IRS), 408–413
Jedrzejewski, K., Pozoga, M., Wojtowicz, P., et al. 2024, in 2024 International Radar Symposium (IRS), 408–413
2024
-
[13]
2021, arXiv e-prints, arXiv:2111.09735
Mallama, A. 2021, arXiv e-prints, arXiv:2111.09735
2021 arXiv
-
[14]
Morales, M. F. & Wyithe, J. S. B. 2010, ARA&A, 48, 127
2010
-
[15]
R., Wayth, R
Offringa, A. R., Wayth, R. B., Hurley-Walker, N., et al. 2015, Publications of the Astronomical Society of Australia, 32, e008
2015
-
[16]
Prabu, S., Hancock, P., Zhang, X., & Tingay, S. J. 2020, PASA, 37, e052
2020
-
[17]
2019, Skyfield: High precision research-grade positions for planets and Earth satellites generator
Rhodes, B. 2019, Skyfield: High precision research-grade positions for planets and Earth satellites generator
2019
-
[18]
J., Teuben, P
Sault, R. J., Teuben, P. J., & Wright, M. C. H. 1995, in Astronomical Society of the Pacific Conference Series, V ol. 77, Astronomical Data Analysis Software and Systems IV , ed. R. A. Shaw, H. E. Payne, & J. J. E. Hayes, 433
1995
-
[19]
& Dougherty, S
Siringo, G. & Dougherty, S. 2023, ALMA Spectrum and Radio Frequency Inter- ference, Whitepaper
2023
-
[20]
B., Bhat, N
Sokolowski, M., Wayth, R. B., Bhat, N. D. R., et al. 2021, Publications of the Astronomical Society of Australia, 38, e023
2021
-
[21]
J., Goeke, R., Bowman, J
Tingay, S. J., Goeke, R., Bowman, J. D., et al. 2013, PASA, 30, e007
2013
-
[22]
J., Sokolowski, M., Wayth, R., & Ung, D
Tingay, S. J., Sokolowski, M., Wayth, R., & Ung, D. 2020, PASA, 37, e039
2020
-
[23]
A., Ivezi´c, Ž., Bradshaw, A., et al
Tyson, J. A., Ivezi´c, Ž., Bradshaw, A., et al. 2020, AJ, 160, 226 van der Walt, S., Colbert, S., & Varoquaux, G. 2011, Computing in Science & Engineering, 13, 22 van Haarlem, M. P., Wise, M. W., Gunst, A. W., et al. 2013, A&A, 556, A2
2020
-
[24]
2021, The Engineering Develop- ment Array 2: design, performance and lessons from an SKA-Low prototype station
Wayth, R., Sokolowski, M., Broderick, J., et al. 2021, The Engineering Develop- ment Array 2: design, performance and lessons from an SKA-Low prototype station
2021
-
[25]
J., Barry, N., Morales, M
Wilensky, M. J., Barry, N., Morales, M. F., Hazelton, B. J., & Byrne, R. 2020, MNRAS, 498, 265 Article number, page 8 of 8
2020
Reviewed August 7, 2026 · model on record in the stance chip above.
Discussion (0). Sign in to comment.