REVIEW 3 major objections 5 minor 4 cited by
SymbolFit: Automatic Parametric Modeling with Symbolic Regression
T0 review · 3 major / 5 minor · reviewed 2026-08-12 · deepseek-v4-flash
Pith's one-line read SymbolFit claims that one generic symbolic-regression configuration can automatically produce parametric background models, complete with uncertainties, that match hand-tuned empirical fits across five LHC search spectra.
desk verdict A genuinely useful, well-tested tool for automating parametric fits in HEP, with the main caveat that the uncertainty bands are never calibrated against coverage. read the letter →
The pith
A machine-rendered reading of the paper's core claim, the machinery that carries it, and where it could break.
The reading
What carries the argument
The load-bearing mechanism is genetic-programming symbolic regression, in which candidate functions are expression trees over a fixed operator set and the functional form itself is the search variable, followed by a re-optimization fit in which each discovered function is frozen and its constants re-fitted by nonlinear least squares; the covariance matrix of that fit provides the uncertainty estimates. The same search configuration, an operator set plus nesting constraints and a maximum complexity, is applied across datasets, with only the random seed changed to generate a diverse batch of candidates. A chi-square loss with separate up/down bin uncertainties guides both the search and the re-fit.
What would settle it
Run the framework many times on pseudodata sampled from a known smooth distribution that is deliberately outside the operator set, then count how often the true curve lies inside the reported 68% uncertainty band. Empirical coverage substantially below 68% would show that the covariance-based uncertainty model is miscalibrated, breaking the claim of simultaneous uncertainty estimation.
Extended reading notes
Core claim
The paper's core claim is that symbolic regression with a fixed, simple configuration can stand in for the traditional empirical procedure of guessing and refining a functional form. For each dataset, a single run of the framework returns a batch of candidate closed-form functions; each function is then frozen and its constant parameters re-fitted by nonlinear least squares, yielding best-fit values, correlations, and uncertainty bands. On blinded pseudodata built from the published dijet spectrum with an injected Gaussian signal, three runs with different random seeds produce background models whose goodness-of-fit and extracted signal parameters are comparable to the empirical model used in the original search. The authors claim the same configuration transfers to other distributions of different shapes without retuning, and that the closed-form output slots directly into standard statistical tools for hypothesis testing.
Load-bearing premise
The uncertainty estimate is the covariance matrix of a least-squares re-fit of the frozen functional form, so the entire uncertainty model rests on the assumption that the discovered function family is close enough to the true distribution for that covariance to capture the modeling error; the paper never tests whether the reported 68% bands actually contain the true distribution at the claimed rate.
Editorial extensions
If this is right
- Background models for resonance searches can be produced automatically from binned data, removing the manual trial-and-error step that currently consumes significant analyst effort.
- The same fit configuration can be reused across channels and analyses, so modeling does not need to be re-derived whenever detector conditions or event selections change the data shape.
- Because the output is a batch of closed-form functions with uncertainties, the choice of function can be treated as a discrete systematic, and the templates integrate directly with existing hypothesis-testing tools.
- Multi-dimensional binned data, such as scale-factor parameterizations in two variables, can be modeled without hand-constructing polynomial ansatze.
- A single run routinely produces candidates spanning a range of fit qualities, giving downstream analyses flexibility in trading fit quality against complexity.
Reading between the lines
- The paper does not calibrate the coverage of its uncertainty bands; an obvious test would be to generate pseudodata from a known smooth distribution, run the framework, and check whether the reported 68% intervals contain the true values at the claimed rate.
- Because the search minimizes chi-square on the binned data, the candidate pool may overfit in regions of low statistics; selecting among candidates purely by goodness of fit could introduce selection bias, which the discrete-profiling treatment would mitigate.
- A natural extension would be to treat the batch of candidate functions from a single run as a model-averaged background with empirically calibrated coverage, rather than picking one function.
- The same recipe could generalize beyond collision physics to any binned data where a smooth empirical description with uncertainties is needed, such as detector corrections in other fields.
Signed reviews
Editorial analysis
A structured set of objections, weighed in public.
Referee Report
Summary. The paper introduces SymbolFit, a Python framework that combines symbolic regression (via PySR) with a nonlinear least-squares re-optimization step (via LMFIT) to produce parametric fits of binned data together with uncertainty estimates. The framework is demonstrated on several toy datasets and on five real LHC invariant-mass spectra (dijet, diphoton, trijet, paired-dijet, and dimuon), where the resulting functions are compared with the empirical functions used by CMS. In addition, the authors perform signal-injection studies: background models are fitted on pseudodata with the signal region blinded, and then used to extract an injected Gaussian signal from the unblinded spectrum. The central claim is that a simple, largely configuration-free SR setup can automate the manual process of empirical function selection while also providing uncertainty estimates suitable for downstream statistical inference.
Significance. If the claimed capabilities hold, SymbolFit would be a genuinely useful tool for HEP data analysis, potentially reducing the manual effort in background and signal modeling. The paper's strengths include a public API, the use of five real LHC datasets with comparison to official CMS empirical functions, genuine out-of-sample validation through blinded signal injection, and a demonstration on multi-dimensional toy data. The re-optimization step clearly improves the initial SR fits. However, the central added value over plain symbolic regression—uncertainty estimation—is not validated by any coverage or calibration test, which is a substantial gap given the intended use in statistical inference.
major comments (3)
- [Sec. 4] The 68% uncertainty bands are obtained by sampling parameters from the LMFIT covariance matrix of the frozen functional form, but the paper never checks whether these bands actually cover the true distribution at the claimed rate. The toy datasets are explicitly described as generated 'without reference to an underlying function' (Sec. 5.1, Fig. 3 caption), so they cannot serve as ground truth for coverage; for the real LHC datasets the true background is unknown. The signal-injection studies validate signal extraction, but they assess point estimates of injected signal parameters and do not test the coverage of the background-model bands themselves. Since the abstract claims that the framework provides 'uncertainty estimates in a single run' and Sec. 3 states that parametric models without well-defined uncertainties cannot be used in HEP statistical inference, the lack of any calibration test for the uncertainty bands is a load-bearing gap. The authors should add ensemble-based coverage checks (for example, fitting to pseudodata generated from a known analytic function and measuring the empirical coverage of the reported 68% intervals, or performing posterior-predictive checks on toy data with a known ground truth).
- [Sec. 5.2] The claim that the same fit configuration can be applied to distributions of different shapes, with only the random seed varied, is contradicted by the experimental setup. For the diphoton and dimuon datasets, the manuscript states that the maximum complexity is reduced from 80 to 20 (A.2 and A.5), and Sec. 5.2 notes 'variations in the maximum complexity values' for Toy Dataset 2. This means the configuration is not actually identical across all demonstrations. Since the abstract and Sec. 3 explicitly rest the flexibility claim on a single simple configuration, the authors should either (i) restrict the claim to the operator set and loss function, treating maxsize as a user-tunable parameter, or (ii) provide at least one additional demonstration where a fully identical configuration, including maxsize, is used across several different distribution shapes.
- [Sec. 5.2] The signal extraction validation is reported only qualitatively: the text states that fitted signal parameters are 'within reasonable uncertainties' and shows residual plots, but no quantitative pull distributions, bias values, or coverage statistics are provided. For a method intended to feed into statistical inference, the calibration of the fitted signal parameters (e.g., the mean and width of the pull distribution, or the fraction of fits where the true injected value lies within the reported 1σ interval) should be quantified and compared with the empirical model. This would also provide indirect evidence about whether the uncertainties from the SR models are trustworthy.
minor comments (5)
- [Sec. 5.2] The text refers to 'Fig. A15' for the dijet signal extraction study, but the corresponding figure is Fig. 11; the same figure number is later used for the paired-dijet extraction in Appendix A.4, which will confuse readers.
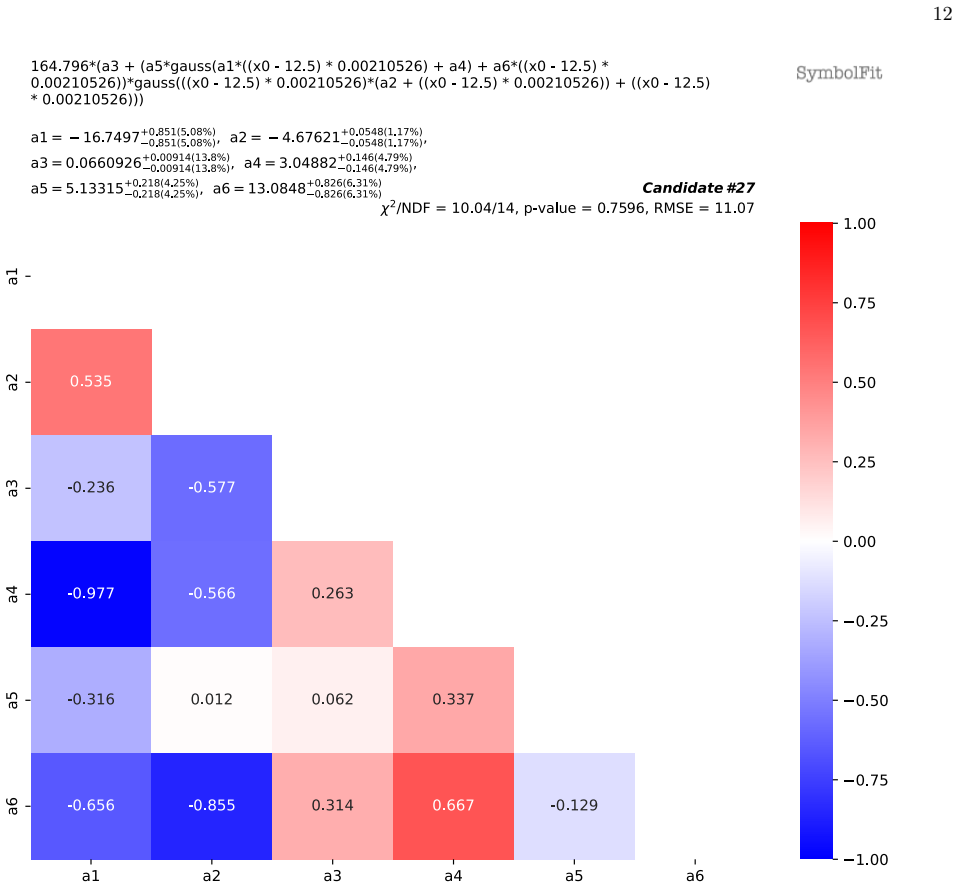
- [Sec. 5.1] The transformation for Toy Dataset 1 is given as f(x) → 165 × f(0.00211(x − 12.5)), but the reader is not told what the variable x represents in the fitted, scaled dataset; defining x as the scaled mass variable explicitly would improve reproducibility.
- [All tables] The notation for the chi-square statistic is inconsistent across tables and text (for example, 'χ2/NDF' and 'χ2/NDF'); please unify the formatting.
- [Figure captions] The phrase 'ratio of the 68% quantile range to the mean' is ambiguous; it should be clarified as the relative uncertainty, i.e., the width of the band divided by the mean function value.
- [Abstract] The abstract states that the framework provides uncertainty estimates 'in a single run', but the demonstrated workflow uses multiple random seeds and selects a candidate function from each batch; please clarify that a single configuration, run multiple times with different seeds, is what is meant.
Circularity Check
No significant circularity: the prediction tests are genuine blinded signal injections against external CMS data, and the self-citations are not load-bearing.
full rationale
The paper's derivation chain has no step that reduces to its own inputs by construction. SymbolFit uses symbolic regression to search functional forms minimizing the chi-squared in Eq. 3, then performs a re-optimization fit (ROF) of the frozen forms using the same chi-squared objective and reports the LMFIT covariance as the uncertainty estimate. This is a standard fit-and-uncertainty procedure, not a prediction; the uncertainty bands are presented as parametric fit uncertainties, not as a calibrated coverage claim. The central validation tests are genuine out-of-sample exercises: background models are fit on pseudodata with the signal region blinded, and the injected signal is then extracted from the unblinded data. Those fitted signal parameters are compared with their injected values, so the claimed signal-extraction capability does not reduce to a fitted input. The toy datasets are generated by hand without an underlying function, so they cannot validate coverage, but the paper does not claim a coverage-calibration result. The self-citations (Refs. 6 and 12) are related-work references and are not load-bearing; PySR (Ref. 5) is used as a tool, and the framework's wrapper and validation are independently demonstrated against external CMS datasets. No equation or claimed result is equivalent to its input by definition, and no fitted parameter is renamed as a prediction. Therefore no circular step is present.
Assumptions & free parameters
free parameters (3)
- maxsize (per dataset) =
60 (Toy 1 and 3), 80 (dijet, trijet, paired-dijet), 20 (diphoton, dimuon)
- Data rescaling transforms =
e.g., x -> 0.000145(x - 1568.5) for dijet; x -> 0.00211(x - 12.5) for Toy 1
- ROF parameter freezing threshold =
not specified numerically
assumptions (4)
- domain assumption The operator set plus complexity constraints define a function space that contains functions adequate to model the true distribution within statistical precision.
- domain assumption The asymmetric chi-squared objective in Eq. 3 is a valid loss for binned data with asymmetric uncertainties.
- domain assumption The LMFIT covariance matrix computed for the frozen functional form provides valid uncertainties for the model.
- standard math The bins are statistically independent, so chi-square per degree of freedom is a meaningful goodness-of-fit metric.
Cite this review
Pith. "Pith review of SymbolFit: Automatic Parametric Modeling with Symbolic Regression." pith.science (2026). https://pith.science/paper/BIHVU7GX
@misc{pith2026241109851,
  author       = {Pith},
  title        = {Pith review of: SymbolFit: Automatic Parametric Modeling with Symbolic Regression},
  year         = {2026},
  howpublished = {\url{https://pith.science/paper/BIHVU7GX}},
  note         = {Machine review of arXiv:2411.09851}
}
read the original abstract
We introduce SymbolFit, a framework that automates parametric modeling by using symbolic regression to perform a machine-search for functions that fit the data while simultaneously providing uncertainty estimates in a single run. Traditionally, constructing a parametric model to accurately describe binned data has been a manual and iterative process, requiring an adequate functional form to be determined before the fit can be performed. The main challenge arises when the appropriate functional forms cannot be derived from first principles, especially when there is no underlying true closed-form function for the distribution. In this work, we develop a framework that automates and streamlines the process by utilizing symbolic regression, a machine learning technique that explores a vast space of candidate functions without requiring a predefined functional form because the functional form itself is treated as a trainable parameter, making the process far more efficient and effortless than traditional regression methods. We demonstrate the framework in high-energy physics experiments at the CERN Large Hadron Collider (LHC) using five real proton-proton collision datasets from new physics searches, including background modeling in resonance searches for high-mass dijet, trijet, paired-dijet, diphoton, and dimuon events. We show that our framework can flexibly and efficiently generate a wide range of candidate functions that fit a nontrivial distribution well using a simple fit configuration that varies only by random seed, and that the same fit configuration, which defines a vast function space, can also be applied to distributions of different shapes, whereas achieving a comparable result with traditional methods would have required extensive manual effort.
Figures


Figures from the paper (13 more)




Forward citations
Cited by 4 Pith papers
-
Machine Can Automatically Discover Parametric Functions to Model HEP Data
Symbolic regression automatically rediscovers the dijet and UA2 background functions used in CMS/ATLAS searches, and generates many alternative functions with comparable fit quality.
-
$\mathcal{CP}$-Analyses with Symbolic Regression
Symbolic regression produces analytic, detector-level CP-odd observables for WBF Higgs production and an analytic reconstruction of the Collins-Soper angle in ttH that are competitive with black-box ML and classical methods.
-
Machine Learning-Based Analytical Expressions for Gray-Body Factors and Application to Primordial Black Holes
Symbolic regression is used to derive compact error-function approximations for Schwarzschild gray-body factors, and the approximations reproduce the Hawking spectra and primordial black hole constraints from full num...
-
Toward Supporting Narrative-Driven Data Exploration: Barriers and Design Opportunities
Clustering particles by mass, spin, lifetime and decay modes with conventional tools reproduces known Standard Model groupings, but the dataset and algorithm choices quietly encode the theory being 'rediscovered'.
Reference graph
Works this paper leans on
-
[1]
La Cava, W. et al. Contemporary symbolic regression methods and their relative performance. In Vanschoren, J. & Yeung, S. (eds.) Proceedings of the Neural Information Processing Systems Track on Datasets and Benchmarks, vol. 1 (2021). URL https://datasets-benchmarks-proceedings.neurips.cc/paper_files/paper/2021/ file/c0c7c76d30bd3dcaefc96f40275bdc0a-Paper...
work page 2021
-
[2]
Udrescu, S.-M. & Tegmark, M. Ai feynman: A physics-inspired method for symbolic regression. Science Advances 6, eaay2631 (2020). URL https://www.science.org/doi/abs/10.1126/sciadv.aay2631. https://www.science.org/doi/pdf/10.1126/ sciadv.aay2631
-
[3]
Keren, L. S., Liberzon, A. & Lazebnik, T. A computational framework for physics-informed symbolic regression with straightforward integration of domain knowledge. Scientific Reports 13 (2023). URL http://dx.doi.org/10.1038/ s41598-023-28328-2
work page 2023
-
[4]
Cava, W. L. et al. Contemporary symbolic regression methods and their relative performance (2021). URL https: //arxiv.org/abs/2107.14351. 2107.14351
arXiv 2021
-
[5]
Interpretable Machine Learning for Science with PySR and SymbolicRegression.jl (2023)
Cranmer, M. Interpretable Machine Learning for Science with PySR and SymbolicRegression.jl (2023). 2305.01582
arXiv 2023
-
[6]
Tsoi, H. F., Loncar, V., Dasu, S. & Harris, P. SymbolNet: neural symbolic regression with adaptive dynamic pruning for compression. Mach. Learn. Sci. Tech. 6, 015021 (2025). 2401.09949
arXiv 2025
-
[7]
Davis, B. L. & Jin, Z. Discovery of a planar black hole mass scaling relation for spiral galaxies. The Astrophysical Journal Letters 956, L22 (2023). URL http://dx.doi.org/10.3847/2041-8213/acfa98. 27
-
[8]
Mengel, T., Steffanic, P., Hughes, C., da Silva, A. C. O. & Nattrass, C. Interpretable machine learning methods applied to jet background subtraction in heavy-ion collisions. Phys. Rev. C 108, L021901 (2023). URL https://link.aps.org/doi/ 10.1103/PhysRevC.108.L021901
Show all 46 references
-
[9]
Wadekar, D. et al. The sz flux-mass (y–m) relation at low-halo masses: improvements with symbolic regression and strong constraints on baryonic feedback. Monthly Notices of the Royal Astronomical Society 522, 2628–2643 (2023). URL http://dx.doi.org/10.1093/mnras/stad1128
2023 doi
-
[10]
& Battaglia, P
Lemos, P., Jeffrey, N., Cranmer, M., Ho, S. & Battaglia, P. Rediscovering orbital mechanics with machine learning. Mach. Learn. Sci. Tech. 4, 045002 (2023). 2202.02306
2023 arXiv
-
[11]
Delgado, A. M. et al. Modelling the galaxy–halo connection with machine learning. Mon. Not. Roy. Astron. Soc. 515, 2733–2746 (2022). 2111.02422
2022 arXiv
-
[12]
Tsoi, H. F. et al. Symbolic Regression on FPGAs for Fast Machine Learning Inference. EPJ Web Conf. 295, 09036 (2024). 2305.04099
2024 arXiv
-
[13]
& Brehmer, J
Butter, A., Plehn, T., Soybelman, N. & Brehmer, J. Back to the formula - LHC edition. SciPost Phys. 16, 037 (2024). 2109.10414
2024 arXiv
-
[14]
Shao, H. et al. Finding Universal Relations in Subhalo Properties with Artificial Intelligence. Astrophys. J. 927, 85 (2022). 2109.04484
2022 arXiv
-
[15]
& Lipson, H
Schmidt, M. & Lipson, H. Distilling free-form natural laws from experimental data. Science 324, 81–85 (2009). URL https://doi.org/10.1126/science.1165893
2009 doi
-
[16]
Genetic programming in Python, with a scikit-learn inspired API: gplearn (2016)
Stephens, T. Genetic programming in Python, with a scikit-learn inspired API: gplearn (2016). URL https://gplearn. readthedocs.io/en/stable/
2016
-
[17]
& Kommenda, M
Burlacu, B., Kronberger, G. & Kommenda, M. Operon C++: An efficient genetic programming framework for symbolic regression. In Proceedings of the 2020 Genetic and Evolutionary Computation Conference Companion , GECCO ’20, 1562–1570 (Association for Computing Machinery, New York...
2020 doi
-
[18]
& Bosman, P
Virgolin, M., Alderliesten, T., Witteveen, C. & Bosman, P. A. N. Improving model-based genetic programming for symbolic regression of small expressions. Evolutionary Computation 29, 211–237 (2021). URL https://doi.org/10.1162%2Fevco_ a_00278
2021
-
[19]
Genetic programming as a means for programming computers by natural selection
Koza, J. Genetic programming as a means for programming computers by natural selection. Statistics and Computing 4, 87–112 (1994)
1994
-
[20]
Hayrapetyan, A. et al. Search for Narrow Trijet Resonances in Proton-Proton Collisions at s=13 TeV. Phys. Rev. Lett. 133, 011801 (2024). 2310.14023
2024 arXiv
-
[21]
Fisher, R. A. On the interpretation of chi2 from contingency tables, and the calculation of p. Journal of the Royal Statistical Society 85, 87–94 (1922). URL http://www.jstor.org/stable/2340521
1922
-
[22]
Aad, G. et al. Observation of a new particle in the search for the Standard Model Higgs boson with the ATLAS detector at the LHC. Phys. Lett. B 716, 1–29 (2012). 1207.7214
2012 arXiv
-
[23]
Chatrchyan, S. et al. Observation of a New Boson at a Mass of 125 GeV with the CMS Experiment at the LHC. Phys. Lett. B 716, 30–61 (2012). 1207.7235
2012 arXiv
-
[24]
Chatrchyan, S. et al. Observation of a New Boson with Mass Near 125 GeV in pp Collisions at √s = 7 and 8 TeV. JHEP 06, 081 (2013). 1303.4571
2013 arXiv
-
[25]
Sirunyan, A. M. et al. Search for high mass dijet resonances with a new background prediction method in proton-proton collisions at √s = 13 TeV. JHEP 05, 033 (2020). 1911.03947
2020 arXiv
-
[26]
Tumasyan, A. et al. Search for resonant and nonresonant production of pairs of dijet resonances in proton-proton collisions at √s = 13 TeV. JHEP 07, 161 (2023). 2206.09997
2023 arXiv
-
[27]
Hayrapetyan, A. et al. Search for new physics in high-mass diphoton events from proton-proton collisions at √s = 13 TeV. JHEP 08, 215 (2024). 2405.09320
2024 arXiv
-
[28]
Hayrapetyan, A. et al. Search for a high-mass dimuon resonance produced in association with b quark jets at √s = 13 TeV. JHEP 10, 043 (2023). 2307.08708
2023 arXiv
-
[29]
Khachatryan, V. et al. Jet energy scale and resolution in the CMS experiment in pp collisions at 8 TeV. JINST 12, P02014 (2017). 1607.03663
2017 arXiv
-
[30]
Sirunyan, A. M. et al. Identification of heavy-flavour jets with the CMS detector in pp collisions at 13 TeV. JINST 13, P05011 (2018). 1712.07158
2018 arXiv
-
[31]
Sirunyan, A. M. et al. Performance of reconstruction and identification of τ leptons decaying to hadrons and ντ in pp collisions at √s = 13 TeV. JINST 13, P10005 (2018). 1809.02816
2018 arXiv
-
[32]
Sirunyan, A. M. et al. Inclusive search for highly boosted Higgs bosons decaying to bottom quark-antiquark pairs in proton- proton collisions at √s = 13 TeV. JHEP 12, 085 (2020). 2006.13251
2020 arXiv
-
[33]
& Whiteson, D
Frate, M., Cranmer, K., Kalia, S., Vandenberg-Rodes, A. & Whiteson, D. Modeling Smooth Backgrounds and Generic Localized Signals with Gaussian Processes (2017). 1709.05681
2017 arXiv
-
[34]
Gandrakota, A., Lath, A., Morozov, A. V. & Murthy, S. Model selection and signal extraction using Gaussian Process regression. JHEP 02, 230 (2023). 2202.05856
2023 arXiv
-
[35]
A Measurement of Boosted Dibosons with Gaussian Process Background Modeling at the ATLAS Detector (2024)
Xu, R. A Measurement of Boosted Dibosons with Gaussian Process Background Modeling at the ATLAS Detector (2024). URL https://cds.cern.ch/record/2901208. Presented 21 May 2024
2024
-
[36]
P., Gulian, M., Frankel, A
Swiler, L. P., Gulian, M., Frankel, A. L., Safta, C. & Jakeman, J. D. A survey of constrained gaussian process regression: Approaches and implementation challenges. Journal of Machine Learning for Modeling and Computing 1, 119–156 (2020). URL http://dx.doi.org/10.1615/JMachLea...
2020 doi
-
[37]
Newville, M., Stensitzki, T., Allen, D. B. & Ingargiola, A. LMFIT: Non-Linear Least-Square Minimization and Curve-Fitting for Python (2015). URL https://doi.org/10.5281/zenodo.11813
2015 doi
-
[38]
Hayrapetyan, A. et al. The CMS Statistical Analysis and Combination Tool: COMBINE (2024). 2404.06614
2024 arXiv
-
[39]
& Stark, G
Heinrich, L., Feickert, M. & Stark, G. pyhf: v0.7.6. URL https://doi.org/10.5281/zenodo.1169739. Https://github.com/scikit-hep/pyhf/releases/tag/v0.7.6
-
[40]
& Cranmer, K
Heinrich, L., Feickert, M., Stark, G. & Cranmer, K. pyhf: pure-python implementation of histfactory statistical models. Journal of Open Source Software 6, 2823 (2021). URL https://doi.org/10.21105/joss.02823
2021 doi
-
[41]
D., Kenzie, M., Wardle, N
Dauncey, P. D., Kenzie, M., Wardle, N. & Davies, G. J. Handling uncertainties in background shapes: the discrete profiling method. JINST 10, P04015 (2015). 1408.6865
2015 arXiv
-
[42]
Search for high mass dijet resonances with a new background prediction method in proton-proton collisions at √s = 13 TeV
CMS Collaboration. Search for high mass dijet resonances with a new background prediction method in proton-proton collisions at √s = 13 TeV. HEPData (collection) (2019). https://doi.org/10.17182/hepdata.91059
2019 doi
-
[43]
Search for new physics in high-mass diphoton events from proton-proton collisions at √s = 13 TeV
CMS Collaboration. Search for new physics in high-mass diphoton events from proton-proton collisions at √s = 13 TeV. HEPData (collection) (2024). https://doi.org/10.17182/hepdata.150677. 28
2024 doi
-
[44]
Search for narrow trijet resonances in proton-proton collisions at √s = 13 TeV
CMS Collaboration. Search for narrow trijet resonances in proton-proton collisions at √s = 13 TeV. HEPData (collection) (2023). https://doi.org/10.17182/hepdata.144165
2023 doi
-
[45]
Search for resonant and nonresonant production of pairs of dijet resonances in proton-proton collisions at √s = 13 TeV
CMS Collaboration. Search for resonant and nonresonant production of pairs of dijet resonances in proton-proton collisions at √s = 13 TeV. HEPData (collection) (2022). https://doi.org/10.17182/hepdata.130817
2022 doi
-
[46]
Search for a high-mass dimuon resonance produced in association with b quark jets at √s=13 TeV
CMS Collaboration. Search for a high-mass dimuon resonance produced in association with b quark jets at √s=13 TeV. HEPData (collection) (2023). https://doi.org/10.17182/hepdata.141455. 29 1 2 3 4 1.50 1.75 2.00 2.25 2.50 2.75 3.00 3.25 T oy Dataset 2a 1 2 3 4 1.0 1.5 2.0 2.5 3...
2023
Reviewed August 12, 2026 · model on record in the stance chip above.
Discussion (0). Continue with ORCID to comment.