REVIEW 3 major objections 8 minor 36 references
A Co-analysis Framework for Exploring Multivariate Scientific Data
T0 review · 3 major / 8 minor · reviewed 2026-08-14 · deepseek-v4-flash
Pith's one-line read The paper claims that biclusters—variable plus voxel subsets with close scalar-value patterns—can serve as the organizing unit for exploring local associations in multivariate scientific data.
desk verdict A useful incremental systems paper, but the bicluster coherence measure is scale-dependent and likely lets one variable dominate; needs normalization or a unit-aware design before the central claims hold. read the letter →
The pith
A machine-rendered reading of the paper's core claim, the machinery that carries it, and where it could break.
The reading
What carries the argument
The load-bearing object is the bicluster and its defining pScore. For a $2\times 2$ submatrix of two voxels and two variables, pScore is the absolute difference between the two value changes; a bicluster is a set of variables and voxels in which every such pScore is at most $\delta$. The generation step is a depth-first variable-enumeration search that starts from all variable pairs, expands variable sets, and intersects voxel sets, keeping only closed biclusters above a minimum voxel count. Organization and grouping rest on two simpler metrics: Jaccard similarity between bicluster voxel sets for grouping, and a minimum pairwise Pearson correlation over the bicluster voxels for ranking variable sets. These metrics are what make the bicluster output navigable instead of a flat list of thousands of overlapping regions.
What would settle it
Run the extraction on a synthetic volume with planted regions of known correlated variables and measure whether recovered biclusters match the planted regions as $\delta$ ranges from 10 to 30. If no single $\delta$ recovers both a large background region and a small embedded feature without a tenfold change in bicluster count and a loss of the small feature, the central claim loses support.
Extended reading notes
Core claim
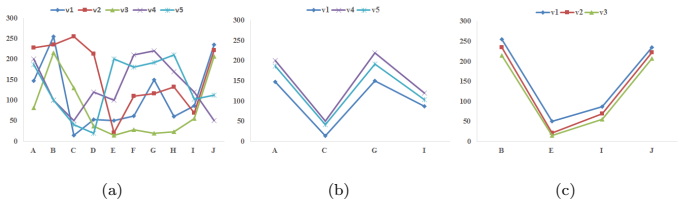
The paper's central claim is that a bicluster $(D',V')$—defined by the requirement that the pScore of every pair of voxels on every pair of variables in the set be at most a tolerance $\delta$—is the right primitive for local co-analysis of multivariate data. pScore measures the difference between two voxels' value changes across two variables; a small value means the two voxels follow the same scalar-value pattern on those variables. The framework enumerates all closed biclusters through a depth-first expansion of variable sets, intersects voxel sets as variables are added, and discards biclusters with fewer than $\mathrm{minv}$ voxels. These biclusters are then organized by variable set, and biclusters sharing a variable set are hierarchically grouped by the Jaccard similarity of their voxel sets, so that users explore representative groups rather than thousands of overlapping regions. A new local correlation measure—the minimum absolute Pearson coefficient among variable pairs over the bicluster voxels—ranks variable sets and can disagree with global correlations computed over all voxels. Four coordinated views, including an association matrix, a bicluster similarity scatter plot, an enhanced parallel coordinate, and a spatial volume rendering, link variable-set selection, bicluster grouping, scalar-value coherence, and spatial distribution.
Load-bearing premise
The framework stands or falls on whether a single user-chosen tolerance $\delta$ (plus a minimum voxel count) can make the extracted biclusters line up with genuinely meaningful local phenomena rather than arbitrary value coincidences.
Editorial extensions
If this is right
- For a data set like hurricane Isabel, the framework can separate the hurricane eye ($\{PRE,QVAPOR,TC\}$) from rainbands ($\{PRE,QVAPOR,VEL\}$), a distinction that a global correlation over all voxels would blur.
- Biclusters sharing a variable set can be grouped by spatial overlap, so a user explores a small number of representative groups instead of thousands of overlapping biclusters.
- The local correlation of a variable set, defined as the minimum absolute Pearson coefficient over bicluster voxels, supplies a ranking that can disagree with global correlation rankings and point to regions where variables interact.
- The same pipeline extends two-variable association patterns to three or more variables and lets users verify each association in both scalar-value and spatial views.
- The framework's usefulness depends on choosing the tolerance $\delta$ between 10 and 30 (20 by default) and a minimum voxel count; the paper fixes that count at 0.2% of total voxels to capture small features such as the hurricane eye.
Reading between the lines
- Editorial inference: the bicluster output could directly seed multi-dimensional transfer functions, since each bicluster already encodes a variable subset plus a scalar-value combination—the input such transfer functions need.
- Editorial inference: because Table 1 shows the bicluster count varying by nearly an order of magnitude with $\delta$, an adaptive tolerance that scales with local data range would be a natural stress test and likely improvement; the paper's fixed $\delta$ is a simplifying choice, not a necessity.
- Editorial inference: a quantitative benchmark that compares recovered bicluster regions against hand-labeled features (e.g. hurricane eye and rainbands) would measure precision and recall and would settle whether the groups are truly meaningful.
- Editorial inference: the framework's logic suggests it could track associations over time by comparing bicluster variable sets across time steps; the paper lists time-varying data as future work.
Signed reviews
Editorial analysis
A structured set of objections, weighed in public.
Referee Report
Summary. The paper presents a co-analysis framework for multivariate scientific data based on biclusters, which are subsets of variables and voxels with close scalar-value relationships. The framework generates all biclusters using a depth-first search with a pScore coherence tolerance (Eq. 1), organizes them by variable sets, groups biclusters by a Jaccard-based similarity metric (Eq. 3), and provides four coordinated views: an association matrix, an MDS-based bicluster view, an enhanced parallel coordinate plot, and a spatial volume rendering. The authors claim this enables users to quickly explore variable sets of interest and discover local correlations of scalar values among variables, and they present three qualitative case studies (hurricane Isabel, turbulent combustion, deep water impact), including one qualitative comparison with GSIM.
Significance. If the methodological caveats are addressed, the framework is a useful contribution to multivariate visualization: it makes biclustering accessible for volume data, provides a clear organizational structure for biclusters, and emphasizes the local nature of variable associations, which global correlation methods miss. The paper is also commendable for explicitly discussing parameter sensitivity and for acknowledging that mathematically correlated scalars may not be physically correlated (Sec. 7.4). However, the central effectiveness claim is currently supported only by qualitative case studies, and two load-bearing technical issues—the scale dependence of the pScore measure and the circularity of the local-correlation statistic—need to be resolved before the experimental observations can be taken as evidence for the claimed local multivariate associations.
major comments (3)
- [Sec. 4, Eq. (1); Sec. 7.1] The pScore is applied to raw scalar values without any normalization or per-variable scaling. Because the Isabel variables have different physical units and ranges (e.g., PRE in hPa vs QVAPOR in kg/kg), a single tolerance delta=20 is effectively a tolerance on the largest-range variable; the inequality can be satisfied even when small-range variables vary by amounts that are large relative to their own scales. Consequently, a bicluster labeled {PRE, QVAPOR, VEL} does not by itself establish that all three variables are locally associated, since the coherence may be entirely due to PRE. The rainband interpretation in Sec. 7.1 (PRE nearly constant, QVAPOR increasing, VEL decreasing) should be supported by per-variable coherence statistics or by normalizing each variable before biclustering and re-running the analysis.
- [Sec. 5.1, Eq. (2); Sec. 7.2] The correlation C(D') is computed on the voxels of the biclusters of D', which are exactly the voxels selected by the pScore condition. Because pScore <= delta forces s_u - s_v to be nearly constant across the bicluster for every pair (u,v) in D', a strong Pearson correlation between u and v is largely implied by the definition of a bicluster. Thus the high C(D') values used to sort variable sets in the association matrix are partly tautological, and the claim in Sec. 7.2 that local correlation is 'better measured' than global correlation is not supported by this measure. Please report C(D') also on all voxels and on hold-out voxels, and quantify the inflation induced by selecting the bicluster voxels.
- [Sec. 7 and Table 1] The evaluation is entirely qualitative: there is no user study, no task-based quantitative metrics, and the only external comparison (GSIM, Fig. 7f) is a single side-by-side visual comparison on one dataset. Moreover, Table 1 shows the number of Isabel biclusters varies from 526 to 4924 as delta goes from 30 to 10, and delta is set to '20 by default' with no stability analysis of the resulting variable sets or groups. Because the central claim (Secs. 7.4 and 8) is that the framework effectively guides exploration, the paper should include a quantitative sensitivity analysis of the top-ranked variable sets and groups across delta and minv, and ideally a small task-based user study comparing exploration outcomes with a baseline.
minor comments (8)
- [Sec. 1 and Sec. 7] The introduction states that two new experiments concern the ionization front instability data (Sec. 6.1) and hurricane Isabel (Sec. 7.1), but the ionization front data is never presented as a case study in Sec. 7; the only occurrence is the association-matrix screenshot in Fig. 4. Please either add the case study or correct the introduction.
- [Sec. 7.1] The text says ten variables were used but lists only nine (PRE, PRECIP, QCLOUD, QGRAUP, QICE, QSNOW, QVAPOR, TC, and VEL). Please add the missing variable or correct the count.
- [Sec. 4, Eq. (1)] The double vertical bars in Eq. (1) denote an absolute value in context, not a norm; the notation should be made consistent.
- [Sec. 5.1, Eq. (2)] The text 'sigma_du/sigma_dv' should presumably be the product sigma_du * sigma_dv; the slash notation is misleading.
- [Sec. 6.2] The choices of 'approximately 10 groups' and the cut-off d(A,B) <= 0.99 are stated without justification; these thresholds affect the exploration and should be discussed or made user-controllable.
- [Sec. 7] The background-filter threshold of 10% of the total voxels and the minimum-voxel threshold of 0.2% are application-specific; a sentence on how sensitive the displayed features are to these values would help.
- [Sec. 7.3] The GSIM comparison is described only visually; a numerical similarity measure between the extracted groups and the GSIM high-correlation regions would make the comparison more informative.
- [Sec. 1] The introduction refers to experiments in 'Sec. 6', but the experimental case studies appear in Sec. 7; the cross-reference should be corrected.
Circularity Check
No significant circularity: the bicluster extraction, grouping, and visual-analysis claims are derived from the data via an external algorithm and user-set tolerances, not from the conclusions they support.
full rationale
The paper's central claim is that automatically extracted biclusters, organized by variable set and grouped by Jaccard similarity, help users explore local multivariate associations. That claim rests on the bicluster definition pScore(D',V') <= delta (Eq. 1), which is an unsupervised pattern-coherence criterion taken from the external Maple algorithm [31], and on user-chosen parameters delta and minv. No parameter is fitted to a target result and then renamed as a prediction; the tolerance is explicitly application-dependent and its sensitivity is reported in Table 1. The local correlation C(D') in Eq. 2 is computed on the voxels of the extracted biclusters, so it summarizes those clusters rather than independently validating them, but the paper explicitly acknowledges that mathematical correlation may not reflect physical causation (Sec. 7.4), which prevents this from being a circular derivation. The self-citations [12] and [13] are provenance for the extension and a survey, respectively, and are not load-bearing. The scale-dependence concern raised by the skeptic is a robustness or interpretability risk, not a circularity: it questions whether pScore on raw, differently scaled variables yields meaningful clusters, but it does not show that any claimed result is equivalent to its input by construction. The framework is therefore self-contained with respect to the external biclustering method, and no circular step is present.
Assumptions & free parameters
free parameters (4)
- delta (pScore tolerance) =
20 (default); 10, 15, 20, 25, 30 in Table 1
- minv (minimum voxels per bicluster) =
0.2% of total voxels
- background filter threshold =
10% of total voxels
- group count and coherence cutoff =
~10 groups, d(A,B) <= 0.99
assumptions (4)
- domain assumption Objects (voxels) exhibit a similar scalar-value pattern over several attributes; local features in multivariate data correspond to such patterns
- domain assumption Within a bicluster the scalar values of two variables are generally linear, justifying Pearson correlation
- standard math The Maple algorithm's closed-bicluster enumeration guarantees completeness of the search
- domain assumption Users have little domain knowledge initially, so exhaustive bicluster extraction over all variable combinations is the right default
Cite this review
Pith. "Pith review of A Co-analysis Framework for Exploring Multivariate Scientific Data." pith.science (2026). https://pith.science/paper/BIIZRTDE
@misc{pith2026190806576,
  author       = {Pith},
  title        = {Pith review of: A Co-analysis Framework for Exploring Multivariate Scientific Data},
  year         = {2026},
  howpublished = {\url{https://pith.science/paper/BIIZRTDE}},
  note         = {Machine review of arXiv:1908.06576}
}
read the original abstract
In complex multivariate data sets, different features usually include diverse associations with different variables, and different variables are associated within different regions. Therefore, exploring the associations between variables and voxels locally becomes necessary to better understand the underlying phenomena. In this paper, we propose a co-analysis framework based on biclusters, which are two subsets of variables and voxels with close scalar-value relationships, to guide the process of visually exploring multivariate data. We first automatically extract all meaningful biclusters, each of which only contains voxels with a similar scalar-value pattern over a subset of variables. These biclusters are organized according to their variable sets, and biclusters in each variable set are further grouped by a similarity metric to reduce redundancy and support diversity during visual exploration. Biclusters are visually represented in coordinated views to facilitate interactive exploration of multivariate data based on the similarity between biclusters and the correlation of scalar values with different variables. Experiments on several representative multivariate scientific data sets demonstrate the effectiveness of our framework in exploring local relationships among variables, biclusters and scalar values in the data.
Figures


Figures from the paper (5 more)


Reference graph
Works this paper leans on
-
[12]
X. He, Y. Tao, Q. Wang, H. Lin, Biclusters based visual exploration of multivariate scientific data, in: Proceedings of IEEE Scientific Visualization Conference (SciVis) 2018, IEEE, 2018, pp. 40–45
work page 2018
-
[1]
H. Carr, D. Duke, Joint contour nets: Computation and properties, in: Proceedings of IEEE Pacific Visualization Symposium (PacificVis) 2013, 2013, pp. 161–168
work page 2013
- [2]
-
[3]
F.-Y. Tzeng, K.-L. Ma, A cluster-space visual interface for arbitrary di- mensional classification of volume data, in: Proceedings of the Sixth Joint Eurographics - IEEE TCVG Conference on Visualization, 2004, pp. 17–24
work page 2004
-
[4]
T. Van Long, L. Linsen, Multiclustertree: Interactive visual exploration of hierarchical clusters in multidimensional multivariate data, Computer Graphics Forum 28 (3) (2009) 823–830
work page 2009
-
[5]
F. Wu, G. Chen, J. Huang, Y. Tao, W. Chen, Easyxplorer: A flexible vi- sual exploration approach for multivariate spatial data, Computer Graphics Forum 34 (7) (2015) 163–172
work page 2015
- [6]
-
[7]
J. Sukharev, C. Wang, K. L. Ma, A. T. Wittenberg, Correlation study of time-varying multivariate climate data sets, in: Proceedings of IEEE Pacific Visualization Symposium (PacificVis) 2009, 2009, pp. 161–168
work page 2009
Show all 36 references
-
[8]
C. Wang, H. Yu, R. W. Grout, K. L. Ma, J. H. Chen, Analyzing information transfer in time-varying multivariate data, in: Proceedings of IEEE Pacific Visualization Symposium (PacificVis) 2011, 2011, pp. 99–106. 28
2011
-
[9]
X. Zhao, A. Kaufman, Multi-dimensional reduction and transfer function design using parallel coordinates, in: Proceedings of the 8th IEEE/EG International Conference on Volume Graphics, VG’10, 2010, pp. 69–76
2010
-
[10]
H. Guo, H. Xiao, X. Yuan, Multi-dimensional transfer function design based on flexible dimension projection embedded in parallel coordinates, in: 2011 IEEE Pacific Visualization Symposium (PacificVis), IEEE, 2011, pp. 19–26
2011
-
[11]
Lu, H.-W
K. Lu, H.-W. Shen, Multivariate volumetric data analysis and visualization through bottom-up subspace exploration, in: 2017 IEEE Pacific Visualiza- tion Symposium (PacificVis), IEEE, 2017, pp. 141–150
2017
-
[13]
X. He, Y. Tao, Q. Wang, H. Lin, Multivariate spatial data visualization: a survey, Journal of Visualization (ChinaVis 2018)
2018
-
[14]
Kehrer, H
J. Kehrer, H. Hauser, Visualization and visual analysis of multifaceted sci- entific data: A survey, IEEE Transactions on Visualization and Computer Graphics 19 (3) (2013) 495–513
2013
-
[15]
Fuchs, H
R. Fuchs, H. Hauser, Visualization of multi-variate scientific data, Com- puter Graphics Forum 28 (6) (2009) 1670–1690
2009
-
[16]
Biswas, S
A. Biswas, S. Dutta, H. W. Shen, J. Woodring, An information-aware framework for exploring multivariate data sets, IEEE Transactions on Vi- sualization and Computer Graphics 19 (12) (2013) 2683–2692
2013
-
[17]
Gosink, J
L. Gosink, J. Anderson, W. Bethel, K. Joy, Variable interactions in query- driven visualization, IEEE Transactions on Visualization and Computer Graphics 13 (6) (2007) 1400–1407
2007
-
[18]
J¨ anicke, A
H. J¨ anicke, A. Wiebel, G. Scheuermann, W. Kollmann, Multifield visualiza- tion using local statistical complexity, IEEE Transactions on Visualization and Computer Graphics 13 (6) (2007) 1384–1391. 29
2007
-
[19]
Nagaraj, V
S. Nagaraj, V. Natarajan, R. S. Nanjundiah, A gradient-based comparison measure for visual analysis of multifield data, Computer Graphics Forum 30 (3) (2011) 1101–1110
2011
-
[20]
Inselberg, The plane with parallel coordinates, The Visual Computer 1 (2) (1985) 69–91
A. Inselberg, The plane with parallel coordinates, The Visual Computer 1 (2) (1985) 69–91
1985
-
[21]
Inselberg, B
A. Inselberg, B. Dimsdale, Parallel coordinates: a tool for visualizing multi- dimensional geometry, in: Proceedings of the First IEEE Conference on Visualization 1990, 1990, pp. 361–378
1990
-
[22]
T. F. Cox, M. Cox, Multidimensional Scaling, 2nd Edition, Chapman Hall, London, 1994
1994
-
[23]
van der Maaten, G
L. van der Maaten, G. Hinton, Visualizing data using t-SNE, Journal of Machine Learning Research 9 (2008) 2579–2605
2008
-
[24]
J.A.Hartigan, Direct clustering of a data matrix, Journal of the American Statistical Association 67 (337) (1972) 123–129
1972
-
[25]
Santamar´ ıa, R
R. Santamar´ ıa, R. Ther´ on, L. Quintales, Bicoverlapper: a tool for bicluster visualization, Bioinformatics 24 (9) (2008) 1212–1213
2008
-
[26]
M. Liu, J. Shi, Z. Li, C. Li, J. Zhu, S. Liu, Towards better analysis of deep convolutional neural networks, IEEE Transactions on Visualization and Computer Graphics 23 (1) (2017) 91–100
2017
-
[27]
S. Liu, B. Wang, J. J. Thiagarajan, P.-T. Bremer, V. Pascucci, Visual ex- ploration of high-dimensional data through subspace analysis and dynamic projections, Computer Graphics Forum 34 (3) (2015) 271–280
2015
-
[28]
M. Sun, P. Mi, C. North, N. Ramakrishnan, BiSet: Semantic edge bundling with biclusters for sensemaking, IEEE Transactions on Visualization and Computer Graphics 22 (1) (2016) 310–319. 30
2016
-
[29]
J. Zhao, M. Sun, F. Chen, P. Chiu, BiDots: Visual exploration of weighted biclusters, IEEE Transactions on Visualization and Computer Graphics 24 (1) (2018) 195–204
2018
-
[30]
Oghabian, S
A. Oghabian, S. Kilpinen, S. Hautaniemi, E. Czeizler, Biclustering meth- ods: biological relevance and application in gene expression analysis, PloS one 9 (3) (2014) e90801
2014
-
[31]
J. Pei, X. Zhang, M. Cho, H. Wang, P. S. Yu, Maple: a fast algorithm for maximal pattern-based clustering, in: Proceedings of Third IEEE Interna- tional Conference on Data Mining (ICDM) 2003, 2003, pp. 259–266
2003
-
[32]
Kriegel, P
H.-P. Kriegel, P. Kr¨ oger, A. Zimek, Clustering high-dimensional data: A survey on subspace clustering, pattern-based clustering, and correlation clustering, ACM Transactions on Knowledge Discovery from Data 3 (1) (2009) 1:1–1:58
2009
-
[33]
J. Han, J. Pei, M. Kamber, Data mining: concepts and techniques, Elsevier, 2011
2011
-
[34]
A. Lex, N. Gehlenborg, H. Strobelt, R. Vuillemot, H. Pfister, UpSet: Vi- sualization of intersecting sets, IEEE Transactions on Visualization and Computer Graphics 20 (12) (2014) 1983–1992
2014
-
[35]
H. Guo, H. Xiao, X. Yuan, Scalable multivariate volume visualization and analysis based on dimension projection and parallel coordinates, IEEE Transactions on Visualization and Computer Graphics 18 (9) (2012) 1397– 1410
2012
-
[36]
Patchett, J
J. Patchett, J. Ahrens, Optimizing scientist time through in situ visualiza- tion and analysis, IEEE Computer Graphics and Applications 38 (1) (2018) 119–127. 31
2018
Reviewed August 14, 2026 · model on record in the stance chip above.
Discussion (0). Continue with ORCID to comment.