REVIEW 4 major objections 4 minor 23 references
Seeing Is Not Deciding: Can Multimodal LLMs Act as Effective CEOs?
T0 review · 4 major / 4 minor · reviewed 2026-08-07 · deepseek-v4-flash
Pith's one-line read This paper claims that adding visual business evidence improves AI CEOs' evidence-centric reasoning but degrades their constrained resource allocation in all nine models tested, a paradox traced to signal crowding.
desk verdict A genuinely useful benchmark with one robust, counterintuitive result, but the causal story is oversold and the Discussion contains a copy-paste contamination that must be fixed. read the letter →
The pith
A machine-rendered reading of the paper's core claim, the machinery that carries it, and where it could break.
The reading
What carries the argument
The load-bearing object is the paired-condition benchmark itself: each scenario instantiates a fixed organizational decision problem with two input settings differing only in the presence of visual business evidence, allowing a per-task multimodal uplift Δ to be measured. The mechanism the paper names is signal crowding—when several visual channels (financial performance, growth trends, operational KPIs) are combined, their unit-level numbers and rates compete with the explicit allocation constraints during decoding, so grounding improves while constraint validity and strategic fit degrade. A supplementary text-plus-numbers control decomposes the effect into a numerical component and a visual component, showing the failure is not modality-specific but an evidence-load effect that visual presentation amplifies.
What would settle it
Run the untested fourth cell of the load-by-modality design on resource allocation: present one panel's values as plain text instead of a chart. If a single text channel behaves like a single chart and three text channels degrade as much as three charts, the mechanism is pure evidence load; if single-text does not reproduce single-chart gains, visual modality itself plays a causal role. This directly settles whether 'signal crowding' is a chart-specific or general phenomenon.
Extended reading notes
Core claim
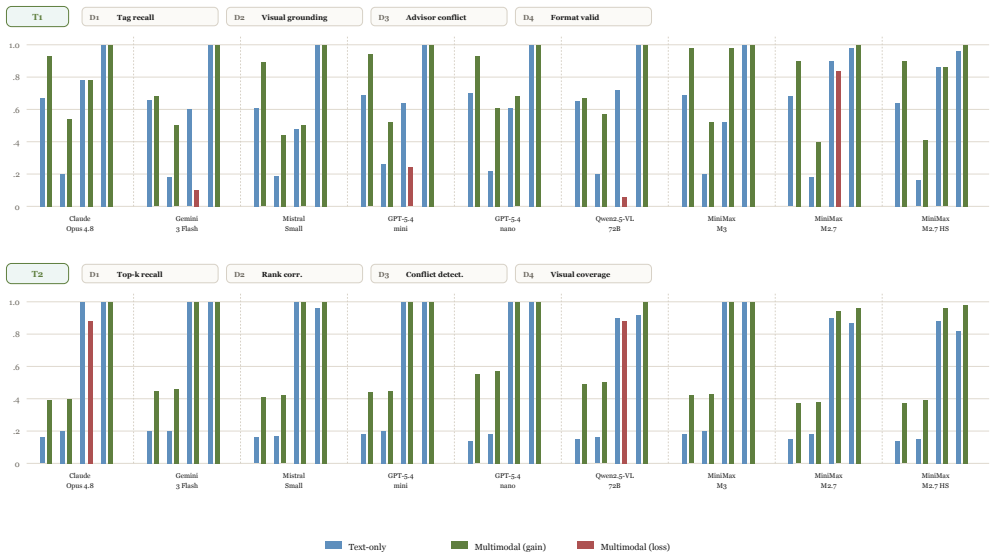
On the paper's own terms, the central discovery is a task-asymmetric multimodal effect in executive decision-making: averaged across all nine models, multimodal inputs raise risk forecasting by +0.24 and board justification by +0.17, yet lower resource reallocation by −0.08, with all nine models negative on the allocation task. The dissociation is sharpened by sub-dimension scores: the visual grounding proxy rises by about +0.42 under multimodal input while constraint validity and strategic fit fall, meaning the model perceives the added evidence and acts on it less validly. Single-channel ablations show that finance-only, growth-only, or ops-only conditions each improve allocation over text-only, and a text-plus-numbers control shows 60% of the allocation degradation survives when the same panel values are given as structured text instead of charts. The paper interprets this as evidence-load crowding, with visual presentation amplifying an effect that concurrent quantitative signals already produce.
Load-bearing premise
The paired text-only and multimodal conditions are assumed to isolate the effect of visual evidence, but the multimodal condition adds extra numerical information and longer input; if the true driver is evidence load rather than visual modality, the paradox is misnamed and the fix is reducing concurrent quantitative signals, not merely withholding charts.
Editorial extensions
If this is right
- Executive AI deployments should selectively expose decision-relevant evidence at the action stage rather than attaching every available chart, because each extra concurrent signal can hurt constraint satisfaction.
- Benchmarks for decision agents should report perception, reasoning, and constrained action separately, since the paper shows these can move in opposite directions.
- A model can show strong visual grounding and failing outcomes at the same time, so grounding metrics alone cannot certify decision quality.
- The allocation failure grows worse in tension and adversarial scenarios, so organizations facing conflicting signals should be especially cautious about multimodal augmentation.
- The remaining 40% of the T3 degradation that comes from charts suggests that visual presentation itself amplifies the crowding effect, not just the underlying numbers.
Reading between the lines
- If the mechanism is evidence-load rather than visual modality, the same crowding should appear in text-only settings with many concurrent quantitative signals; the paper's own text-plus-numbers control already shows 60% of the effect textually, and the untested fourth cell (single-panel-as-text) could settle the modality question.
- The finding likely extends beyond executive dashboards to any constrained generation task with rich contextual evidence, such as clinical dosing, logistics planning, or code editing under budget constraints, where more context can paradoxically reduce constraint adherence.
- A natural intervention implied by the paper is separate evidence acquisition from decision execution—e.g., a first stage that condenses charts into a short evidence summary and a second stage that decides with constraints only—and this is testable with the released benchmark.
- The paper says evidence-load crowding is the mechanism, but it does not show whether models could be trained or prompted to discount visually salient but strategically misleading signals; a prompt-level intervention study would directly test whether the paradox is a decoding default or a deeper limitation.
Editorial analysis
A structured set of objections, weighed in public.
Referee Report
Summary. C-SUITEBENCH is a paired text-only vs. multimodal benchmark for executive decision-making. The paper places nine multimodal LLMs in a CEO role across 50 scenarios and five tasks: diagnosis, prioritization, resource reallocation, risk forecasting, and board justification. It reports that multimodal inputs improve evidence-centric tasks (T2, T4, T5 significantly; T1 as a descriptive trend) but consistently degrade constrained resource allocation (T3) for all nine models. Sub-dimension analysis shows that a visual-grounding proxy rises while constraint validity and strategic fit fall, and single-channel ablations show that each visual channel helps alone while the full combination hurts. A text-plus-numbers control decomposes the T3 drop into a numerical component (Δ_num = −0.046) and a visual component (Δ_vis = −0.031), leading the authors to propose 'evidence-load crowding' with 'visual signal crowding' as its chart-specific instantiation.
Significance. If the central dissociation holds, this is a valuable contribution: it provides a controlled benchmark for multimodal executive decision-making, a robust cross-model empirical result (9/9 models show T3 degradation, confirmed with a temperature-0 run and a human-preference study), and a plausible architectural implication that visual perception and constraint-satisfying action are separable bottlenecks. The paper also deserves credit for rule-based scoring transparency, paired comparisons, human validation of the automatic scorer, and an unusually candid appendix that acknowledges the incomplete load-by-modality design. However, the headline causal mechanism is not yet established: the multimodal condition differs from the text-only condition in evidence load as well as in modality, and the missing fourth cell of the 2x2 design prevents a formal interaction test. The unrelated Discussion section is also a serious manuscript-integrity problem that must be fixed before the paper can be considered publishable.
major comments (4)
- [Section 4.5 and Appendix D.3] The central causal claim that the T3 failure 'emerges from signal crowding' is underdetermined because evidence load and modality are confounded in the main comparison. The multimodal condition contains unit-level KPI values, rates of change, and trend inflections not present in the text-only report, and Appendix D.2 shows that the text-plus-numbers control reproduces 60% of the T3 drop (Δ_num = −0.046 vs. Δ_vis = −0.031). The fourth cell of the load-by-modality design (single-panel-as-text) has not been run, as Appendix D.3 states, so there is no formal interaction test. The Abstract, Section 4.5, and the Conclusion nonetheless present visual signal crowding as the mechanism. Please either run the fourth cell or consistently reframe the claim as 'evidence-load crowding with a visual amplifier', including the title's implication that seeing per se is the problem.
- [Discussion (between Section 4.5 and Conclusion)] This section is entirely about an odor-perception experiment (SCENTINEL), reporting results such as '87.5% of shifted responses' and a 'calibrated sensor vs. passerby' contrast that have no connection to C-SuiteBench and are not supported anywhere else in the manuscript. This appears to be content from a different study and breaks the paper's narrative. It must be removed and replaced with a discussion of the C-SuiteBench findings, and the authors should verify that no other sections contain similar extraneous material.
- [Section 4.1 and Table B1] The claim that evidence-centric tasks 'consistently improve' is overstated. T1 Organizational Diagnosis has a model-level sign-test p = 0.180 and shows negative Δ for two of nine models (Qwen2.5-VL −0.07, Gemini 3 Flash −0.04), as the authors themselves note in Table B1. The Abstract and Section 4.1 should be qualified to say that T2, T4, and T5 show reliable positive gains, with T1 as a positive but non-significant trend, rather than 'consistent gains on evidence-centric tasks'.
- [Section 4.3 and Figure 2 (left)] The dissociation between the visual-grounding proxy and constraint validity is cited as evidence that models 'become better at incorporating visual evidence' in T3. However, the proxy is computed from explicit references to panel-derived evidence items, not from whether those references are correct, and Appendix G shows that full multimodal outputs cite more evidence (2.6 to 4.1 items) while validity falls. Under this metric, a model that is distracted into mentioning more visual items but failing constraints would also show a higher proxy. Please validate the proxy against a correctness criterion or weaken the claim that T3 reflects improved visual grounding rather than increased visual mention.
minor comments (4)
- [Abstract, Introduction, and Section 3] There are several typos: 'Furthermore, To examine' has a capitalization error; 'revealing that that each visual channel' has a duplicated 'that'; 'C-SUITEBENCHplaces' is missing a space.
- [Section 4.5 and Table C1] Section 4.5 says 'see Table 9 for full results' but the full cross-model ablation appears in Table C1 in the appendix; please fix the cross-reference.
- [Appendix D.2] The decomposition Δ_vis = Δ_full − Δ_num is defined arithmetically, but the text sometimes calls it a separate experimental condition; please clarify that the visual component is a residual, not a directly measured condition.
- [Appendix I, 'Scope and Remaining Controls'] The limitation paragraph correctly mentions the incomplete load×modality design, but the abstract and conclusion do not carry that caveat; please align the framing across these sections.
Circularity Check
No significant circularity: central results are paired empirical measurements with acknowledged confounds, and self-citations are not load-bearing.
full rationale
The load-bearing comparisons in C-SUITEBENCH are direct paired text-only versus multimodal scores from nine models; no parameter is fitted and then renamed as a prediction, and the benchmark conclusions are not entailed by construction. The multimodal condition does add quantitative information not present in text, and the text-plus-numbers control (Appendix D.2) plus the missing fourth cell of the load-by-modality design (Appendix D.3) are acknowledged confounds and limitations rather than definitional reductions. The difficulty-family 'prediction' in Sections 4.3-4.4 is an exploratory stratification of the same data; this weakens inferential strength, but it is not circular because the T3 effect is measured, not derived from the hypothesis. Self-citations (RealFin, Dai et al. 2026a; Can LLMs Be CEOs?, Dai et al. 2026b) are used only in related-work gap statements and do not carry the argument. The T3 visual-grounding proxy rises by construction as a mention-count dimension, but the degradation in constraint validity is independently scored and is not entailed by that proxy. No step reduces to its own inputs by definition.
Assumptions & free parameters
free parameters (2)
- T3 hidden acceptable allocation ranges and preferred reallocation profiles =
author-specified per scenario; not included in preprint
- Scenario difficulty family labels =
easy, fragile, tension, adversarial across 50 scenarios
assumptions (4)
- domain assumption Text-only and multimodal conditions differ only in visual evidence availability
- domain assumption The automatic task scorers reflect executive decision quality
- domain assumption The visual grounding proxy measures visual perception
- domain assumption The nine models and 50 scenarios are representative enough for generalizable claims
Cite this review
Pith. "Pith review of Seeing Is Not Deciding: Can Multimodal LLMs Act as Effective CEOs?." pith.science (2026). https://pith.science/paper/BVTGZCZA
@misc{pith2026260805864,
  author       = {Pith},
  title        = {Pith review of: Seeing Is Not Deciding: Can Multimodal LLMs Act as Effective CEOs?},
  year         = {2026},
  howpublished = {\url{https://pith.science/paper/BVTGZCZA}},
  note         = {Machine review of arXiv:2608.05864}
}
read the original abstract
Large language models are increasingly applied as autonomous decision-making agents. However, in executive business decisions, existing benchmarks are limited to textonly settings. This makes it unclear whether models can perceive visual business evidence and effectively integrate it to improve decision quality. We introduce C-SUITEBENCH, a controlled multimodal benchmark that includes five decision tasks under paired text-only and multimodal conditions across 50 scenarios. We place nine frontier models in the role of a chief executive officer and evaluate their decision-making ability. Multimodal inputs consistently improve evidence-centric reasoning, with the largest and most reliable gains appearing in risk forecasting and board-facing justification. However, we uncover a multimodal integration paradox: adding visual business information degrades constrained resource allocation for all nine models, even as visual grounding itself improves. Ablation experiments reveal that this failure emerges from signal crowding, although each visual channel helps individually, their combination disrupts constraint satisfaction during decoding. These findings demonstrate that visual perception and constrained action are separable bottlenecks in multimodal agents, and that indiscriminate visual augmentation can harm high-stakes decision making, motivating selective grounding strategies for future executive AI systems.
Figures


Figures from the paper (6 more)



Reference graph
Works this paper leans on
-
[3]
Chen, H.; Narasimhan, K.; and Liu, Z
Fi- nance agent benchmark: Benchmarking llms on real-world financial research tasks.arXiv preprint arXiv:2508.00828. Chen, H.; Narasimhan, K.; and Liu, Z
-
[4]
CEO-Bench: Can Agents Play the Long Game?
CEO- Bench: Can Agents Play the Long Game?arXiv preprint arXiv:2606.18543. Chen, Z.; Chen, W.; Smiley, C.; Shah, S.; Borova, I.; Lang- don, D.; Moussa, R.; Beane, M.; Huang, T.-H.; Routledge, B. R.; et al
-
[7]
Can LLMs Be CEOs? Benchmarking Strategic Resource Reallocation with Multi-Role Agent Simulation
Finagentbench: A benchmark dataset for agentic retrieval in financial question answering. InProceedings of the 6th ACM International Conference on AI in Finance, 632–637. Dai, Y .; Lin, Y .; Xie, Z.; and Wang, Y . 2026a. RealFin: How Well Do LLMs Reason About Finance When Users Leave Things Unsaid? In Liakata, M.; Moreira, V . P.; Zhang, J.; and Jurgens, ...
work page Pith review arXiv 2026
-
[10]
Bizbench: A quantita- tive reasoning benchmark for business and finance.arXiv preprint arXiv:2311.06602. Kundurthy, S.; Na, C.; Moraine, C.; Mohta, A.; Winter, C.; Fang, G.; Ling, J.; Strubell, E.; and Kirshner, Z
-
[11]
Liu, X.; Yu, H.; Zhang, H.; Xu, Y .; Lei, X.; Lai, H.; Gu, Y .; Ding, H.; Men, K.; Yang, K.; et al
BlueFin: Benchmarking LLM Agents on Financial Spread- sheets.arXiv preprint arXiv:2605.30907. Liu, X.; Yu, H.; Zhang, H.; Xu, Y .; Lei, X.; Lai, H.; Gu, Y .; Ding, H.; Men, K.; Yang, K.; et al. 2024a. Agentbench: Evaluating llms as agents. InInternational Conference on Learning Representations, volume 2024, 52989–53046. Liu, Y .; Li, Z.; Huang, M.; Yang, ...
arXiv 2024
-
[12]
Bizfinbench: A business-driven real-world financial bench- mark for evaluating llms.arXiv preprint arXiv:2505.19457. Lu, P.; Bansal, H.; Xia, T.; Liu, J.; Li, C.; Hajishirzi, H.; Cheng, H.; Chang, K.-W.; Galley, M.; and Gao, J
-
[14]
InFindings of the As- sociation for Computational Linguistics: ACL 2024, 10387– 10409
Chartinstruct: Instruction tuning for chart comprehension and reasoning. InFindings of the As- sociation for Computational Linguistics: ACL 2024, 10387– 10409. Masry, A.; Tan, J. Q.; Joty, S.; Hoque, E.; et al
work page 2024
-
[15]
InFindings of the associ- ation for computational linguistics: ACL 2022, 2263–2279
Chartqa: A benchmark for question answering about charts with visual and logical reasoning. InFindings of the associ- ation for computational linguistics: ACL 2022, 2263–2279. Mathew, M.; Karatzas, D.; and Jawahar, C
work page 2022
Show all 23 references
-
[17]
InICASSP 2026-2026 IEEE International Conference on Acoustics, Speech and Signal Processing (ICASSP), 16987–16991
Dsgbench: A diverse strategic game benchmark for evaluating llm-based agents in complex decision-making environments. InICASSP 2026-2026 IEEE International Conference on Acoustics, Speech and Signal Processing (ICASSP), 16987–16991. IEEE. Wei, J.; Wang, X.; Schuurmans, D.; Bos...
2026
-
[18]
arXiv:2406.12045
τ-bench: A Benchmark for Tool-Agent-User Interaction in Real-World Domains. arXiv:2406.12045. Yao, S.; Yu, D.; Zhao, J.; Shafran, I.; Griffiths, T.; Cao, Y .; and Narasimhan, K
-
[19]
Yao, S.; Zhao, J.; Yu, D.; Du, N.; Shafran, I.; Narasimhan, K.; and Cao, Y
Tree of thoughts: Deliber- ate problem solving with large language models.Advances in neural information processing systems, 36: 11809–11822. Yao, S.; Zhao, J.; Yu, D.; Du, N.; Shafran, I.; Narasimhan, K.; and Cao, Y . 2022b. React: Synergizing reason- ing and acting in langua...
-
[20]
arXiv preprint arXiv:2404.16006
Mmt- bench: A comprehensive multimodal benchmark for evalu- ating large vision-language models towards multitask agi. arXiv preprint arXiv:2404.16006. Yue, X.; Ni, Y .; Zhang, K.; Zheng, T.; Liu, R.; Zhang, G.; Stevens, S.; Jiang, D.; Ren, W.; Sun, Y .; et al
-
[21]
InProceedings of the IEEE/CVF conference on computer vision and pattern recognition, 9556–9567
Mmmu: A massive multi-discipline multimodal understanding and reasoning benchmark for expert agi. InProceedings of the IEEE/CVF conference on computer vision and pattern recognition, 9556–9567. Zhang, L.; Wang, J.; Wu, J.; and Zhang, Z. 2026a. Retail- Bench: Evaluating Long-Ho...
-
[22]
arXiv preprint arXiv:2210.03493
Auto- matic chain of thought prompting in large language models. arXiv preprint arXiv:2210.03493. Appendix Contents The appendix is organized as follows: Appendix A: Evaluation Protocol Details. . . Appendix A A.1 Scoring Architecture . . . . . . . . . . . . . . . . . . . . Ap...
-
[95]
at1024×1024resolution and passed as inline image content. A spot-check on 10 scenarios com- paring JPEG (q95) against lossless PNG encoding produced task-score differences below0.01on both T3 and T4, indi- cating that the encoding format is not a material confound. No model-sp...
2026
-
[2017]
Koncel-Kedziorski, R.; Krumdick, M.; Lai, V .; Reddy, V .; Lovering, C.; and Tanner, C
Figureqa: An anno- tated figure dataset for visual reasoning.arXiv preprint arXiv:1710.07300. Koncel-Kedziorski, R.; Krumdick, M.; Lai, V .; Reddy, V .; Lovering, C.; and Tanner, C
-
[2020]
Tang, W.; Zhou, Y .; Cheng, K.; Xu, E.; Xiao, L.; and Li, M
Alfworld: Aligning text and em- bodied environments for interactive learning.arXiv preprint arXiv:2010.03768. Tang, W.; Zhou, Y .; Cheng, K.; Xu, E.; Xiao, L.; and Li, M
2010 arXiv
-
[2021]
InProceedings of the 2021 Confer- ence on Empirical Methods in Natural Language Process- ing, 3697–3711
Finqa: A dataset of numerical reason- ing over financial data. InProceedings of the 2021 Confer- ence on Empirical Methods in Natural Language Process- ing, 3697–3711. Chen, Z.; Li, S.; Smiley, C.; Ma, Z.; Shah, S.; and Wang, W. Y
2021
-
[2022]
In Proceedings of the 2022 conference on empirical methods in natural language processing, 6279–6292
Convfinqa: Exploring the chain of numerical reasoning in conversational finance question answering. In Proceedings of the 2022 conference on empirical methods in natural language processing, 6279–6292. Choi, C.; Kwon, J.; Lopez-Lira, A.; Kim, C.; Kim, M.; Hwang, J.; Ha, J.; Ch...
2022
-
[2023]
Kahou, S
Financebench: A new bench- mark for financial question answering.arXiv preprint arXiv:2311.11944. Kahou, S. E.; Michalski, V .; Atkinson, A.; K ´ad´ar, ´A.; Trischler, A.; and Bengio, Y
-
[2024]
InInternational Conference on Learning Representations, volume 2024, 23439–23554
Mathvista: Evaluating mathematical reasoning of founda- tion models in visual contexts. InInternational Conference on Learning Representations, volume 2024, 23439–23554. Masry, A.; Shahmohammadi, M.; Parvez, M. R.; Hoque, E.; and Joty, S
2024
-
[2025]
Bigeard, A.; Nashold, L.; Krishnan, R.; and Wu, S
Qwen2.5-VL Technical Report.arXiv preprint arXiv:2502.13923. Bigeard, A.; Nashold, L.; Krishnan, R.; and Wu, S
-
[2026]
Anthropic
Fintradebench: A financial reasoning bench- mark for llms.arXiv preprint arXiv:2603.19225. Anthropic
Reviewed August 7, 2026 · model on record in the stance chip above.
Discussion (0). Continue with ORCID to comment.