REVIEW 3 major objections 3 minor 47 references
Spectroscopically confirmed Little Red Dots concentrate in two well-defined regions of a data map of 242,000 JWST sources, built with no colour cut; selecting there reaches ~78% purity at ~82% completeness and yields ~100 new candidates.
Reviewed by Pith at T0; open to challenge. T0 means a machine referee read the full paper against a public rubric. the ladder, T0–T4 →
T0 review · deepseek-v4-flash
2026-08-01 04:22 UTC pith:BZ6TOAB3
load-bearing objection A careful, honest method paper whose headline purity/completeness numbers are partly in-sample; the approach is novel and worth engaging, but the quantitative edge over colour cuts isn't yet proven. the 3 major comments →
Unsupervised selection and characterisation of Little Red Dots in JWST surveys with manifold learning
The pith
A machine-rendered reading of the paper's core claim, the machinery that carries it, and where it could break.
Core claim
On a two-dimensional UMAP embedding built from eleven features per source — seven F356W-normalised broadband colours, reference flux, two morphology indicators and photometric redshift — spectroscopically confirmed LRDs are strongly localised: a core enclosing 90% of the anchors holds fewer than a thousand of the 242,000 sources. The anchors form two clusters — a main locus of 56 (median z≈5.1) and a secondary locus of 11 (median z≈3.4) — enclosed by a Mahalanobis ellipse (an iso-probability contour of the anchor distribution) and a minimum-volume ellipse. The main region contains 282 sources, recovers 82% of the in-sample anchors at a purity of about 0.78 over the PRISM-classified subset, a
What carries the argument
The central machinery is the UMAP manifold itself: a two-dimensional projection of 242,327 sources in an eleven-dimensional feature space of broadband colours, morphology (stellarity, half-light radius) and photometric redshift, computed before any labels enter. The procedure turns semi-supervised only at the anchoring step: the handful of spectroscopically confirmed LRDs — classified from the V-shape of their continuum rather than from broadband colours — are clustered by density, and each cluster is enclosed by an ellipse whose size is the tunable completeness knob; a Mahalanobis iso-probability contour does this for the main locus, a minimum-volume ellipse for the elongated secondary one.
Load-bearing premise
The demonstration rests on the assumption that the spectroscopically confirmed LRDs used as the anchor are free of colour selection; the authors concede (Section 5.1) that the classification rests on the V-shaped continuum, a continuum-based counterpart of a colour selection, so the manifold region inherits the colour prior of the spectroscopic targeting, and the headline purity and completeness are measured relative to that V-shape-selected population rather than to all LRDs
What would settle it
Re-anchor the same UMAP embedding with LRDs selected orthogonally to the V-shape — e.g., compact X-ray sources or broad Balmer lines only — and check whether the regions move; if they do, the locus is an artefact of the continuum-shape prior. A cheaper test: take PRISM spectra of the 107 new candidates and the ~546 z≈8 candidates; if most lack the V-shape or broad lines, the ~0.78 purity does not extend beyond the already-classified subset and the z≈8 extension is refuted.
If this is right
- Photometric LRD selection no longer needs hand-tuned colour boundaries: on one common parent sample, the data-driven main region reaches the highest combined completeness–purity (Q≈0.80) of the compared selections, while the best two-branch colour cut reaches Q≈0.79.
- The two loci are genuinely distinct populations, separated mainly by redshift and rest-UV luminosity rather than by emission-line properties; the lower-redshift secondary locus is where the four newly confirmed broad-line AGN sit, marking it as a follow-up target.
- Brown dwarfs, the classic LRD contaminants, separate by themselves: the manifold reproduces the standard colour rejection without being told to, so contamination is visible and measurable rather than assumed.
- The 107 new candidates are compact, at LRD-like redshifts, with bluer rest-optical colours — exactly the sources the strictest redness cuts exclude — implying that published LRD samples built on those cuts miss this bluer tail of the population.
- The 546-source neighbourhood around the single outlying anchor, with photometric redshifts piled at z≈8 and a V-shaped stacked SED, is a concrete, spectroscopically testable prediction of a higher-redshift continuation of the main LRD locus.
Where Pith is reading between the lines
- If the paper is right, the same anchored-manifold recipe should transfer to other surveys and populations — but the purity numbers are only as good as the anchor: an anchor built from emission-line- or X-ray-selected objects could shift the locus, so the 'no colour cut' claim should be read with the qualifier 'no colour cut beyond the spectroscopic targeting's own colour dependence.'
- A natural extension is to run the same embedding on shallower but wider surveys, or directly on spectra, to test whether the two loci persist at lower flux limits; the paper itself notes its bluest-NIRCam-band detection requirement and isolation cut remove a preferentially high-redshift slice, so a censored-flux version of the feature space is the most direct upgrade.
- The secondary locus is the fragile part of the result: re-including the single discrepant bright anchor inflates its region from 110 to 698 sources and drops purity from ~41% to ~7%, so a targeted spectroscopic campaign over the grating-only sources in that region — where the four new AGN were found — would either stabilise or dissolve it.
Editorial analysis
A structured set of objections, weighed in public.
Referee Report
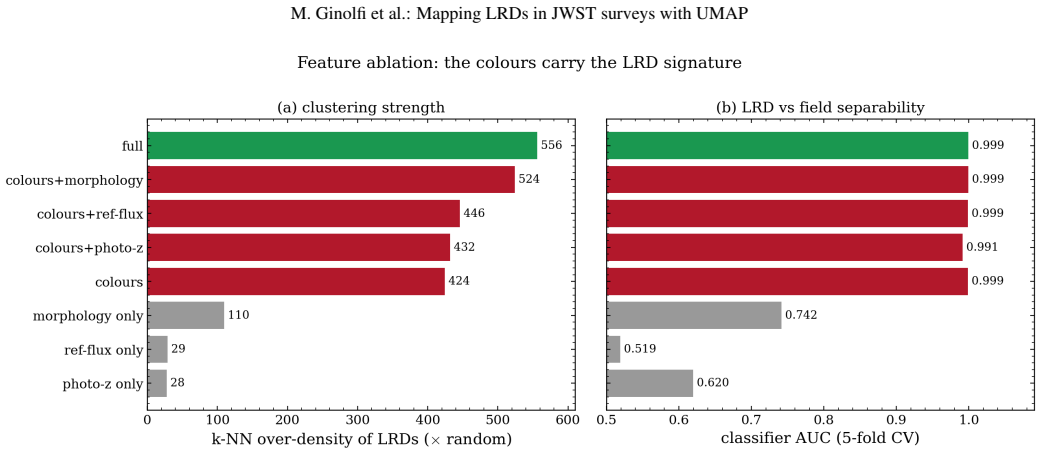
Summary. The paper proposes an unsupervised, label-anchored manifold-learning method for selecting Little Red Dots (LRDs) in JWST surveys and demonstrates it on the ASTRODEEP-JWST catalogue. ~242,000 isolated, well-measured sources are embedded in two dimensions with UMAP using eleven features — seven F356W-normalised broadband colours, the reference flux, stellarity, half-light radius, and photometric redshift (Table 1). The embedding is anchored by the 68 spectroscopically selected de Graaff et al. (2025) LRDs that pass the pre-processing; the anchors split into two groups, and Mahalanobis ellipses define a main region (56 anchors, f=1.0) and a secondary filament (10 anchors). The main region is reported to reach ~0.78 purity at ~0.82 completeness over the PRISM-classified subset, yields 107 new candidates, and is compared with four literature colour cuts re-applied to the same parent sample under common compactness and brown-dwarf rejection (Table 2). Auxiliary results include: feature-space verification of the localisation, a cross-validated supervised classifier as a diagnostic, a feature-ablation showing the colours alone carry the LRD signature, natural brown-dwarf separation, two populations differing mainly in redshift, four new broad-line AGN from archival grating spectroscopy, and a speculative z~8 extension of the main locus. The paper is transparent about its main weakness — the region is defined using the anchors and evaluated against them (§4.3; §5.1) — and about the co
Significance. If the central quantitative claim holds, the paper delivers a useful framework rather than merely another LRD catalogue: a common completeness–purity basis on which any selection can be compared (literature criteria re-applied to the identical parent sample, §3.3), a clean separation of intrinsic from end-to-end completeness (§2.4), and a tunable, transparent operating curve instead of a fixed cut. The ancillary results are credible and well-hedged: the brown-dwarf separation, the redshift-driven two-locus structure, the four grating-spectroscopy AGN, and the explicitly speculative z~8 prediction. The paper ships unusual methodological care: hyperparameter robustness checks (§3.1), bootstrap candidate stability (Jaccard 0.94), a label-permutation null test, and explicit disclosure of the in-sample evaluation. The unresolved point is whether the headline 0.78/0.82 is an independent measurement or partly a restatement of the anchor's V-shape colour prior; because the comparison against literature cuts is asymmetric in this respect, the quantitative advantage claimed in the abstract is not yet established at full strength. The gap is fixable within the paper's scope.
major comments (3)
- [§3.2, §4.3, Table 2 (and abstract)] The headline purity/completeness is an in-sample evaluation, and the comparison with the literature is asymmetric. The main-region ellipse is fit to all 56 DBSCAN-grouped anchors (§3.2); the f=1.0 completeness of 0.82 is, by construction, the fraction of the 68 in-sample anchors in the main cluster. The four literature 'criteria' points in Table 2 are genuinely out-of-sample: their thresholds were fixed without the anchor. The neural-network cross-validation (§4.2, Appendix A) tests a supervised classifier, not the geometric region, and no version of the Mahalanobis region is defined on a training half of the anchors and scored on the complementary half. I request a leave-half-out version of the region construction, reporting completeness and PRISM-subset purity of the region as a function of f on held-out anchors. Without this, 'competitive with, or cleaner than, literature colour cuts'
- [§4.3 (purity definition); cf. §1] Purity is measured only over the grade-3 PRISM-classified subset: the denominator is spectroscopically observed sources, the numerator is V-shape-classified LRDs. The paper correctly states that this is not the purity of the whole photometric sample and that classification is exhaustive within the subset. The composition of the subset is itself a selection, however: as §1 notes, archival spectroscopic samples 'deliberately targeted colour-selected candidates', so the PRISM-covered fraction of the region is enriched in LRD-like colours, and the quoted 0.78 is conditional on that enrichment, with the bias direction likely toward higher purity. This caveat should be stated where 0.78 is quoted in §4.3 and ideally quantified, e.g. by recomputing purity after assigning the interloper fraction (11 sources) to the spectroscopically unobserved members, or by reporting purity among PRISM-classifi
- [Abstract; §5.1, §5.3] The abstract's 'no colour cut imposed' is stronger than what is demonstrated and is in tension with the paper's own analysis. §5.1 concedes that the de Graaff et al. anchor 'rests on the continuum V-shape... a refined, continuum-based counterpart of a colour selection rather than one orthogonal to it', and §5.3 shows the seven broadband colours alone reproduce essentially the full localisation (classifier AUC 0.999), with morphology and photo-z largely redundant for identification. The manifold region is therefore a learned, higher-dimensional version of a colour selection, not a selection orthogonal to colour cuts. This is not an internal inconsistency — §5.1 is admirably clear — but the abstract and §1 framing ('without relying on predefined colour cuts', 'without human-induced priors') should carry the qualification (e.g., 'without hand-designed colour thresholds'), and the implicatio
minor comments (3)
- [§3.3, Table 2] State explicitly whether the common compactness proxy (ClassStarSE>0.8) and the F115W−F200W>−0.5 brown-dwarf cut are applied to the data-driven ellipse selection before the Table 2 entry is computed. The literature 'criteria' points include these cuts; if the data-driven row does not, the like-for-like comparison is not exactly symmetric (though §5.3 suggests applying the proxy would raise, not lower, the data-driven purity).
- [Figure 3] The filled 'catalogue' symbols are on a different evaluation basis (positional matches, not the common parent sample) from the open 'criteria' symbols; the caption should state that only the open symbols participate in the like-for-like comparison.
- [§5.2] The circular neighbourhood around the discarded outlier uses a radius equal to the mean semi-axis of the main-locus ellipse. This is flagged as a proxy, but the sensitivity of the 546-source count and the z_phot≃8 pile-up to that choice (e.g., semi-major axis, or a 90%-anchor contour) is not explored; a one-sentence robustness note would calibrate how speculative the z~8 prediction is.
Circularity Check
Main-region completeness is fixed by the f=1.0 ellipse choice (56/68 = 0.82 by construction), and purity is measured on the same anchors used to define the region; part of the headline comparison is in-sample.
specific steps
-
fitted input called prediction
[Section 3.2 (ellipse sizing) and Section 4.3 (reported completeness)]
"The completeness with respect to the anchor is therefore a design parameter that we set and vary (we consider f between 0.5 and 1.0, and adopt f=1.0, which encloses all 56 main-region anchors, as the fiducial value) ... At its fiducial size the main-region selection recovers 82% of the in-sample anchors at a purity of ≈0.78"
The f=1.0 Mahalanobis ellipse is explicitly sized to enclose all 56 main-region anchors. Since 68 de Graaff anchors enter the sample, 56/68 = 0.82, so the reported 82% completeness is the design fraction f restated as a measured recovery. The ellipse was built on those same objects, so this headline number is true by construction rather than an independent test of the selection.
-
self definitional
[Section 4.3 and Section 5.1]
"the region is defined using the anchor and then evaluated against it, which favours the data-driven selection, and our purity is measured only over the PRISM-classified subset."
The same de Graaff spectroscopic classification supplies both the anchors used to centre and size the Mahalanobis region and the labels used to count confirmed LRDs inside it. The quoted purity (≈0.78) is therefore an in-sample self-evaluation, not an out-of-sample prediction. The paper points to the Section 4.2 cross-validation as a fairer test, but that test is a supervised classifier on held-out anchors and never redefines the Mahalanobis region; it does not provide an out-of-sample purity for the headline selection.
full rationale
Most of the derivation is not circular: the UMAP embedding is built without labels; the concentration of the spectroscopic LRDs is supported by a label-permutation test and by ~520x k-NN over-density in the original 11-D feature space; and a five-fold cross-validated neural classifier recovers ~90% of held-out anchors. These tests genuinely support the claim that LRDs occupy a distinct locus. The circularity is confined to the headline quantitative comparison in Section 4.3/Table 2. The main-region ellipse is sized with f=1.0 so as to enclose all 56 main-region anchors, so the reported 82% completeness is simply 56/68 of the in-sample anchors, i.e. the design parameter rather than a measured recovery rate. The 0.78 purity is measured over the PRISM-classified subset using the same de Graaff classification that supplied the anchors, making it an in-sample estimate; the paper explicitly concedes that 'the region is defined using the anchor and then evaluated against it, which favours the data-driven selection.' The cross-validation offered as a fairer test does not rebuild the Mahalanobis region or report its purity, so it does not rescue the 0.78/0.82 numbers from being partly by construction. Additionally, the abstract's 'without relying on predefined colour cuts' framing is weakened by the authors' own admission that the de Graaff anchor is 'a refined, continuum-based counterpart of a colour selection rather than one orthogonal to it,' so the unsupervised locus partially re-encodes the known V-shape selection. These are partial circularities, not a wholesale collapse: the 107-candidate list, the two-population redshift split, and the four new broad-line AGN are genuine outputs that do not reduce to the inputs.
Axiom & Free-Parameter Ledger
free parameters (6)
- Enclosed anchor fraction f (Mahalanobis radius scale) =
1.0 (fiducial); varied 0.5–1.0
- UMAP hyperparameters (n_neighbors=15, min_dist=0, Manhattan metric) =
15, 0, Manhattan
- Compactness proxy ClassStarSE > 0.8 =
0.8
- Signal-to-noise threshold S/N > 2 per band (F814W excepted) =
2
- F444W < 26 luminosity cut =
26 (mag)
- Brown-dwarf rejection colour F115W−F200W > −0.5 =
-0.5
axioms (6)
- domain assumption ASTRODEEP-JWST catalogue photometry, morphology and EAZY photometric redshifts are accurate and homogeneous across the six fields.
- domain assumption The de Graaff et al. (2025) spectroscopic sample provides correct LRD labels and is a valid ground truth.
- standard math UMAP embedding preserves the local neighbourhood structure of the 11-dimensional feature space.
- domain assumption The grade-3 PRISM-classified subset is representative of the whole spectroscopically followed population.
- domain assumption The isolation criterion (neighbour within 0.5″ removed) does not remove a significant fraction of LRDs.
- domain assumption A two-dimensional Gaussian/Mahalanobis ellipse is an adequate description of the LRD locus.
invented entities (1)
-
High-redshift (z~8) extension of the main LRD locus
independent evidence
Cite this review
Pith. "Pith review of Unsupervised selection and characterisation of Little Red Dots in JWST surveys with manifold learning." pith.science (2026). https://pith.science/paper/BZ6TOAB3
@misc{pith2026260722835,
  author       = {Pith},
  title        = {Pith review of: Unsupervised selection and characterisation of Little Red Dots in JWST surveys with manifold learning},
  year         = {2026},
  howpublished = {\url{https://pith.science/paper/BZ6TOAB3}},
  note         = {Machine review of arXiv:2607.22835}
}
read the original abstract
Little Red Dots (LRDs) are compact, red sources discovered at high redshift by JWST whose physical nature and selection function remain debated. We investigate whether an unsupervised machine-learning approach applied to multi-band photometry can identify LRD-like objects, and other populations, without relying on predefined colour cuts. Using UMAP, a manifold-learning (dimensionality-reduction) method, we place ~242,000 isolated, well-measured sources from the ASTRODEEP-JWST catalogue on a two-dimensional map, where objects with similar broadband colours, morphology, and photometric redshift lie close together. We then use spectroscopically confirmed LRDs to identify where LRD-like objects lie within this map, compare the resulting areas with published colour cuts, and validate our data-driven selection against archival NIRSpec spectra from the DJA. We find that the spectroscopically selected LRDs concentrate in two well-defined regions with no colour cut imposed, tracing populations that differ mainly in redshift, a difference imprinted in their broadband colours. The main region reaches a purity of ~0.78 at ~0.82 completeness on the spectroscopically classified subset, competitive with, or cleaner than, literature colour cuts, and yields ~100 additional candidates. We also test the method as a general tool for population discovery: the manifold recovers the locations of brown dwarfs and broad-line AGN with no explicit criterion, and isolates rare pathological outliers. Overall, unsupervised manifolds, anchored by sparse high-confidence spectroscopic labels, provide an efficient, assumption-light framework for characterising populations, comparing selection methods on a common basis, and discovering rare objects in large photometric datasets.
Figures




Reference graph
Works this paper leans on
-
[1]
B., Casey, C
Akins, H. B., Casey, C. M., Lambrides, E., et al. 2025, ApJ, 991, 37
2025
-
[2]
A., Siudek, M., Eriksen, M., et al
Alcolea, J. A., Siudek, M., Eriksen, M., et al. 2026, arXiv e-prints, arXiv:2607.07329 Arrabal Haro, P., Dickinson, M., Finkelstein, S. L., et al. 2023, Nature, 622, 707 Astropy Collaboration, Price-Whelan, A. M., Lim, P. L., et al. 2022, ApJ, 935, 167
Pith/arXiv arXiv 2026
-
[3]
Baccus, C. & Xu, X. 2025, arXiv e-prints, arXiv:2512.03281
arXiv 2025
-
[4]
Baggen, J. F. W., Scoggins, M. T., van Dokkum, P., et al. 2026, ApJ, 1002, L4
2026
-
[5]
B., Finkelstein, S
Bagley, M. B., Finkelstein, S. L., Koekemoer, A. M., et al. 2023, ApJ, 946, L12
2023
-
[6]
B., Pirzkal, N., Finkelstein, S
Bagley, M. B., Pirzkal, N., Finkelstein, S. L., et al. 2024, ApJ, 965, L6
2024
-
[7]
G., Kocevski, D
Barro, G., Pérez-González, P. G., Kocevski, D. D., et al. 2024, ApJ, 963, 128
2024
-
[8]
E., et al
Bezanson, R., Labbe, I., Whitaker, K. E., et al. 2024, ApJ, 974, 92
2024
-
[9]
B., van Dokkum, P
Brammer, G. B., van Dokkum, P. G., & Coppi, P. 2008, ApJ, 686, 1503
2008
-
[10]
2026, arXiv e-prints, arXiv:2601.22214
Brazzini, M., D’Eugenio, F., Maiolino, R., et al. 2026, arXiv e-prints, arXiv:2601.22214
arXiv 2026
-
[11]
Casey, Q. O., Hickox, R. C., Cleri, N. J., et al. 2026, arXiv e-prints, arXiv:2606.26098 de Graaff, A., Hviding, R. E., Naidu, R. P., et al. 2025, arXiv e-prints, arXiv:2511.21820 D’Eugenio, F., Cameron, A. J., Scholtz, J., et al. 2025, ApJS, 277, 4
Pith/arXiv arXiv 2026
-
[12]
S., Abraham, R
Dunlop, J. S., Abraham, R. G., Ashby, M. L. N., et al. 2021, PRIMER: Public Release IMaging for Extragalactic Research, JWST Proposal. Cycle 1, ID. #1837
2021
-
[13]
J., Johnson, B
Eisenstein, D. J., Johnson, B. D., Robertson, B., et al. 2025, ApJS, 281, 50
2025
-
[14]
J., Willott, C., Alberts, S., et al
Eisenstein, D. J., Willott, C., Alberts, S., et al. 2026, ApJS, 283, 6
2026
-
[15]
L., Bagley, M
Finkelstein, S. L., Bagley, M. B., Ferguson, H. C., et al. 2023, ApJ, 946, L13
2023
-
[16]
2024, Astronomy and Computing, 48, 100851
Fotopoulou, S. 2024, Astronomy and Computing, 48, 100851
2024
-
[17]
2026, Nature Astronomy [arXiv:2512.02096]
Fu, S., Zhang, Z., Jiang, D., et al. 2026, Nature Astronomy [arXiv:2512.02096]
arXiv 2026
-
[18]
E., Labbe, I., Goulding, A
Greene, J. E., Labbe, I., Goulding, A. D., et al. 2024, ApJ, 964, 39
2024
-
[19]
N., Helton, J
Hainline, K. N., Helton, J. M., Johnson, B. D., et al. 2024, ApJ, 964, 66
2024
-
[20]
N., Helton, J
Hainline, K. N., Helton, J. M., Miles, B. E., et al. 2026, ApJ, 1004, 223
2026
-
[21]
R., Millman, K
Harris, C. R., Millman, K. J., van der Walt, S. J., et al. 2020, Nature, 585, 357
2020
-
[22]
E., Watson, D., Brammer, G., et al
Heintz, K. E., Watson, D., Brammer, G., et al. 2024, Science, 384, 890
2024
-
[23]
E., Sun, Y ., & Davey, N
Hocking, A., Geach, J. E., Sun, Y ., & Davey, N. 2018, MNRAS, 473, 1108
2018
-
[24]
Hunter, J. D. 2007, Computing in Science and Engineering, 9, 90 Juodžbalis, I., Ji, X., Maiolino, R., et al. 2024, MNRAS, 535, 853
2007
-
[25]
D., Finkelstein, S
Kocevski, D. D., Finkelstein, S. L., Barro, G., et al. 2025, ApJ, 986, 126
2025
-
[26]
I., Greene, J
Kokorev, V ., Caputi, K. I., Greene, J. E., et al. 2024, ApJ, 968, 38 Labbé, I., van Dokkum, P., Nelson, E., et al. 2023, Nature, 616, 266
2024
-
[27]
2026, arXiv e-prints, arXiv:2605.21574
Lin, X., Fan, X., Cai, Z., et al. 2026, arXiv e-prints, arXiv:2605.21574
Pith/arXiv arXiv 2026
-
[28]
2025, A&A, 703, A36
Loiacono, F., Gilli, R., Mignoli, M., et al. 2025, A&A, 703, A36
2025
- [29]
-
[30]
P., Brammer, G., et al
Matthee, J., Naidu, R. P., Brammer, G., et al. 2024, ApJ, 963, 129
2024
-
[31]
2026, arXiv e-prints, arXiv:2603.17667
Matthee, J., Torralba, A., Pezzulli, G., et al. 2026, arXiv e-prints, arXiv:2603.17667
arXiv 2026
-
[32]
2018, arXiv e-prints, arXiv:1802.03426 Article number, page 17 A&A proofs:manuscript no
McInnes, L., Healy, J., & Melville, J. 2018, arXiv e-prints, arXiv:1802.03426 Article number, page 17 A&A proofs:manuscript no. lrd_umap_aa Fig. 13.Three peculiar regions that the manifold isolates without any prior definition, one per row:top, saturated bright stars;middle, catastrophic photometric-redshift failures (Galactic stars fitted with high-redsh...
Pith/arXiv arXiv 2018
-
[33]
2024, A&A, 691, A240
Merlin, E., Santini, P., Paris, D., et al. 2024, A&A, 691, A240
2024
-
[34]
2026, arXiv e-prints, arXiv:2606.09721
Pan, Z., Zhuang, M.-Y ., Shen, Y ., et al. 2026, arXiv e-prints, arXiv:2606.09721
Pith/arXiv arXiv 2026
-
[35]
2026, arXiv e-prints, arXiv:2605.14233
Park, K., Torralba, A., Matthee, J., et al. 2026, arXiv e-prints, arXiv:2605.14233
Pith/arXiv arXiv 2026
-
[36]
2011, Journal of Machine Learning Research, 12, 2825 Pérez-González, P
Pedregosa, F., Varoquaux, G., Gramfort, A., et al. 2011, Journal of Machine Learning Research, 12, 2825 Pérez-González, P. G., Barro, G., Carniani, S., et al. 2026, arXiv e-prints, arXiv:2602.20247
arXiv 2011
-
[37]
Portillo, S. K. N., Parejko, J. K., Vergara, J. R., & Connolly, A. J. 2020, AJ, 160, 45
2020
-
[38]
X., & Wolf, L
Reis, I., Rotman, M., Poznanski, D., Prochaska, J. X., & Wolf, L. 2021, Astron- omy and Computing, 34, 100437
2021
-
[39]
J., Robertson, B., Tacchella, S., et al
Rieke, M. J., Robertson, B., Tacchella, S., et al. 2023, ApJS, 269, 16
2023
-
[40]
2026, arXiv e-prints, arXiv:2604.07138
Rinaldi, P., Hainline, K., D’Eugenio, F., et al. 2026, arXiv e-prints, arXiv:2604.07138
Pith/arXiv arXiv 2026
-
[41]
P., et al
Rusakov, V ., Watson, D., Nikopoulos, G. P., et al. 2026, Nature, 649, 574
2026
- [42]
-
[43]
Sneppen, A., Matthews, J. H., Watson, D., et al. 2026, arXiv e-prints, arXiv:2604.09399
Pith/arXiv arXiv 2026
-
[44]
2022, ApJ, 935, 110
Treu, T., Roberts-Borsani, G., Bradac, M., et al. 2022, ApJ, 935, 110
2022
-
[45]
Valentino, F., Brammer, G., Gould, K. M. L., et al. 2023, ApJ, 947, 20 van der Maaten, L. & Hinton, G. 2008, Journal of Machine Learning Research, 9, 2579
2023
-
[46]
E., et al
Virtanen, P., Gommers, R., Oliphant, T. E., et al. 2020, Nature Medicine, 17, 261 Wes McKinney. 2010, in Proceedings of the 9th Python in Science Conference, ed. Stéfan van der Walt & Jarrod Millman, 56 – 61
2020
-
[47]
C., & Inayoshi, K
Zhang, Z., Jiang, L., Liu, W., Ho, L. C., & Inayoshi, K. 2026, ApJ, 998, 170 Article number, page 18 M. Ginolfi et al.: Mapping LRDs in JWST surveys with UMAP Appendix A: Feature-space classifier validation As an additional check that the LRD localisation is not a pro- jection artefact, we trained a supervised classifier directly on the original feature v...
2026
discussion (0)
Sign in with ORCID, Apple, or X to comment. Anyone can read and Pith papers without signing in.