REVIEW 5 major objections 7 minor 29 references
Iterative Encoding-Decoding VAEs Anomaly Detection in NOAA's DART Time Series: A Machine Learning Approach for Enhancing Data Integrity for NASA's GRACE-FO Verification and Validation
T0 review · 5 major / 7 minor · reviewed 2026-08-11 · deepseek-v4-flash
Pith's one-line read This paper argues that an iterative variational-autoencoder loop removes spikes, step shifts, and drift from deep-ocean bottom-pressure time series while preserving tides and other oceanographic signal, outperforming classical despiking…
desk verdict Iterative VAE cleaning for DART data: plausible idea, but the paper never tests the central claim—no baselines, no ground truth, and a circular residual evaluation. read the letter →
The pith
A machine-rendered reading of the paper's core claim, the machinery that carries it, and where it could break.
The reading
What carries the argument
The load-bearing object is the iterative refinement loop itself. A VAE with a 48-sample window encodes to a 16-dimensional latent vector and decodes back; the decoder mirrors the encoder and adds a global skip connection that carries the input baseline through, countering baseline drift. Instead of one pass, the model sets its first reconstruction to the normalized input and for up to ten iterations encodes the previous reconstruction, blends latent variables with a stability factor, and applies a hybrid anomaly mask that weights VAE reconstruction error at 0.7 and statistical deviation at 0.3. Flagged points are replaced by the current reconstruction, so each pass sees a progressively cleaner signal and later passes can catch finer or subtler anomalies. The architecture is deliberately generic, using dense layers, batch normalization, dropout, Adam, and gradient clipping, so the loop, not bespoke feature engineering, carries the claimed advantage.
What would settle it
Seed a clean deep-ocean tide record with synthetic spikes and step shifts, run the full training-and-refinement pipeline on that contaminated version, and compare the output with the known clean record; if the cleaned series does not recover the seeded baseline to within roughly the paper's reported residual band, the central claim fails. A second check is to insert a genuine weak tsunami-like signal and see whether the loop preserves it rather than flagging it as an anomaly.
Extended reading notes
Core claim
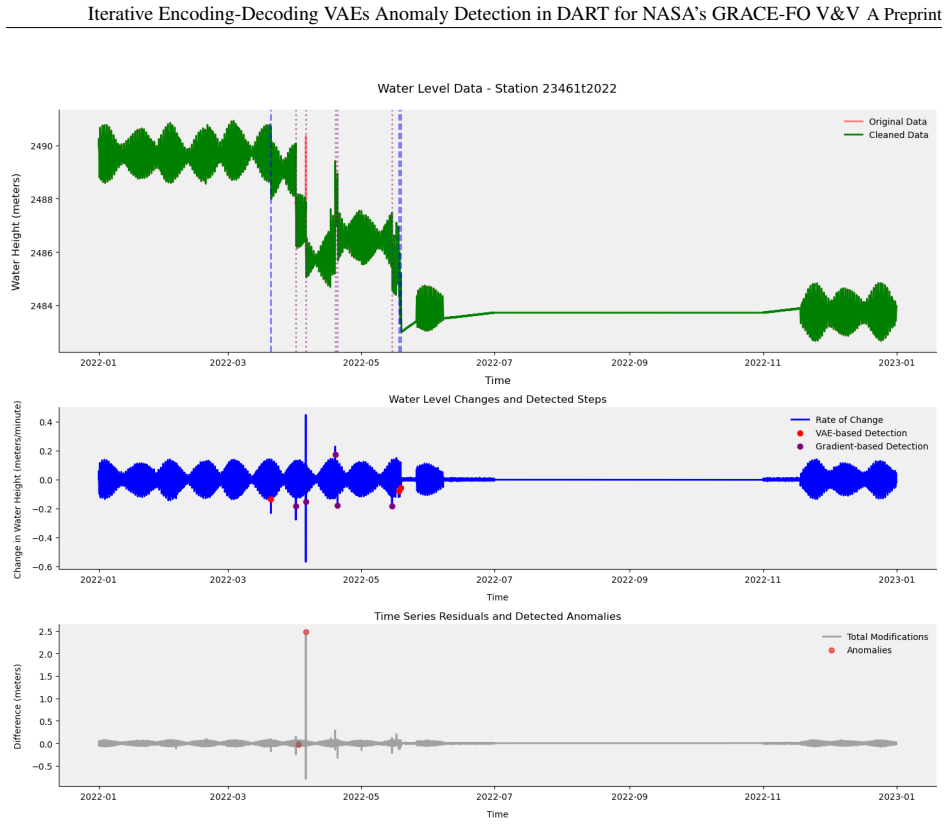
The central discovery claimed is that iterative encoding-decoding with a variational autoencoder outperforms traditional despiking and step-detection techniques on a hard test record, DART Station 23461, 2022. The pipeline trains a single VAE on normalized contaminated data, computes reconstruction errors, flags spikes by rolling median deviation and steps by mean-shift across adjacent windows, then iterates: each cycle encodes the previous reconstruction into a 16-dimensional latent space, decodes it, updates the anomaly masks with dynamic thresholds, and replaces flagged samples with the model's reconstruction. After ten iterations and light smoothing, the output is claimed to keep tidal oscillations and distinguish genuine April-May level transitions from spurious spikes. The intended payoff is high-quality bottom-pressure records for validating a satellite gravity mission's ocean-mass measurements.
Load-bearing premise
The method assumes that a VAE trained on the raw contaminated record learns mostly normal ocean variability, so that reconstruction error marks anomalies and replacing flagged points with reconstructed values cleans the data instead of baking the anomalies in.
Editorial extensions
If this is right
- If the central claim is correct, bottom-pressure time series can be cleaned without training one filter per station; the same pretrained loop applied to normalized data should remove spikes and steps across records.
- Cleaned records would retain tidal and seasonal oscillations that median filters and wavelet thresholding tend to flatten, reducing false alarms in tsunami detection.
- The hybrid mask gives one procedure for both short spikes, through a 48-sample window, and longer level shifts, through a 480-sample window, simplifying operational data pipelines.
- Cleaner deep-ocean records would provide a stronger reference for validating satellite gravity ocean-mass measurements, since comparisons would no longer be corrupted by step artifacts.
Reading between the lines
- A natural extension the paper does not run is a seeded-anomaly recovery test: take a clean high-quality record, insert synthetic spikes and steps, and measure how well the loop recovers the known signal; that would isolate cleaning ability from the model's tendency to learn the very anomalies it is trained on.
- Because the loop never re-trains between iterations, it is essentially an inference-time refinement applied to a fixed latent model; the same trick could be tried on seismic or river-gauge records that have similar step-and-spike artifacts.
- The hand-set weights, including the 0.7 fusion factor, the 3.0 threshold scalar, and the ten iterations, suggest a testable robustness question: whether performance degrades gracefully as these constants vary, or whether the comparison to classical methods depends on that particular tuning.
Signed reviews
Editorial analysis
A structured set of objections, weighed in public.
Referee Report
Summary. The paper proposes an iterative encoding-decoding variational autoencoder (Iterative Encoding-Decoding VAE) for removing spikes, steps, and drifts from NOAA DART bottom-pressure time series, demonstrated on Station 23461 for 2022. The pipeline trains a VAE on normalized contaminated data, computes anomaly masks from reconstruction errors and rolling statistics, and then iteratively replaces flagged points with the model's own reconstructions before post-processing. The central claim is that this method outperforms traditional despiking and step-detection techniques while preserving oceanographic features such as tides.
Significance. The problem domain is important for tsunami detection and satellite oceanography validation, and the iterative refinement idea is a plausible extension of standard VAEs. However, the paper's evidence for the central claim is entirely visual: it never compares against median filters, wavelets, or thresholding baselines, provides no ground-truth or synthetic benchmarks, and does not report precision, recall, or F1 scores for the detected anomalies. The evaluation is also circular because the correction rule uses the same reconstruction-error-based anomaly score that defines the anomalies. The paper's strengths are the clear problem statement and the hybrid detection architecture; the significance of the contribution is not currently substantiated.
major comments (5)
- [Section 1; Sections 5-6] The central claim that the proposed approach 'outperforms the traditional despiking and step detection techniques' is not tested against any classical baseline. Sections 5 and 6 report only original-vs-cleaned plots, residual magnitudes, and training-loss behavior; there is no comparison with median filters, wavelets, or thresholding on the same data, and no quantitative metric such as F1, precision/recall, or RMSE against a reference signal. Without such a comparison, the paper's headline claim is unsupported.
- [Section 4.2.3 and 4.2.4, Eqs. (20)-(21) and (27)] The evaluation is circular: anomalies are identified by reconstruction error (Eq. 20) exceeding a threshold based on its own mean and standard deviation (Eq. 21), and then those same points are corrected by replacing them with the model's own reconstruction (Eq. 27). The residual plot in Figure 2 is therefore essentially a visualization of the anomaly score used to define the labels, so it cannot independently demonstrate that spikes were removed rather than genuine signal distorted.
- [Algorithm 4.1; Section 6.2.4; Section 6.3.3] Training schedule details are internally inconsistent. Algorithm 4.1 states e = 1000 epochs, but Section 6.3.3 reports that the model converges at 30-35 epochs and that early stopping is used with max epoch limit 1000, while Section 6.2.4 gives a patience of 10 epochs and a minimum improvement threshold of 1e-4. It is therefore unclear how many epochs actually trained the model that produced the reported results, which affects the reproducibility of the iterative refinement claim.
- [Section 3.1, Eq. (11)] The global skip connection can leak anomalies into the output. Eq. (11) defines final_output = decoder_output + beta * input_signal with beta initialized at 0.8, meaning the original contaminated input (including spikes and steps) is directly added to the cleaned reconstruction. The paper does not analyze the magnitude of this leak or provide an ablation without the skip connection, so the claim that anomalies are removed is not established for this architecture.
- [Section 4.2.2, Step 2] The assumption that a VAE trained on the raw contaminated series learns a latent distribution dominated by normal variability is untested. Training is performed on the normalized x_tilde before any anomaly removal, so if spikes or steps are frequent or large, the latent distribution will encode them. No synthetic experiment with known ground truth is presented to verify that reconstruction error is actually elevated at anomalies rather than at normal tidal extrema or model-capacity limitations.
minor comments (7)
- [Section 3.1] There are several typos: 'utiltized' should be 'utilized', 'detortions' should be 'distortions', and in Section 6.2 'moel' should be 'model'.
- [Eqs. (18), (25)] The notation p_theta(x_hat^(k-1)|z) is not a standard likelihood because x_hat^(k-1) is a deterministic reconstruction of the previous iteration, not an observation. The intended generative model should be defined more carefully.
- [Figure 3] The training-history plot is described as showing convergence over 10 iterations, but the figure has no labeled axes or legend, so the reported behavior cannot be verified from the plot.
- [Section 6.5.2, Eq. (52)] Eq. (52) writes x_hat_final = x_hat + x, which is inconsistent with Eq. (11) where the skip term is beta * input_signal; the relationship between these two formulations should be reconciled.
- [Section 6.2.1 vs. Section 3.2.2] Warm-up and cosine decay learning-rate schedules are introduced in Section 6.2.1, but Section 3.2.2 only describes the exponential decay of Eq. (14). The actual schedule used for the reported results should be clearly specified.
- [References [5], [16]] Reference [5] (Bernard and Meinig) lacks a year and venue, and reference [16] (Hochreiter and Schmidhuber) is missing full publication details; these should be completed.
- [General reproducibility] The paper does not state whether code, trained models, or the processed dataset will be released, which limits reproducibility given the absence of quantitative results and the reliance on visual inspection.
Circularity Check
Anomaly detection and correction are defined by the same reconstruction error; residual-based validation is circular and no external baseline or ground truth is used.
-
self definitional
[Section 4.2.3, Eqs. (20)-(21)]
"RE_i = |x~_i − xhat~_i| (20) ... A high reconstruction error indicates that the model is unable to accurately reconstruct the data point, suggesting a potential anomaly. ... τ_re = μ_RE + κσ_RE (21)."
The anomaly set is defined as the points whose reconstruction error exceeds a threshold computed from the mean and standard deviation of those same reconstruction errors. Therefore, showing that 'detected anomalies' have large reconstruction error in the residual plot (Section 5.3, Figure 2) restates the definition. It cannot establish that those points correspond to true spikes or steps, nor that the model outperforms classical detection techniques.
-
self definitional
[Section 4.2.4, Eq. (27); Section 5.3]
"For data points identified as anomalies, replace them with the reconstructed values: xhat~_i^(k) = xhat~_i^(k) if i ∈ Ms^(k) ∪ Ml^(k), xhat~_i^(k−1) otherwise (27). ... The residual plot analysis in Figure 2 illustrates how well the Iterative Encoding-Decoding V AEs algorithm can detect spikes and correct anomalies."
After Eq. (27), every flagged point in the cleaned series is set to the VAE's own reconstruction, so the original-versus-cleaned residual used as evidence is the same reconstruction-error quantity used to score anomalies in Eqs. (20) and (26). The visible separation between 'anomalies' and background is therefore produced by the thresholding rule itself, not by independent validation against known spikes, steps, or preserved oceanographic signals.
full rationale
The concrete circularity is in the detection-and-validation loop. Equations 20-21 define anomalies as points where original-minus-VAE-reconstruction error exceeds a threshold built from that same error distribution; Eq. (27) then replaces flagged points with the model's reconstruction. The residual plots in Section 5.3 thus display essentially the same reconstruction error that generated the flags, so the claimed 'clear separation' and 'corrected anomalies' follow by construction rather than from independent evidence that real spikes or steps were removed. The paper's central comparative claim in Section 1 that the method 'outperforms the traditional despiking and step detection techniques' is never tested against any classical baseline or independent reference signal in Sections 5-6; that is an evidentiary gap, not a circular reduction, so it does not by itself raise the score. Self-citations such as [4], [23], and [29] are background references and are not load-bearing, and there is no imported uniqueness theorem. The model is a genuine ML pipeline whose equations are not logically equivalent to the input, so the circularity is partial rather than total; the score is 6.
Assumptions & free parameters
free parameters (10)
- latent_dimension d =
16
- iteration_count n =
10
- anomaly thresholds kappa, tau_s, tau_l =
κ=3.0, τs=3.0, τl=0.05
- window sizes w_s, w_l =
48 and 480 samples
- hybrid weight alpha =
0.7 detection, 0.5 latent blending
- dropout schedule parameters =
min(0.1 + 0.05*l, 0.3)
- skip connection weights beta0, lambda =
β0=0.8, λ=0.5
- learning rate schedule =
base_lr=1e-4, decay_steps=100
- auxiliary loss weights =
λ=0.1 temporal, λ unspecified in Eq. 53
- Gaussian smoothing window =
6
assumptions (5)
- ad hoc to paper A VAE trained on contaminated data learns a latent distribution dominated by normal patterns, so reconstruction error is a valid anomaly score.
- domain assumption Linear interpolation and z-score normalization preserve the temporal structure needed for window-based learning.
- ad hoc to paper Iterating the same encoder-decoder n times converges to a cleaner signal rather than amplifying reconstruction artifacts.
- domain assumption Window sizes 48 and 480 capture the relevant spike and step time scales for DART records.
- domain assumption DART Station 23461 (2022) is representative enough to support general claims about other DART stations.
Cite this review
Pith. "Pith review of Iterative Encoding-Decoding VAEs Anomaly Detection in NOAA's DART Time Series: A Machine Learning Approach for Enhancing Data Integrity for NASA's GRACE-FO Verification and Validation." pith.science (2026). https://pith.science/paper/CIXNC5QY
@misc{pith2026241216375,
  author       = {Pith},
  title        = {Pith review of: Iterative Encoding-Decoding VAEs Anomaly Detection in NOAA's DART Time Series: A Machine Learning Approach for Enhancing Data Integrity for NASA's GRACE-FO Verification and Validation},
  year         = {2026},
  howpublished = {\url{https://pith.science/paper/CIXNC5QY}},
  note         = {Machine review of arXiv:2412.16375}
}
read the original abstract
NOAA's Deep-ocean Assessment and Reporting of Tsunamis (DART) data are critical for NASA-JPL's tsunami detection, real-time operations, and oceanographic research. However, these time-series data often contain spikes, steps, and drifts that degrade data quality and obscure essential oceanographic features. To address these anomalies, the work introduces an Iterative Encoding-Decoding Variational Autoencoders (Iterative Encoding-Decoding VAEs) model to improve the quality of DART time series. Unlike traditional filtering and thresholding methods that risk distorting inherent signal characteristics, Iterative Encoding-Decoding VAEs progressively remove anomalies while preserving the data's latent structure. A hybrid thresholding approach further retains genuine oceanographic features near boundaries. Applied to complex DART datasets, this approach yields reconstructions that better maintain key oceanic properties compared to classical statistical techniques, offering improved robustness against spike removal and subtle step changes. The resulting high-quality data supports critical verification and validation efforts for the GRACE-FO mission at NASA-JPL, where accurate surface measurements are essential to modeling Earth's gravitational field and global water dynamics. Ultimately, this data processing method enhances tsunami detection and underpins future climate modeling with improved interpretability and reliability.
Figures


Figures from the paper (1 more)

Reference graph
Works this paper leans on
-
[1]
M. Abadi et al. TensorFlow: A system for large-scale machine learning. In12th USENIX Symposium on Operating Systems Design and Implementation, pages 265–283, 2016
work page 2016
-
[2]
D. A. Adams et al. DART: Deep-ocean assessment and reporting of tsunamis. Technical Report OAR PMEL-139, NOAA, 2017
work page 2017
-
[3]
S. Aminikhanghahi and D. J. Cook. A survey of methods for time series change point detection. Knowledge and Information Systems, 51(2):339–367, 2017
work page 2017
- [4]
-
[5]
E. N. Bernard and C. Meinig. Historical background. In Development of the DART Tsunami Buoys
-
[6]
R. Bombarelli et al. Automatic chemical design using a data-driven continuous representation of molecules. ACS Cent. Sci., 4(2):268–276, 2018
work page 2018
-
[7]
G. E. P. Box, G. M. Jenkins, G. C. Reinsel, and G. M. Ljung. Time Series Analysis: Forecasting and Control. Wiley, 5 edition, 2015
work page 2015
-
[8]
T. Chen et al. Training deep nets with sublinear memory cost. arXiv preprint arXiv:1604.06174, 2016
arXiv 2016
Show all 29 references
-
[9]
R. B. Cleveland, W. S. Cleveland, J. E. McRae, and I. Terpenning. STL: A seasonal-trend decomposition procedure based on loess. Journal of Official Statistics, 6(1):3–73, 1990
1990
-
[10]
C. Doersch. Tutorial on variational autoencoders. arXiv preprint arXiv:1606.05908, 2016
2016 arXiv
-
[11]
D. L. Donoho. De-noising by soft-thresholding. IEEE Trans. Inf. Theory, 41(3):613–627, 1995
1995
-
[12]
F. I. Gonzalez, E. N. Bernard, C. Meinig, M. C. Eble, H. B. Milburn, J. M. Venturato, and H. O. Mofjeld. The Tsunami Capable Buoy: The DART II System. InProc. OCEANS 2005 MTS/IEEE, pages 1801–1806, Washington, D.C., USA, 2005
2005
-
[13]
Goodfellow, Y
I. Goodfellow, Y . Bengio, and A. Courville. Deep Learning. MIT Press, 2016
2016
-
[14]
I. J. Goodfellow et al. Generative adversarial nets. In Advances in Neural Information Processing Systems 27, pages 2672–2680, 2014
2014
-
[15]
F. R. Hampel. The influence curve and its role in robust estimation. J. Amer. Statist. Assoc., 69(346):383–393, 1974
1974
-
[16]
Hochreiter and J
S. Hochreiter and J. Schmidhuber. Long short-term memory. Neural Comput., 9(8):1735–1780, 1997
1997
-
[17]
Ioffe and C
S. Ioffe and C. Szegedy. Batch normalization: Accelerating deep network training by reducing internal covariate shift. In Proc. 32nd Int. Conf. Mach. Learn. (ICML), pages 448–456, 2015
2015
-
[18]
M. T. Johnson et al. GRACE-FO: The Gravity Recovery and Climate Experiment Follow-On mission. J. Geophys. Res. Solid Earth, 124(8):9336–9360, 2019
2019
-
[19]
D. P. Kingma and J. Ba. Adam: A method for stochastic optimization. In Proc. 3rd Int. Conf. Learn. Representa- tions (ICLR), 2015. 24 Iterative Encoding-Decoding V AEs Anomaly Detection in DART for NASA’s GRACE-FO V&VA Preprint
2015
-
[20]
D. P. Kingma and M. Welling. An introduction to variational autoencoders. Found. Trends Mach. Learn., 12(4–5): 307–392, 2019
2019
-
[21]
F. W. Landerer et al. Extending the global mass change data record: GRACE Follow-On instrument and science data performance. Geophys. Res. Lett., 47(12):e2020GL088306, 2020
2020
-
[22]
A. S. Nair and K. R. Ramakrishnan. An improved thresholding method for signal denoising using wavelets.Signal Process., 91(2):358–367, 2011
2011
-
[23]
H. Park, J. An, and S. Cho. Multimodal deep autoencoders for anomaly detection and diagnosis in manufacturing systems. IEEE Trans. Ind. Informat., 14(7):3174–3183, 2018
2018
-
[24]
Pascanu, T
R. Pascanu, T. Mikolov, and Y . Bengio. On the difficulty of training recurrent neural networks. InProc. 30th Int. Conf. Mach. Learn. (ICML), pages 1310–1318, 2013
2013
-
[25]
Schlegl, P
T. Schlegl, P. Seeböck, S. M. Waldstein, U. Schmidt-Erfurth, and G. Langs. Unsupervised anomaly detection with generative adversarial networks to guide marker discovery. In Information Processing in Medical Imaging, pages 146–157, 2017
2017
-
[26]
K. Sohn, H. Lee, and X. Yan. Learning structured output representation using deep conditional generative models. In Advances in Neural Information Processing Systems 28, pages 3483–3491, 2015
2015
-
[27]
Srivastava et al
N. Srivastava et al. Dropout: A simple way to prevent neural networks from overfitting. Journal of Machine Learning Research, 15:1929–1958, 2014
1929
-
[28]
Sutskever, O
I. Sutskever, O. Vinyals, and Q. V . Le. Sequence to sequence learning with neural networks. In Advances in Neural Information Processing Systems 27, pages 3104–3112, 2014
2014
-
[29]
Zhou and R
C. Zhou and R. C. Paffenroth. Anomaly detection with robust deep autoencoders. In Proc. 23rd ACM SIGKDD Int. Conf. Knowledge Discovery and Data Mining, pages 665–674, 2017. 25
2017
Reviewed August 11, 2026 · model on record in the stance chip above.
Discussion (0). Continue with ORCID to comment.