REVIEW 3 major objections 7 minor 9 references
Cross-Process Defect Attribution using Potential Loss Analysis
T0 review · 3 major / 7 minor · reviewed 2026-08-15 · deepseek-v4-flash
Pith's one-line read The paper claims that wafer defect blame can be computed per process step by solving a Bellman equation, giving a non-negative score per step plus a defect-density predictor from one fitted value function.
desk verdict Useful but overclaimed: a monotone trajectory regressor dressed as Bellman optimal control, with real data and a fixable gap. read the letter →
The pith
A machine-rendered reading of the paper's core claim, the machinery that carries it, and where it could break.
The reading
What carries the argument
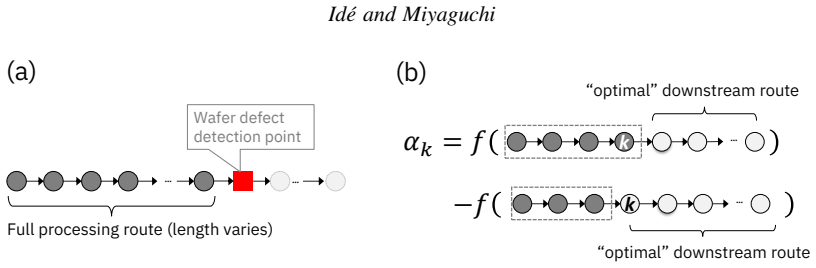
The central object is the Bellman equation $F^*(z_1)=\min_{x_1,x_2,\ldots}\mathbb{E}\left[\sum_t C(z_t)\right]$, which defines the best expected cumulative loss achievable from a wafer state by choosing optimal downstream process routes. Since the full optimization over unobserved routes is intractable, the paper replaces the Bellman optimality condition with the inequality $F_\theta(z) \le C(z) + F_\theta(z')$ on observed transitions, enforced as a temporal-difference-style penalty in the objective. The difference in value between consecutive states is modeled by a positive-output network $G_\theta(z_{t},z_{t+1}) = F_\theta(z_{t+1}) - F_\theta(z_t)$, and this network is the attribution engine: its output at transition $k$ is the blame score $\alpha_k$.
What would settle it
Run a controlled experiment with two downstream routes after a fixed upstream step: one route that repairs most defects and one that leaves them. Train PLA only on wafers that took the non-repairing route. If the blame score assigned to the upstream step does not decrease when wafers with the repairing route are then added to the training set, the framework is not actually comparing optimal downstream routes; it is only fitting the observed transitions.
Extended reading notes
Core claim
The central discovery is that process attribution can be reframed from comparing predictions with and without a process to comparing the best possible outcomes with and without a process. The paper formalizes the best possible outcome as $F^*(z_1) = \min_{x_1,x_2,\ldots} F(z_1 \mid x_1,x_2,\ldots)$, the Bellman optimal value for the expected cumulative defect loss from wafer state $z_1$, and defines the attribution score of process $k$ as $\alpha_k = F_\theta(z_k) - F_\theta(z_{k-1})$, the fitted value increase along the observed transition. Because the value function is constrained to be non-decreasing along every observed transition, these scores are guaranteed non-negative and carry no dependence on an arbitrary reference point such as a zeroed-out process embedding or a population mean. The same fitted $F_\theta$ also predicts the terminal defect density through the regression term of the objective, so attribution and prediction share one model rather than requiring a separate explanation step.
Load-bearing premise
The load-bearing premise is that the training wafers span enough alternative downstream routes to pin down what the best possible continuation really is; the algorithm never generates or optimizes over unseen routes, so if the data contain only one kind of downstream continuation, the fitted best outcome is only the best outcome visible in the data.
Editorial extensions
If this is right
- Attribution scores are non-negative by construction, so cumulative defect-blaming curves never dip below zero and stay interpretable even for wafers with near-average defect density.
- One fitted value function does double duty as a defect-density predictor and an attribution model, so fab analysis no longer needs a separate explainability step bolted onto a prediction model.
- Because downstream process embeddings are not zeroed out, the scores do not depend on the coordinate origin or population mean of the process embedding, removing the arbitrary-reference-point problem faced by attribution methods that require a baseline input.
- Cumulative PLA curves can point to specific events in the route, such as long wait times at a tool, giving process engineers a direct lead for root-cause investigation.
- Training requires only observed route histories and terminal defect measurements, and with 787 wafers the framework is usable in real fab settings where the number of wafers is small relative to route combinatorics.
Reading between the lines
- Beyond the paper, the same Bellman-inequality surrogate would transfer to any sequential process with embedded actions and a terminal outcome, such as other multistage manufacturing lines or clinical treatment pathways.
- The non-negativity guarantee is a property of the model class, namely a positive-output difference network, not evidence about causal structure; a testable extension would perturb a single process embedding and check whether the blame shifts to the process that actually changed.
- The framework's blame definition depends on the state representation carrying enough information about upstream history; if two distinct upstream states map to the same $z$, attribution between them is unidentifiable, so measuring score stability under embedding dimensionality is a natural stress test.
- If a fab later changes a downstream recipe to reduce defects, PLA's upstream scores should fall even when upstream processes are untouched; this is a concrete prediction that could validate the optimal-downstream interpretation on real data.
Signed reviews
Editorial analysis
A structured set of objections, weighed in public.
Referee Report
Summary. This paper proposes Potential Loss Analysis (PLA), a framework for attributing wafer defect densities to individual process steps in heterogeneous processing routes. PLA models wafer processing as a sequential decision process and defines an optimal expected cumulative loss F* through a Bellman minimization over downstream actions (Eq. (13)). The paper claims that a tractable objective (Eq. (21)) solves this optimization jointly with prediction, and defines the attribution score for process k as α_k = F_θ(z_k) - F_θ(z_{k-1}) (Eq. (23)), guaranteed non-negative through a ReLU-parameterized difference (Eq. (22)). Experiments on 787 wafers from an FEOL fab report improved prediction correlation over PTR (0.87 vs. 0.61) and more interpretable cumulative attribution curves. The main conceptual claim is that PLA removes the arbitrary reference point of Shapley-style methods by comparing best possible downstream outcomes.
Significance. If the Bellman-optimality interpretation were valid, PLA would be a meaningful step: it would provide reference-free, path-dependent attribution and simultaneous prediction from a single fitted value function, and the empirical study on real fab data is a useful point of reference for the semiconductor manufacturing community. The paper is clearly written, and the idea of imposing monotonicity to obtain non-negative, interpretable attribution scores is attractive. However, the connection between the Bellman equation and the implemented objective is not established, and the empirical comparison does not isolate the method's contribution. As presented, the central claim is substantially overstated; the framework reduces to a monotone trajectory regressor whose attribution scores are differences of fitted predictions. The paper's value would be greatly improved by either providing a rigorous derivation of the Bellman reduction with an explicit action set and transition model, or reframing the contribution as a heuristic monotone attribution method and validating it against ground truth.
major comments (3)
- [§4.2–4.4, Eqs. (13)–(21)] The derivation of the implemented algorithm from the Bellman equation is a load-bearing gap. Eq. (13) defines F* as a minimum over downstream actions under a stochastic transition model p(z'|z,x), but no action set, transition probabilities, or optimization over alternative continuations is ever introduced. After assuming deterministic transitions, Eq. (15) is only a necessary inequality for a single observed transition. Imposing this inequality on the observed (z,z') pairs and maximizing ΣF_θ (Eqs. (16)–(18)) yields, at best, the largest monotone function consistent with the training routes, not the minimum over alternative downstream routings. The 'optimal downstream route' in Fig. 1(b) is therefore never constructed. Because the claimed advantage of PLA over PTR rests on this optimality interpretation, the central contribution is not supported as stated.
- [§4.4–4.5, Eqs. (21)–(23)] The final objective is a supervised regression with a monotonicity penalty, not a Bellman solver. Eq. (21) combines the terminal squared loss (y - F_θ(z_L))^2, which is the same supervised objective used in PTR, with a soft penalty on consecutive observed states. Non-negativity of α_k is enforced by the ReLU parameterization in Eq. (22), not derived from any optimality property. Consequently, α_k = F_θ(z_k) - F_θ(z_{k-1}) is a difference of fitted predictions from a monotone regressor, and its interpretation as a comparison of best possible outcomes is not established. The statement after Eq. (21) that 'more detailed mathematical analysis' implies F_θ(z_{t+1}) ≥ F_θ(z_t) is unproved; it should be either proved or explicitly labeled as an assumption.
- [§5.2, Fig. 4] The empirical evaluation does not provide controlled evidence for the attribution claims. PTR is implemented with a linear model while PLA uses a two-hidden-layer neural network, so the reported prediction-correlation improvement (0.87 vs. 0.61) is confounded by model capacity. More importantly, the attribution scores are evaluated only qualitatively on two wafers, with no ground-truth root causes, ablations, or comparison to alternative attribution methods. The claim that PLA 'pinpoints problematic processes' is thus supported only by visual inspection of two examples. A fair comparison (e.g., PTR with the same network architecture) and a quantitative attribution evaluation would be necessary to support the practical claims.
minor comments (7)
- [§4.4, Eq. (18)] Eq. (18) writes R(θ|µ), but the final objective in Eq. (21) involves both µ and µ_i; please clarify the relationship between the two hyperparameters.
- [§4.4, Eq. (21)] The sentence following Eq. (21) refers to 'more detailed mathematical analysis' without a proof or a reference; if the monotonicity property is a theorem, include its proof or a pointer to a complete derivation.
- [§5.2] In Sec. 5.2, 'correlation efficient' should read 'correlation coefficient.'
- [Fig. 4] Fig. 4 uses '(C)' and '(D)' in the caption but the text cites 'Figs. 4 (c) and (d)'; please make the capitalization consistent.
- [References] References contain malformed author lists, e.g., 'Han, et al., S.' and 'Lvet al.'; these should be corrected.
- [Eq. (24)] Eq. (24) uses F_θ(z_0) without defining z_0; if z_0 denotes the zero initial state used in Eq. (8), please state this explicitly.
- [General] The derivation depends on the unpublished companion paper Miyaguchi (2025); for journal publication, the present manuscript should be self-contained, especially for the key step from Eq. (13) to Eq. (21).
Circularity Check
The PLA attribution score is, by construction, a finite difference of the same F_theta that is fitted to observed defect densities; the 'best possible outcome' semantics is not independently realized.
-
fitted input called prediction
[Sec. 4.4, Eqs. (21)-(22); Sec. 4.5, Eq. (23)]
"Gθ (zzzt,zzzt+1) ≜ F θ (zzzt+1)− F θ (zzzt) = ReLUθ (zzzt⊕ zzzt+1) ... αk(ξ ) ≜ Gθ (zzzk−1,zzzk) (PLA). ... the term {y(n)− F θ (zzz(n)L(n))}2 in Eq. (21) ensures that F θ (zzz) is a reasonable estimator of terminal loss at zzz∈ ST."
Eq. (23) defines the attribution score as the finite difference of F_theta along the observed trajectory. Eq. (21) fits F_theta to the observed terminal defect density y through the supervised squared-loss term (y - F_theta(z_L))^2, plus monotonicity and maximization terms. Thus alpha_k is not a comparison against an independently computed best possible outcome from Eq. (13); it is a difference of the same regressor fitted to y. The paper never specifies the action set or transition probabilities needed to actually minimize over downstream routes; instead, the Bellman inequality is imposed only on observed (z,z') pairs and the terminal regression term anchors F_theta to y.
full rationale
The paper does contain independent modeling content: it proposes a monotone state-space trajectory regressor with a TD-style regularizer, and it reports improved predictive correlation over the PTR baseline. The self-citations to Miyaguchi (2025) and Miyaguchi et al. (2025b) are not by themselves load-bearing, since the main equations are stated in the paper and no uniqueness theorem is invoked. However, the central advertised contribution, that PLA attributes defects by solving a Bellman equation for the best possible downstream route, is not realized by the implemented objective. Eq. (13) defines F* as a minimum over actions, while Eq. (21) only enforces the Bellman inequality on observed transitions and adds a supervised terminal squared error. Eq. (23) then defines alpha_k as F_theta(z_k) - F_theta(z_{k-1}), i.e., the finite difference of the model fitted to y. The 'prediction' of terminal defect density and the 'attribution' score therefore reduce to the same fitted function, and no external ground-truth counterfactuals are used to validate the optimal-route interpretation. This makes the central causal claim partially circular: the attribution is forced by the fitted regressor rather than derived from an independently solved optimal-control problem. Self-citations and model choices such as the ReLU monotonicity are not the main issue; the issue is the fitted value function being relabeled as an optimal counterfactual comparison. Hence a score of 6 is appropriate, reflecting partial circularity in the central claim while acknowledging the empirical regression work.
Assumptions & free parameters
free parameters (5)
- Temporal weighting function psi(t,t') =
log10(1+Delta t)
- Embedding dimensionality D =
not reported
- PLA regularization mu =
not reported
- PLA regularization mu_i =
not reported
- PTR regularization eta =
not reported
assumptions (6)
- domain assumption The substring-kernel embedding of Eq. (2) maps heterogeneous process steps into a shared space where similarity is meaningful for defect prediction.
- domain assumption The additive wafer-state update z_k = z_{k-1} + psi(t_k,t_{k-1}) x_k (Eq. 4) is a valid model of how process steps combine to affect defect density.
- ad hoc to paper Transitions are deterministic and the Bellman inequality can be applied to observed (z,z') pairs without modeling the action set or transition probabilities.
- domain assumption Terminal defect density y is the only instantaneous cost; internal steps have zero cost (Eq. 11).
- standard math The linear programming approximation of De Farias and Van Roy (2003) is valid and tight enough for this problem.
- domain assumption The empirical distribution rho(z) in D adequately covers the wafer states and downstream routes needed to define the optimum.
Cite this review
Pith. "Pith review of Cross-Process Defect Attribution using Potential Loss Analysis." pith.science (2026). https://pith.science/paper/CL5QDKM6
@misc{pith2026250800895,
  author       = {Pith},
  title        = {Pith review of: Cross-Process Defect Attribution using Potential Loss Analysis},
  year         = {2026},
  howpublished = {\url{https://pith.science/paper/CL5QDKM6}},
  note         = {Machine review of arXiv:2508.00895}
}
read the original abstract
Cross-process root-cause analysis of wafer defects is among the most critical yet challenging tasks in semiconductor manufacturing due to the heterogeneity and combinatorial nature of processes along the processing route. This paper presents a new framework for wafer defect root cause analysis, called Potential Loss Analysis (PLA), as a significant enhancement of the previously proposed partial trajectory regression approach. The PLA framework attributes observed high wafer defect densities to upstream processes by comparing the best possible outcomes generated by partial processing trajectories. We show that the task of identifying the best possible outcome can be reduced to solving a Bellman equation. Remarkably, the proposed framework can simultaneously solve the prediction problem for defect density as well as the attribution problem for defect scores. We demonstrate the effectiveness of the proposed framework using real wafer history data.
Figures


Figures from the paper (1 more)

Reference graph
Works this paper leans on
-
[8]
“Improved Yield Prediction and Failure Analysis in Semiconductor Man- ufacturing with XGBoost and Shapley Additive exPlanations Models”. In 2024 IEEE International Symposium on the Physical and Failure Analysis of Integrated Circuits (IPFA) , 01–08. IEEE. Xu, F., H. Uszkoreit, Y . Du, W. Fan, D. Zhao, and J. Zhu
work page 2024
-
[9]
Soft-sensing conformer: A curriculum learning-based convolutional transformer
“Soft-sensing conformer: A curriculum learning-based convolutional transformer”. In 2021 IEEE International Conference on Big Data (Big Data) , 1990–1998. IEEE
work page 2021
-
[2009]
Travel-time prediction using Gaussian process regression: A trajectory-based approach
“Travel-time prediction using Gaussian process regression: A trajectory-based approach”. In Proceedings of the 2009 SIAM International Conference on Data Mining , 1185–1196. Idé, T., and M. Sugiyama
work page 2009
-
[2020]
Machine Learning Assisted New Product Setup
“Machine Learning Assisted New Product Setup”. In 2020 31st Annual SEMI Advanced Semiconductor Manufacturing Conference (ASMC), 1–5. Van der Maaten, L., and G. Hinton
work page 2020
-
[2021]
Explainable artificial intelligence (XAI) on timeseries data: A survey
“Explainable artificial intelligence (XAI) on timeseries data: A survey”. arXiv preprint arXiv:2104.00950. Rubin, D. B
-
[2022]
Graph representation and embedding for semiconductor manufacturing fab states
“Graph representation and embedding for semiconductor manufacturing fab states”. In 2022 Winter Simulation Conference (WSC), 3382–3393. IEEE. Selvaraju, R. R., M. Cogswell, A. Das, R. Vedantam, D. Parikh, and D. Batra
work page 2022
-
[2023]
Deep learning-based virtual metrology in multivariate time series
“Deep learning-based virtual metrology in multivariate time series”. In 2023 IEEE International Conference on Prognostics and Health Management (ICPHM) , 30–37. IEEE. Hsu, C.-Y ., and Y .-W. Lu
work page 2023
-
[2024]
“Enhanced Yield Prediction in Semiconductor Manufacturing: Innovative Strategies for Imbalanced Sample Management and Root Cause Analysis”. In 2024 IEEE International Symposium on the Physical and Failure Analysis of Integrated Circuits (IPFA) , 1–6. IEEE. Han, et al., S
work page 2024
Show all 9 references
-
[2025]
Path Learning with Trajectory Advantage Regression
“Path Learning with Trajectory Advantage Regression”. arXiv preprint arXiv:2506.19375 https://doi.org/10.48550/arXiv.2506.19375. Idé and Miyaguchi Miyaguchi, K., M. Joko, R. Sheraw, and T. Idé. 2025a. “Sequence-Aware Inline Measurement Attribution for Good-Bad Wafer Diagnosis”...
Reviewed August 15, 2026 · model on record in the stance chip above.
Discussion (0). Continue with ORCID to comment.